Copyright
©The Author(s) 2022.
World J Clin Cases. Jan 14, 2022; 10(2): 412-425
Published online Jan 14, 2022. doi: 10.12998/wjcc.v10.i2.412
Published online Jan 14, 2022. doi: 10.12998/wjcc.v10.i2.412
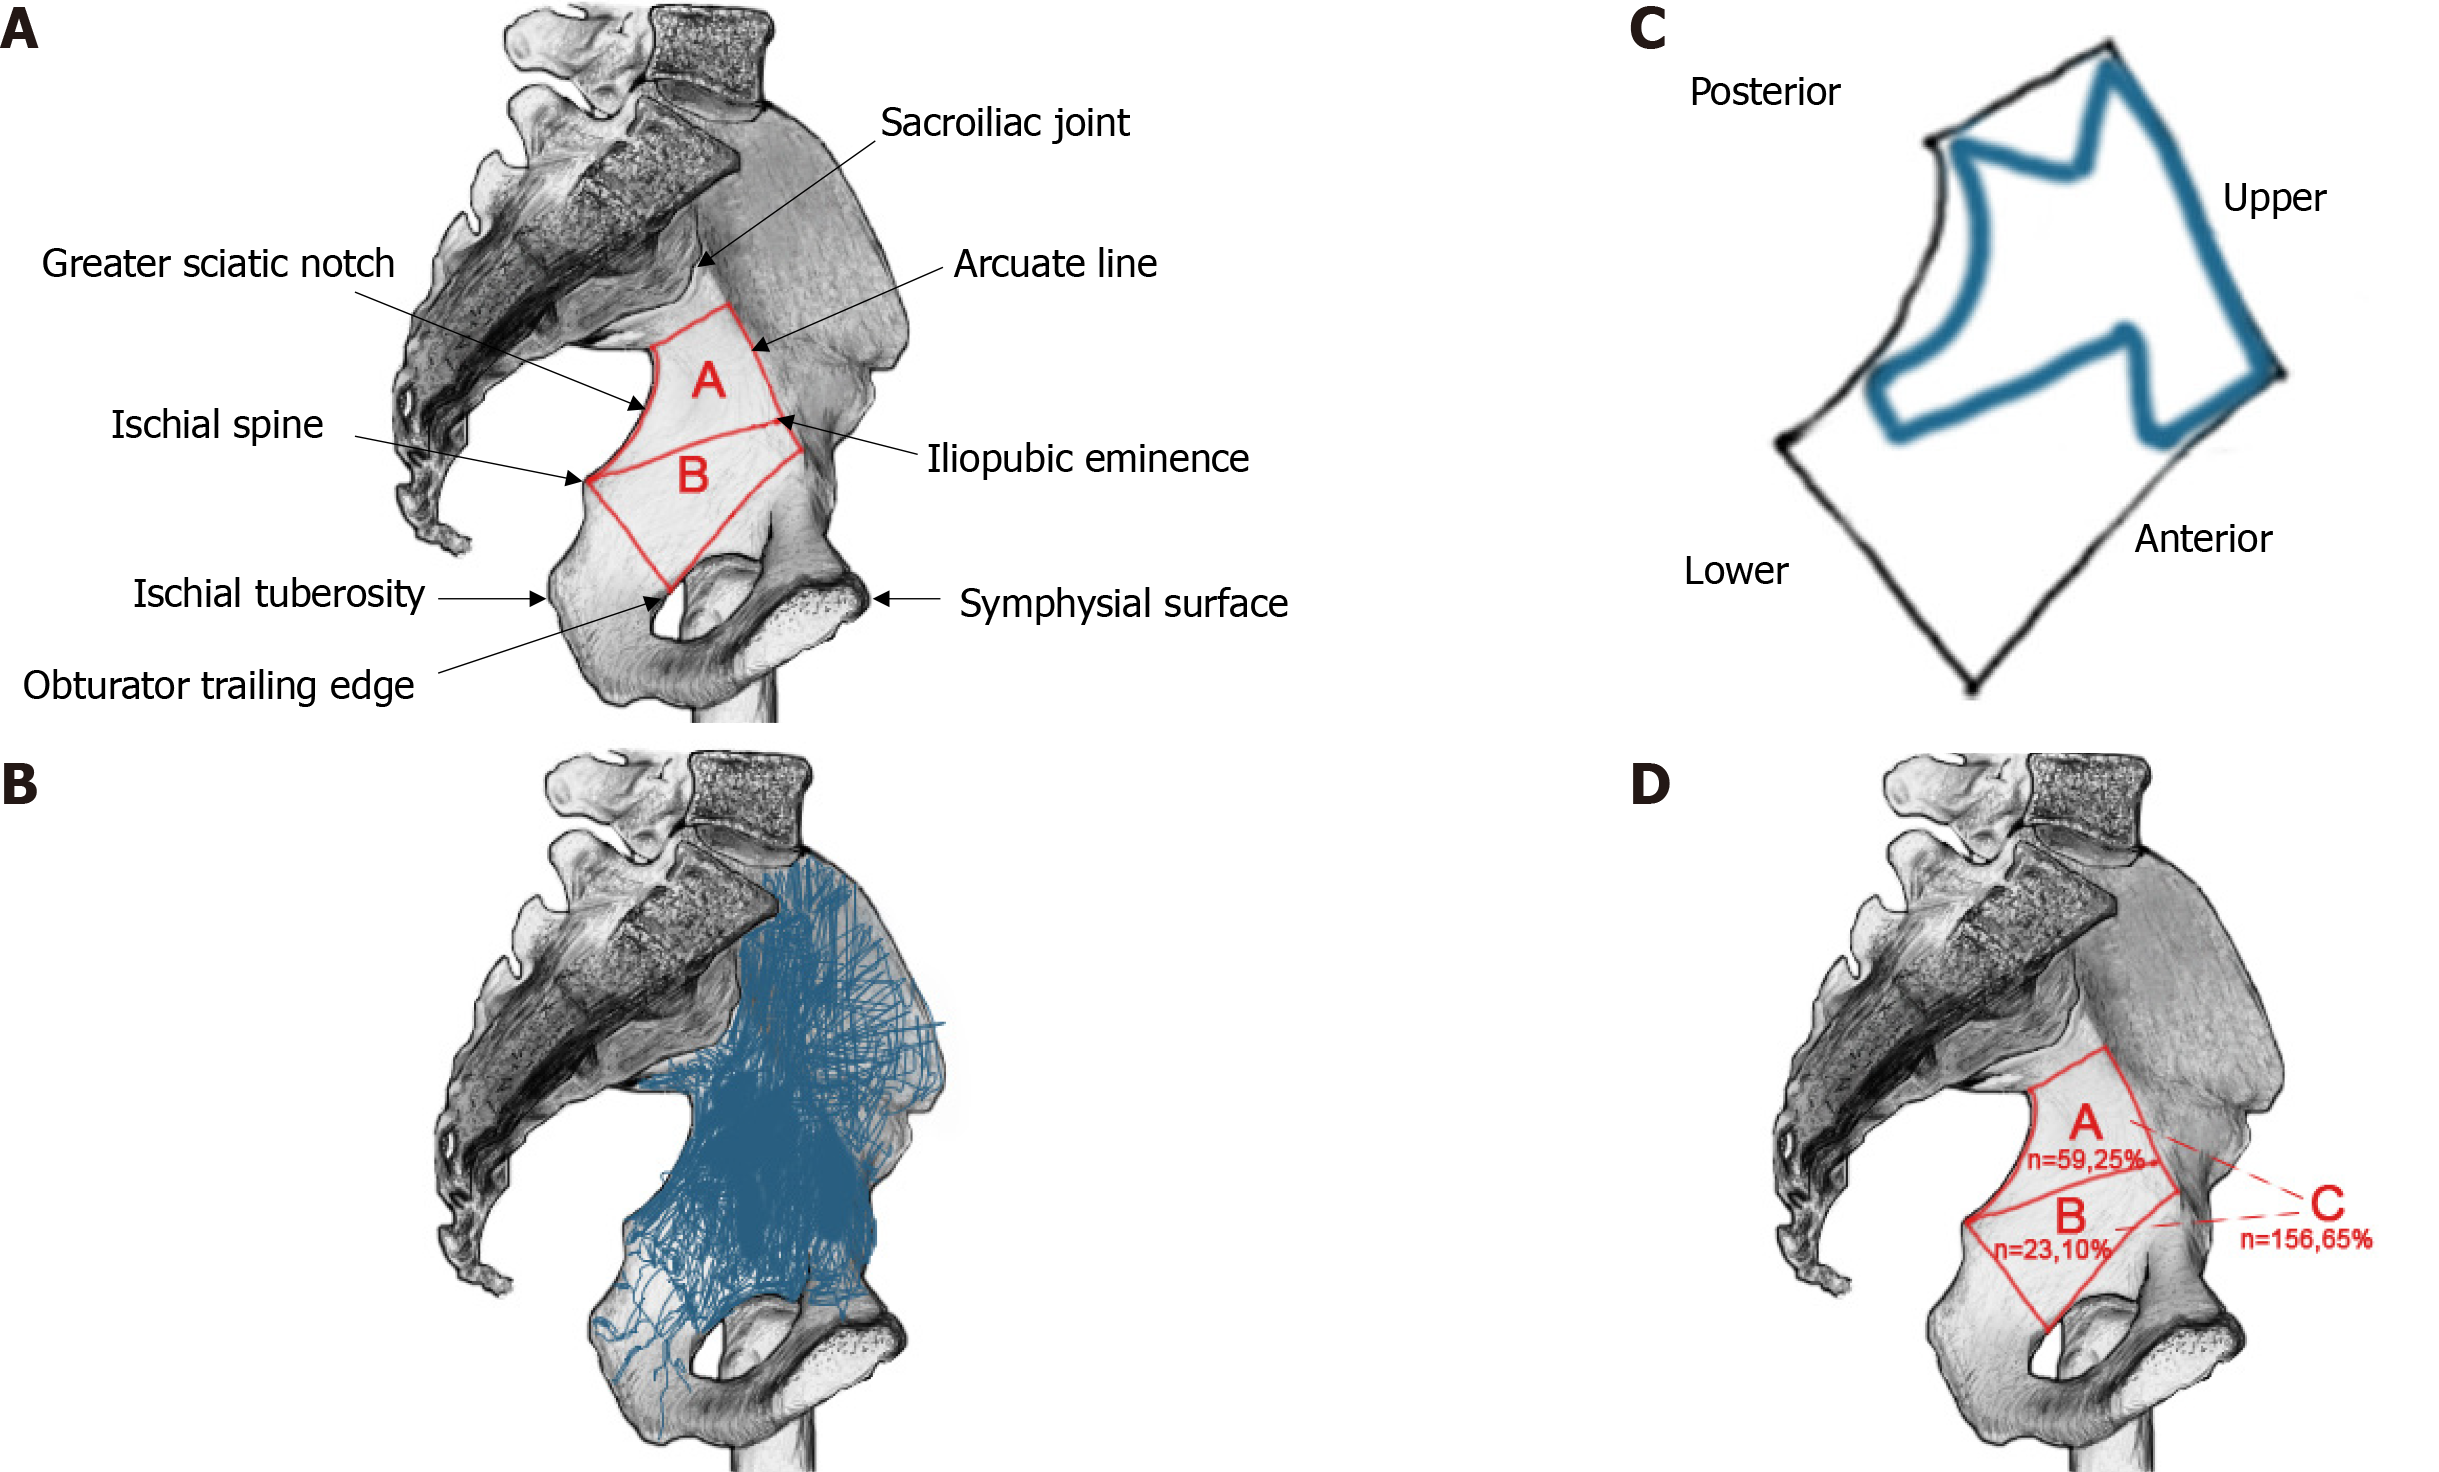
Figure 1 The classification map of fracture in the quadrilateral plate and the frequency map of different zones affected by fractures were drawn according to the research of Yang etal[14].
A: Hemipelvis anatomy and quadrilateral plate marked by the red lined area; B: This picture shows the fracture lines of all 238 superimposed fractures; C: This picture illustrates the “corridors” in which nearly three quarters of the major fracture lines occurred; D: Coded map showing the frequency (totals, percentages) of all fractures involved in the different zones indicated in the quadrilateral plate.
- Citation: Zhou XF, Gu SC, Zhu WB, Yang JZ, Xu L, Fang SY. Quadrilateral plate fractures of the acetabulum: Classification, approach, implant therapy and related research progress. World J Clin Cases 2022; 10(2): 412-425
- URL: https://www.wjgnet.com/2307-8960/full/v10/i2/412.htm
- DOI: https://dx.doi.org/10.12998/wjcc.v10.i2.412


