Copyright
©The Author(s) 2021.
World J Clin Cases. Mar 16, 2021; 9(8): 1814-1826
Published online Mar 16, 2021. doi: 10.12998/wjcc.v9.i8.1814
Published online Mar 16, 2021. doi: 10.12998/wjcc.v9.i8.1814
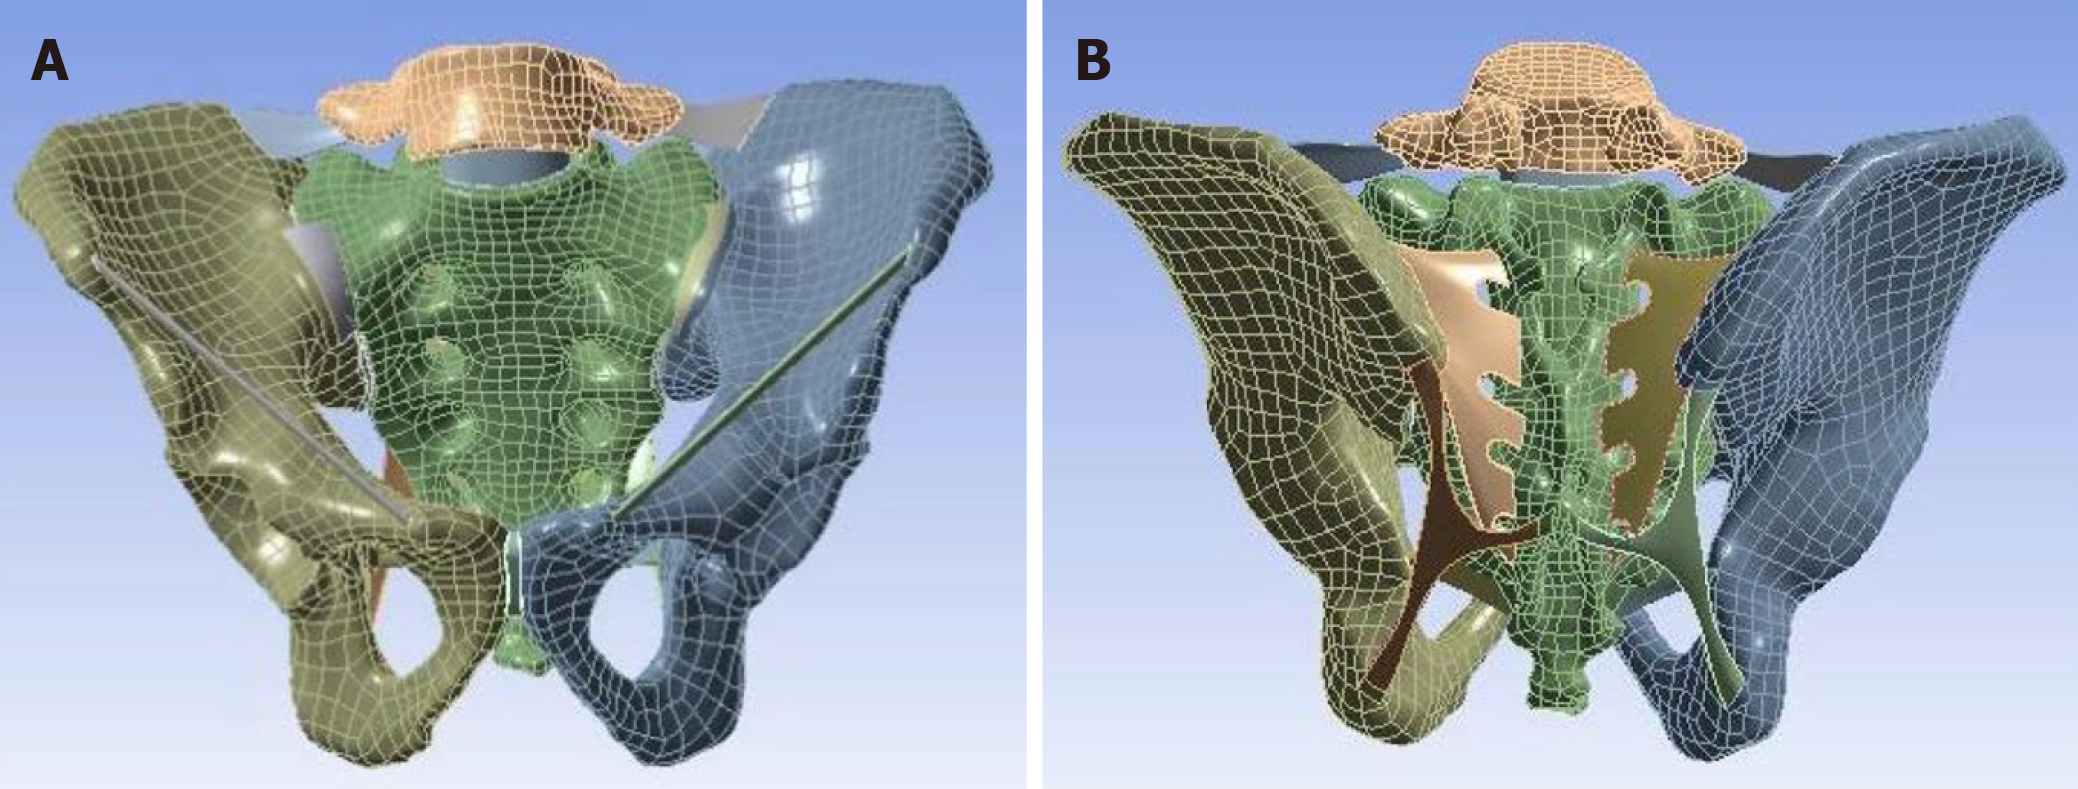
Figure 1 Finite element mesh of the pelvis model.
A: Front view; B: Back view.
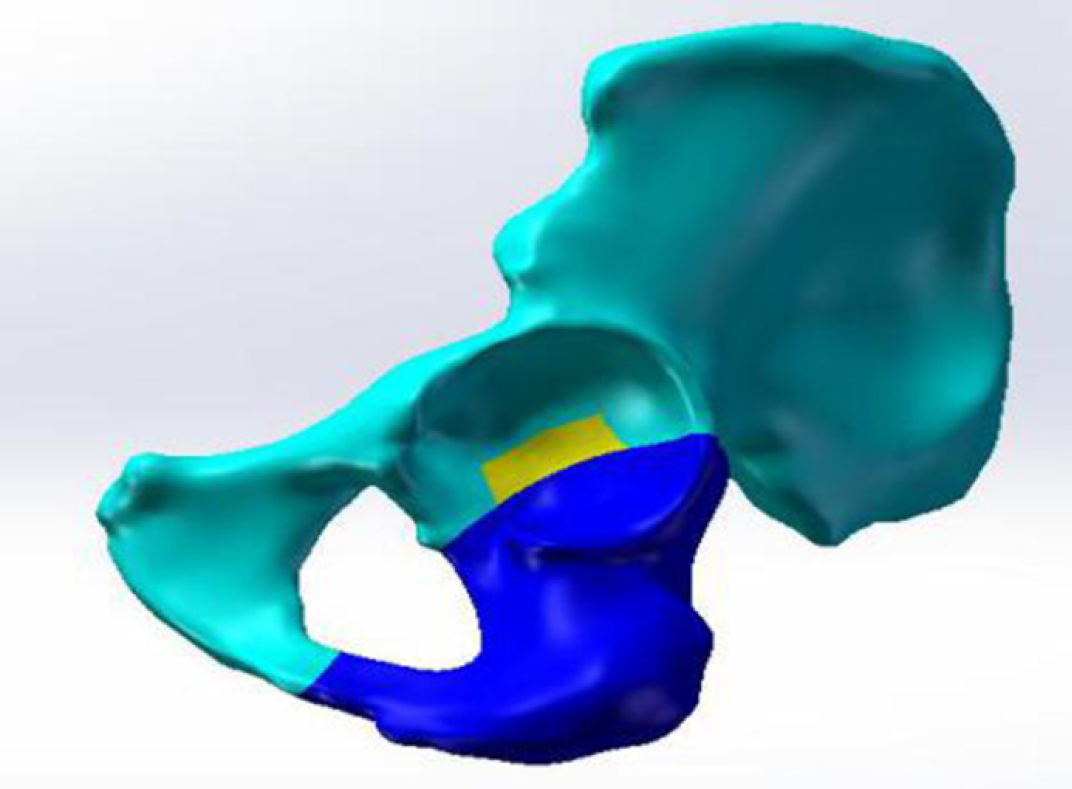
Figure 2 Establishment of the acetabular posterior column fracture model involving the quadrilateral area of the acetabulum.
Figure 3 Different internal fixation models of acetabular posterior column fractures involving the quadrilateral area of the acetabulum.
A: Combined plate of anterior and posterior columns; B: Internal iliac plate; C: Row nail; D: Triangle plate; E: Spring plate.
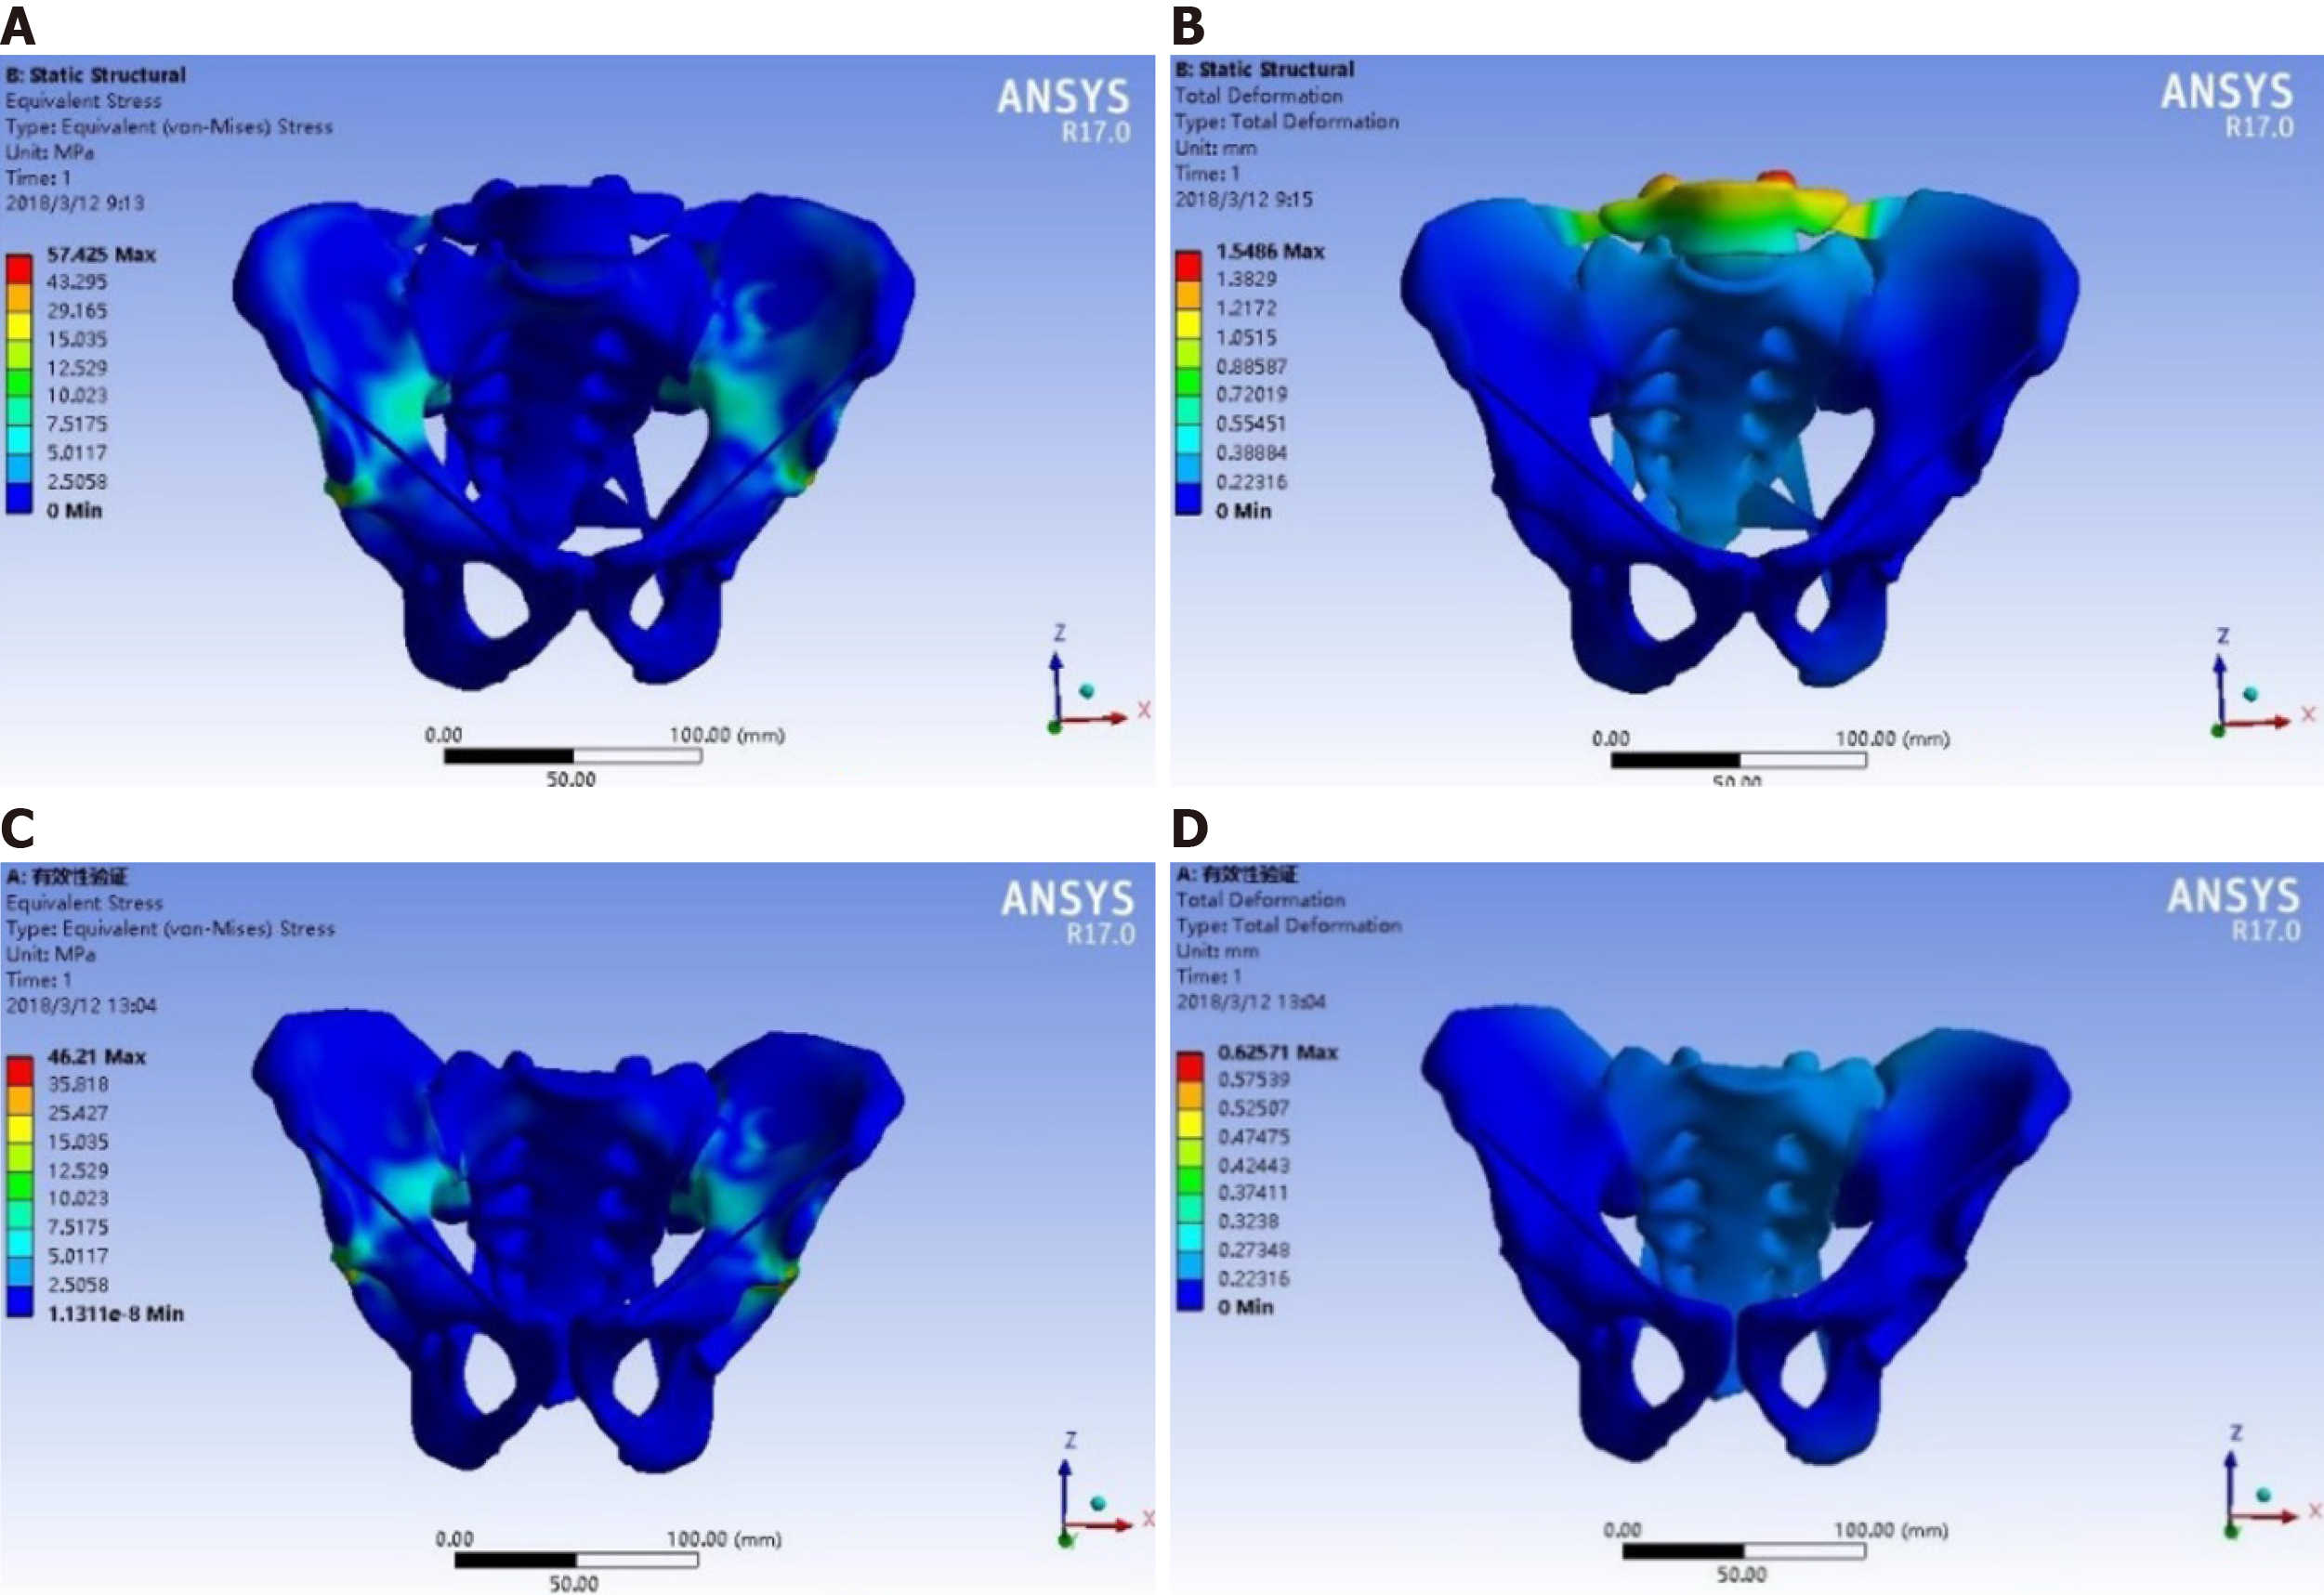
Figure 4 Stress distribution and displacement distribution of the pelvis in the standing and sitting positions.
Dark blue indicates the smallest stress and displacement, while light blue, green, yellow, orange, and red indicate gradually higher stress and larger displacement. A: Stress distribution in the standing position; B: Displacement distribution in the standing position; C: Stress distribution in the sitting position; D: Displacement distribution in the sitting position.
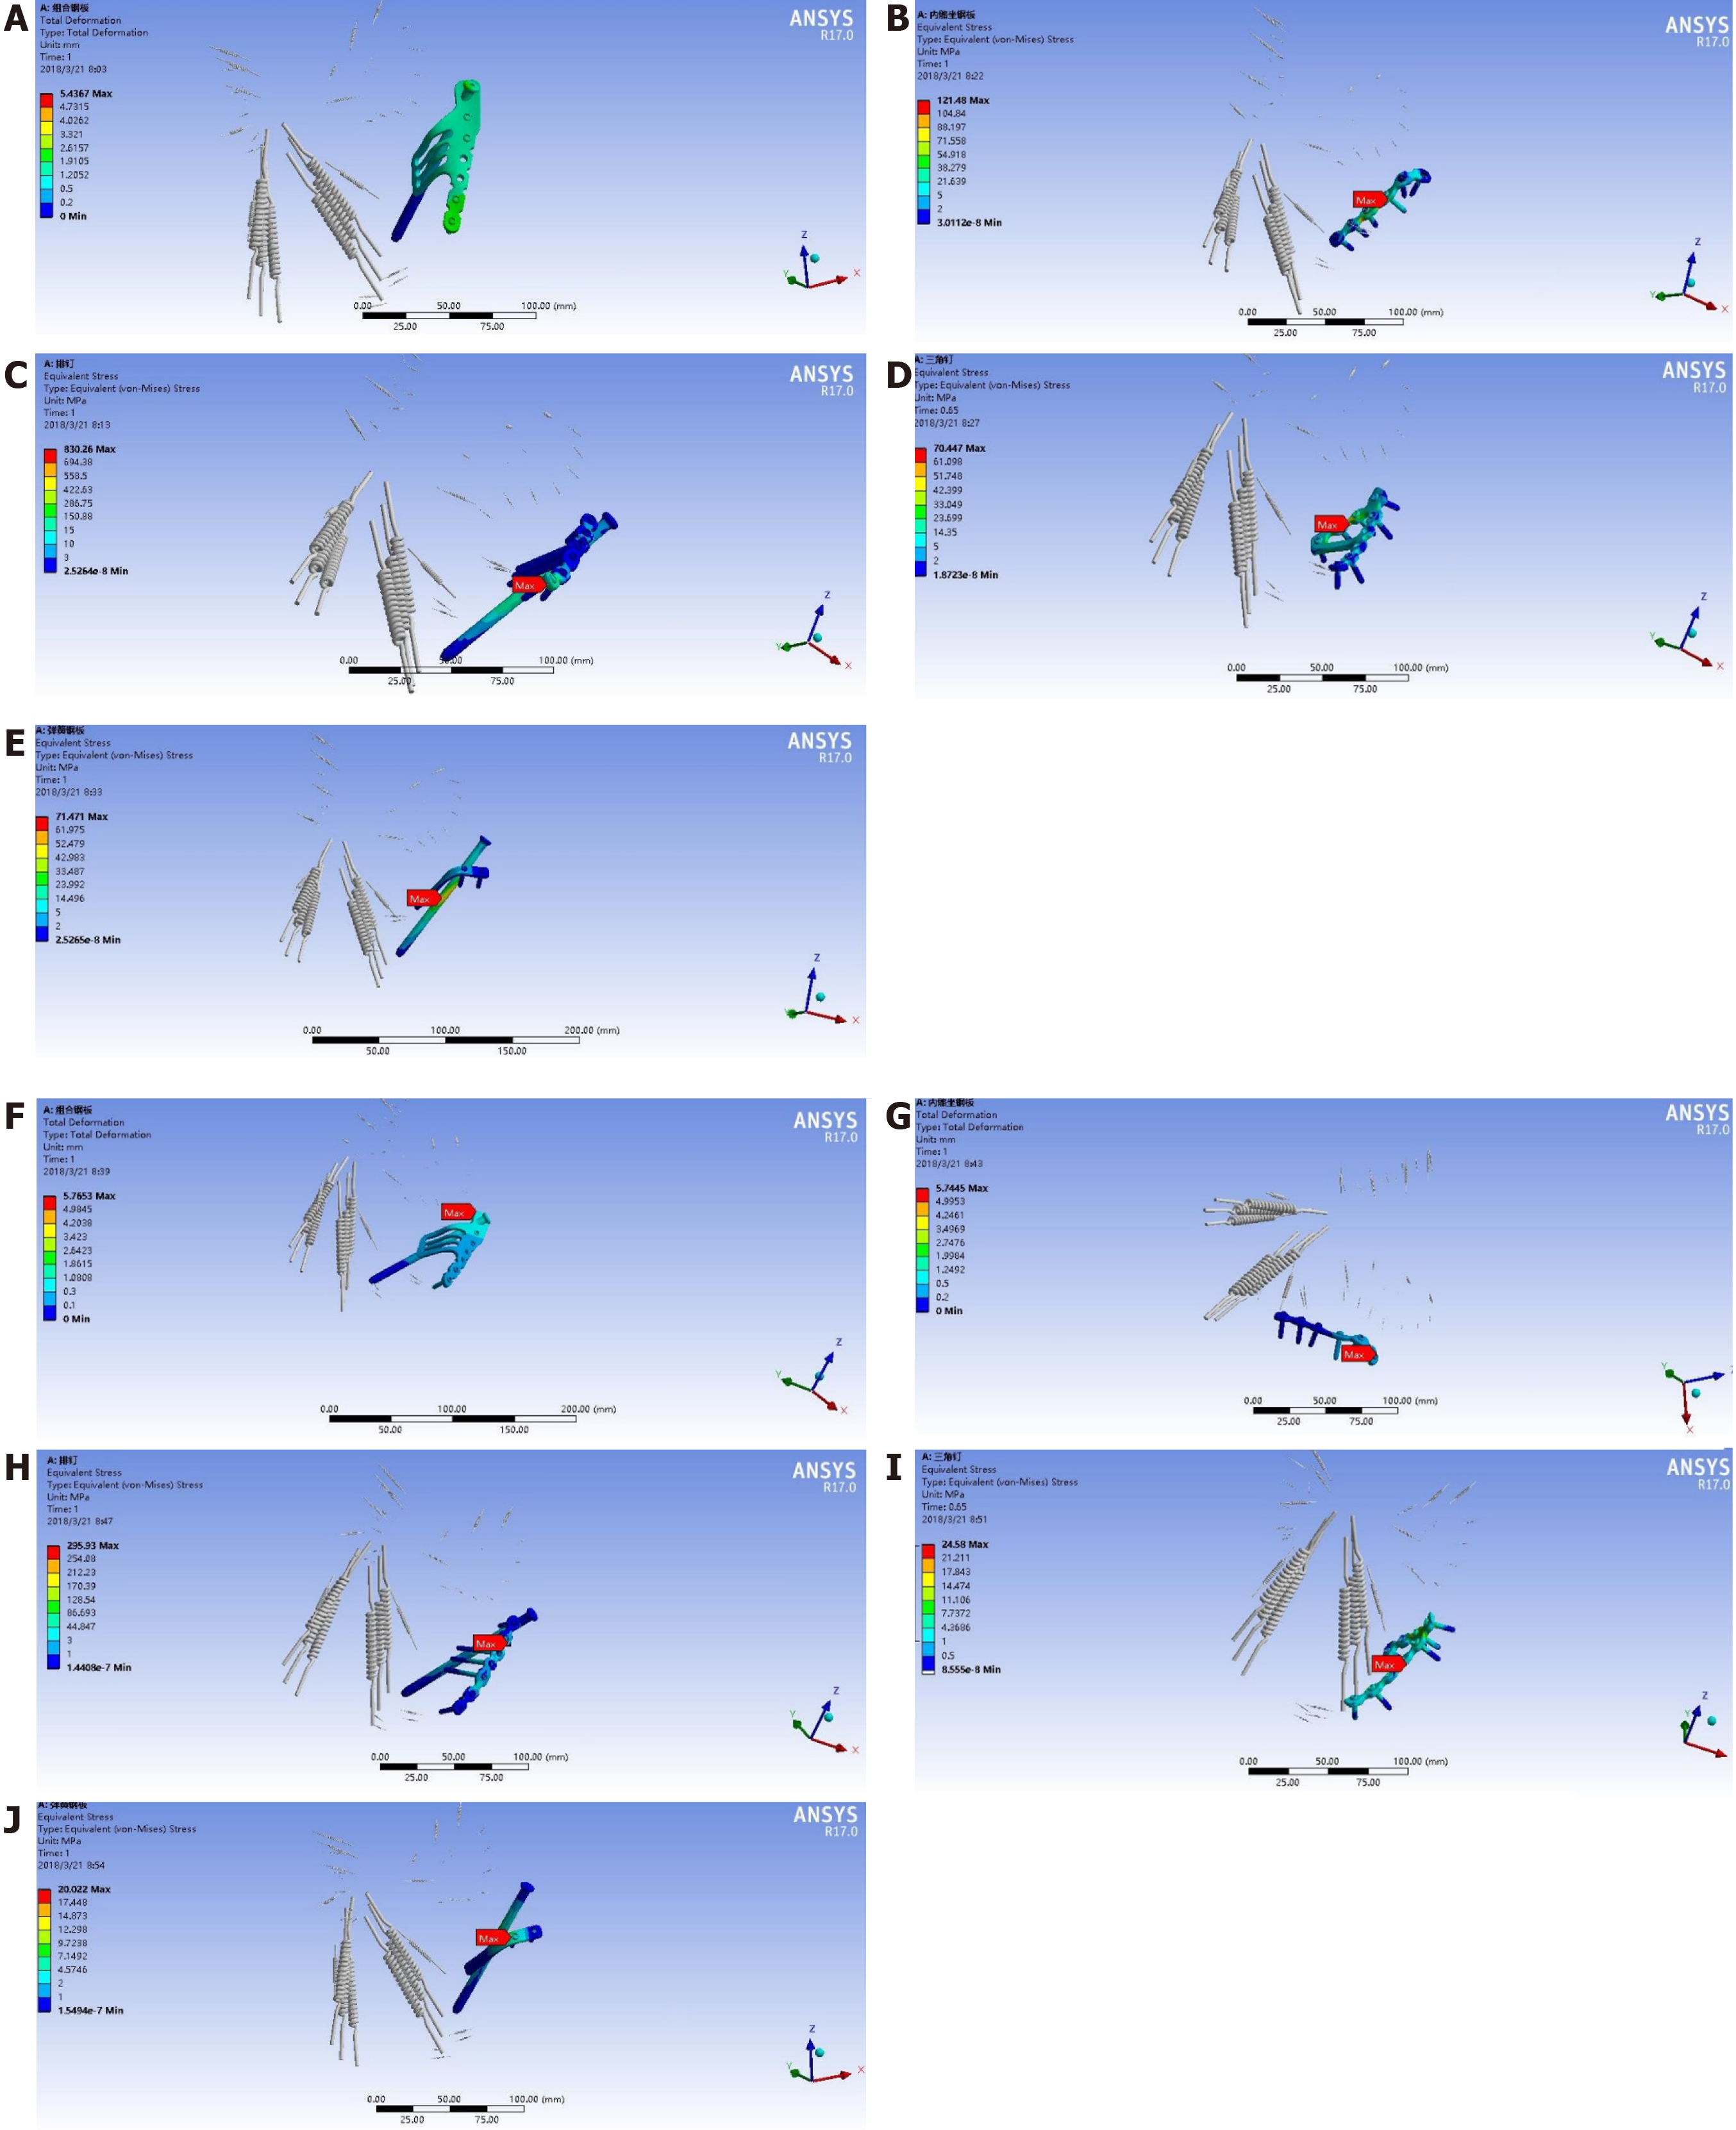
Figure 5 Stress distribution of different internal fixation.
The grey parts represent the pelvis, and the materials in blue and green are the internal fixation devices. Dark blue indicates the smallest stress and displacement, while light blue, green, yellow, orange, and red indicate gradually higher stress. A-E: Sitting position; F-J: Standing position.
- Citation: Xie XJ, Cao SL, Tong K, Zhong ZY, Wang G. Three-dimensional finite element analysis with different internal fixation methods through the anterior approach. World J Clin Cases 2021; 9(8): 1814-1826
- URL: https://www.wjgnet.com/2307-8960/full/v9/i8/1814.htm
- DOI: https://dx.doi.org/10.12998/wjcc.v9.i8.1814


