Copyright
©The Author(s) 2021.
World J Clin Cases. Feb 16, 2021; 9(5): 1016-1025
Published online Feb 16, 2021. doi: 10.12998/wjcc.v9.i5.1016
Published online Feb 16, 2021. doi: 10.12998/wjcc.v9.i5.1016
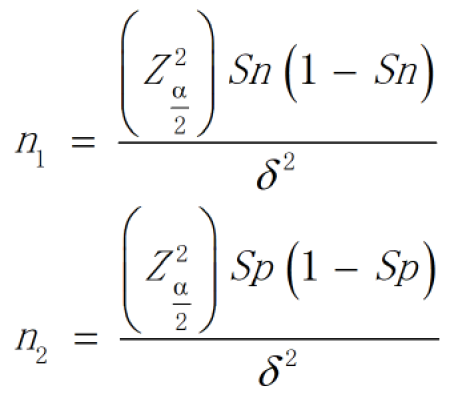
Figure 1 Formula for diagnostic tests.
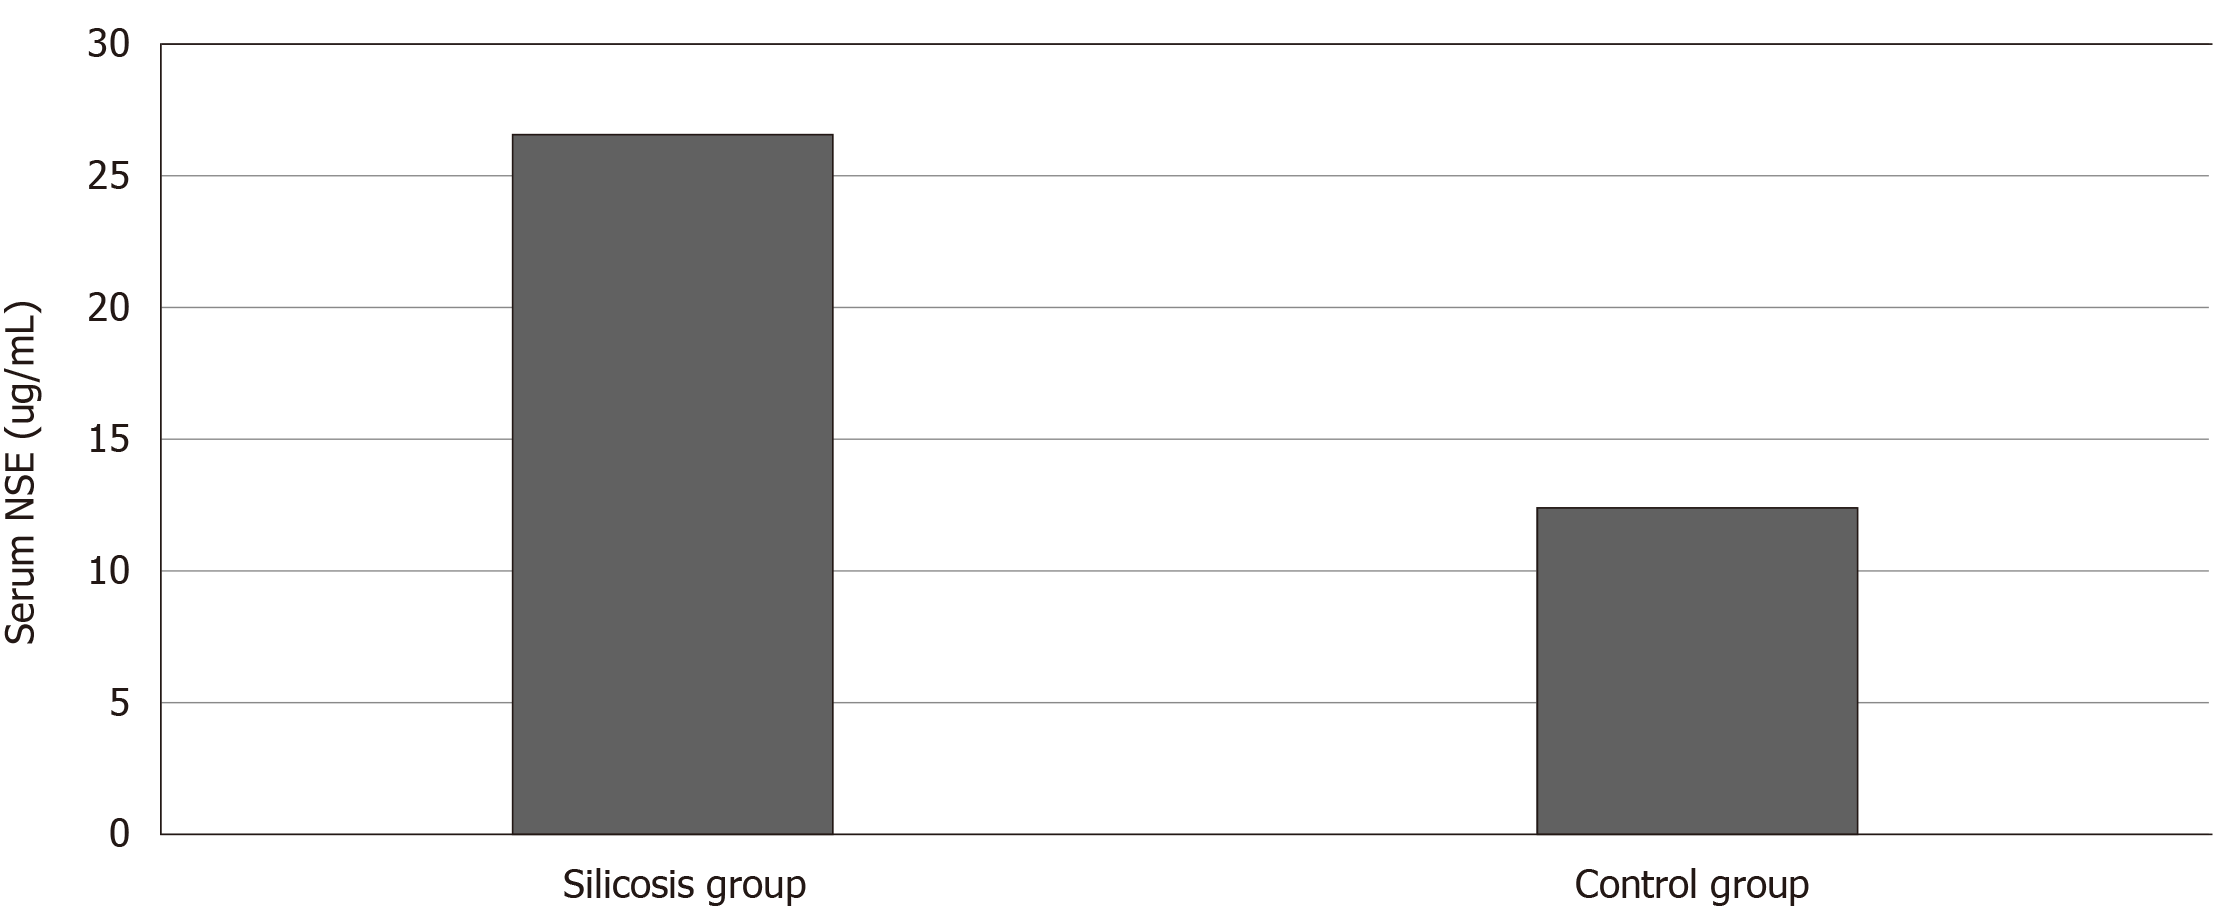
Figure 2 Comparison of serum neuron-specific enolase concentrations between the silicosis group and control group.
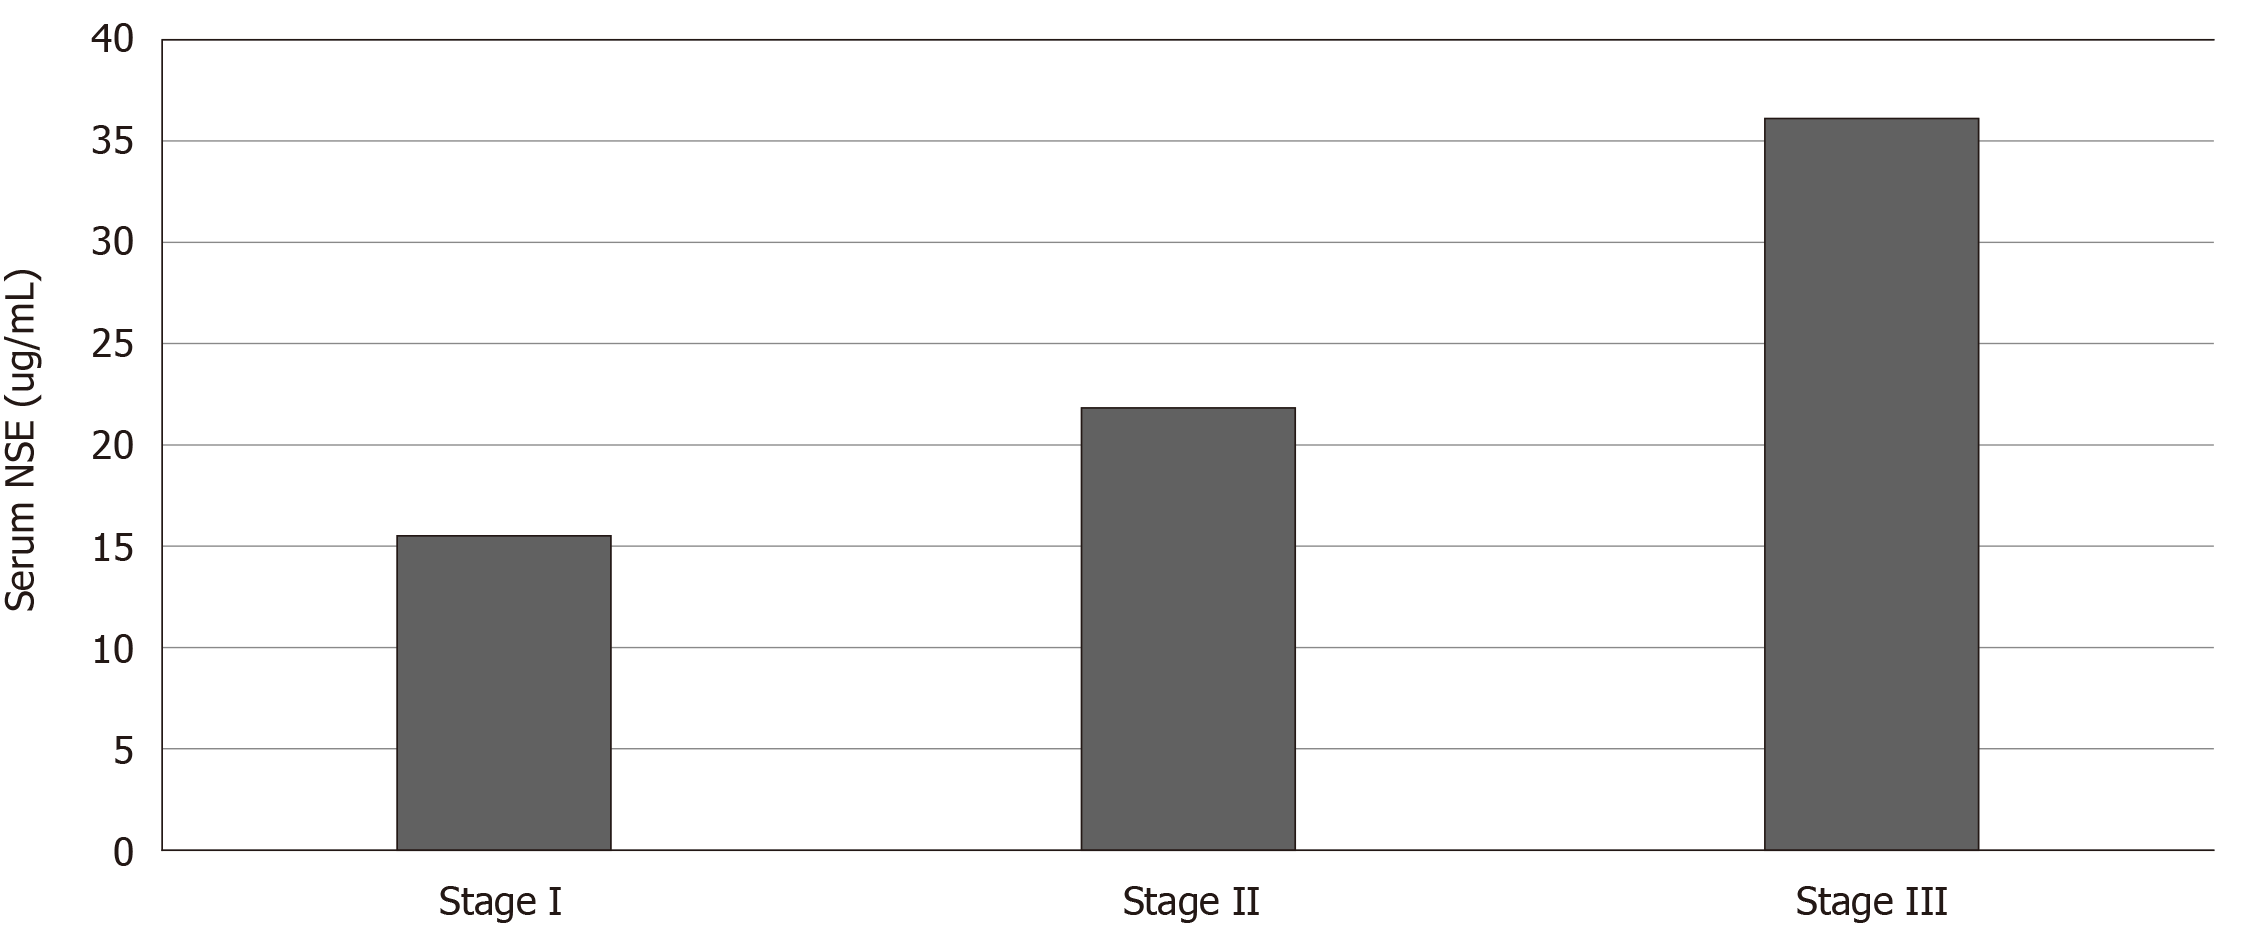
Figure 3 Comparison of serum neuron-specific enolase concentrations among patients with different stages of silicosis.
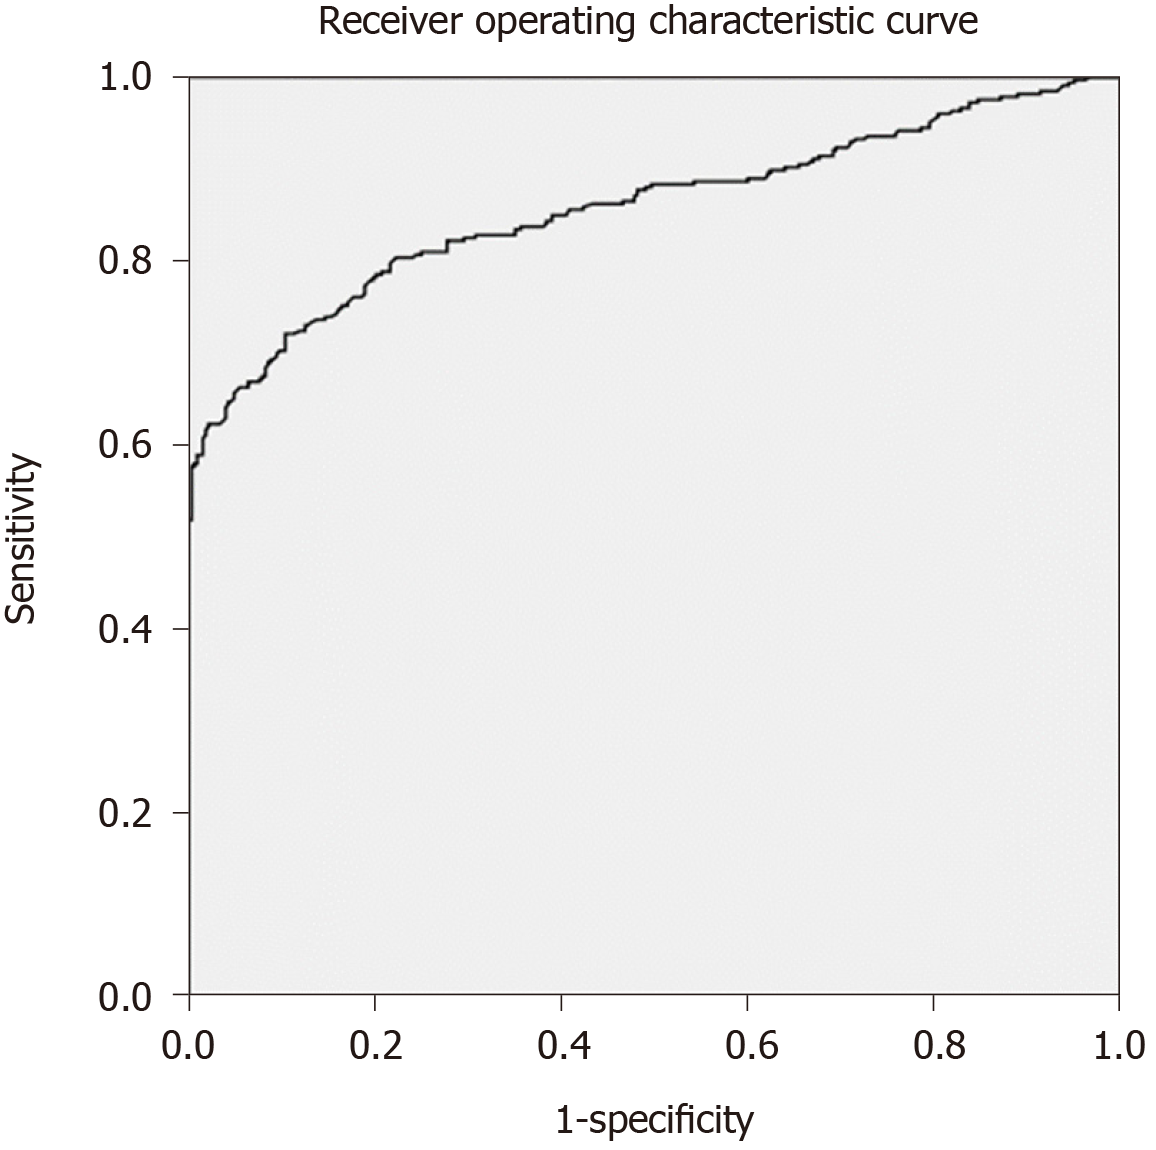
Figure 4 Receiver operating characteristic curve analysis of neuron-specific enolase in patients with silicosis.
- Citation: Huang HB, Huang JL, Xu XT, Huang KB, Lin YJ, Lin JB, Zhuang XB. Serum neuron-specific enolase: A promising biomarker of silicosis. World J Clin Cases 2021; 9(5): 1016-1025
- URL: https://www.wjgnet.com/2307-8960/full/v9/i5/1016.htm
- DOI: https://dx.doi.org/10.12998/wjcc.v9.i5.1016


