Copyright
©The Author(s) 2021.
World J Clin Cases. Dec 16, 2021; 9(35): 10979-10993
Published online Dec 16, 2021. doi: 10.12998/wjcc.v9.i35.10979
Published online Dec 16, 2021. doi: 10.12998/wjcc.v9.i35.10979
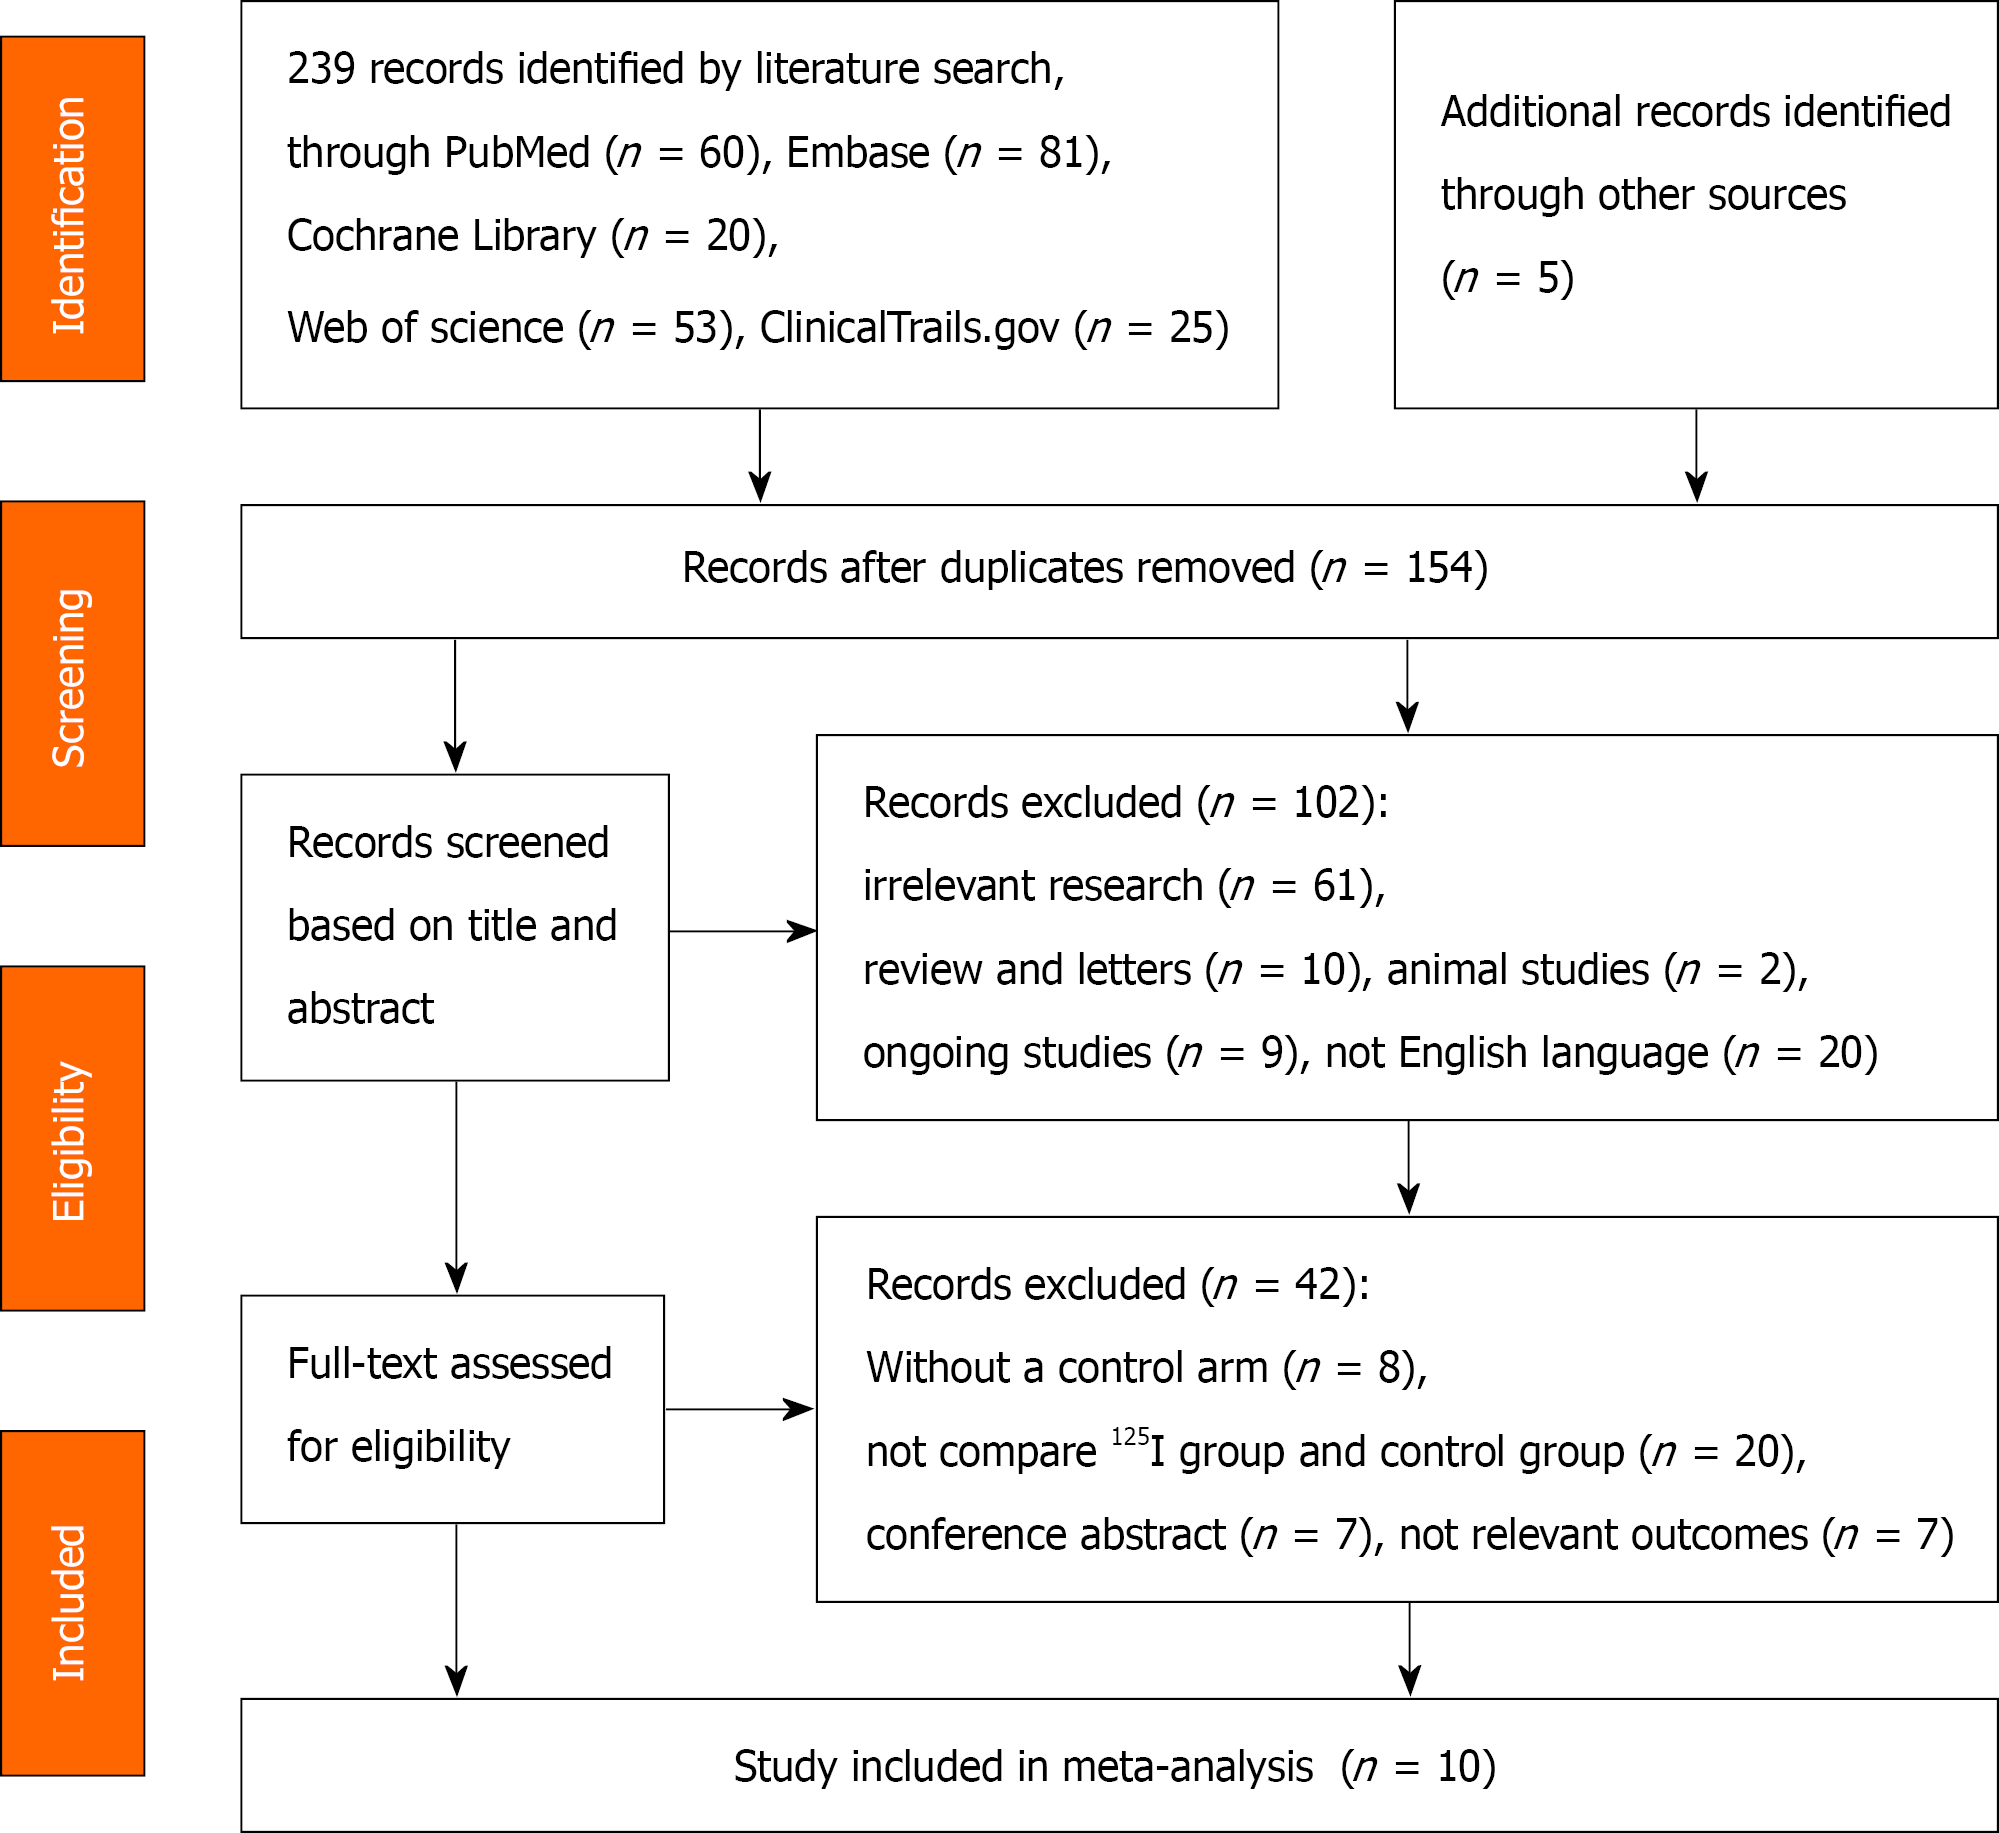
Figure 1 Flow diagram outlining methods of selecting eligible studies.
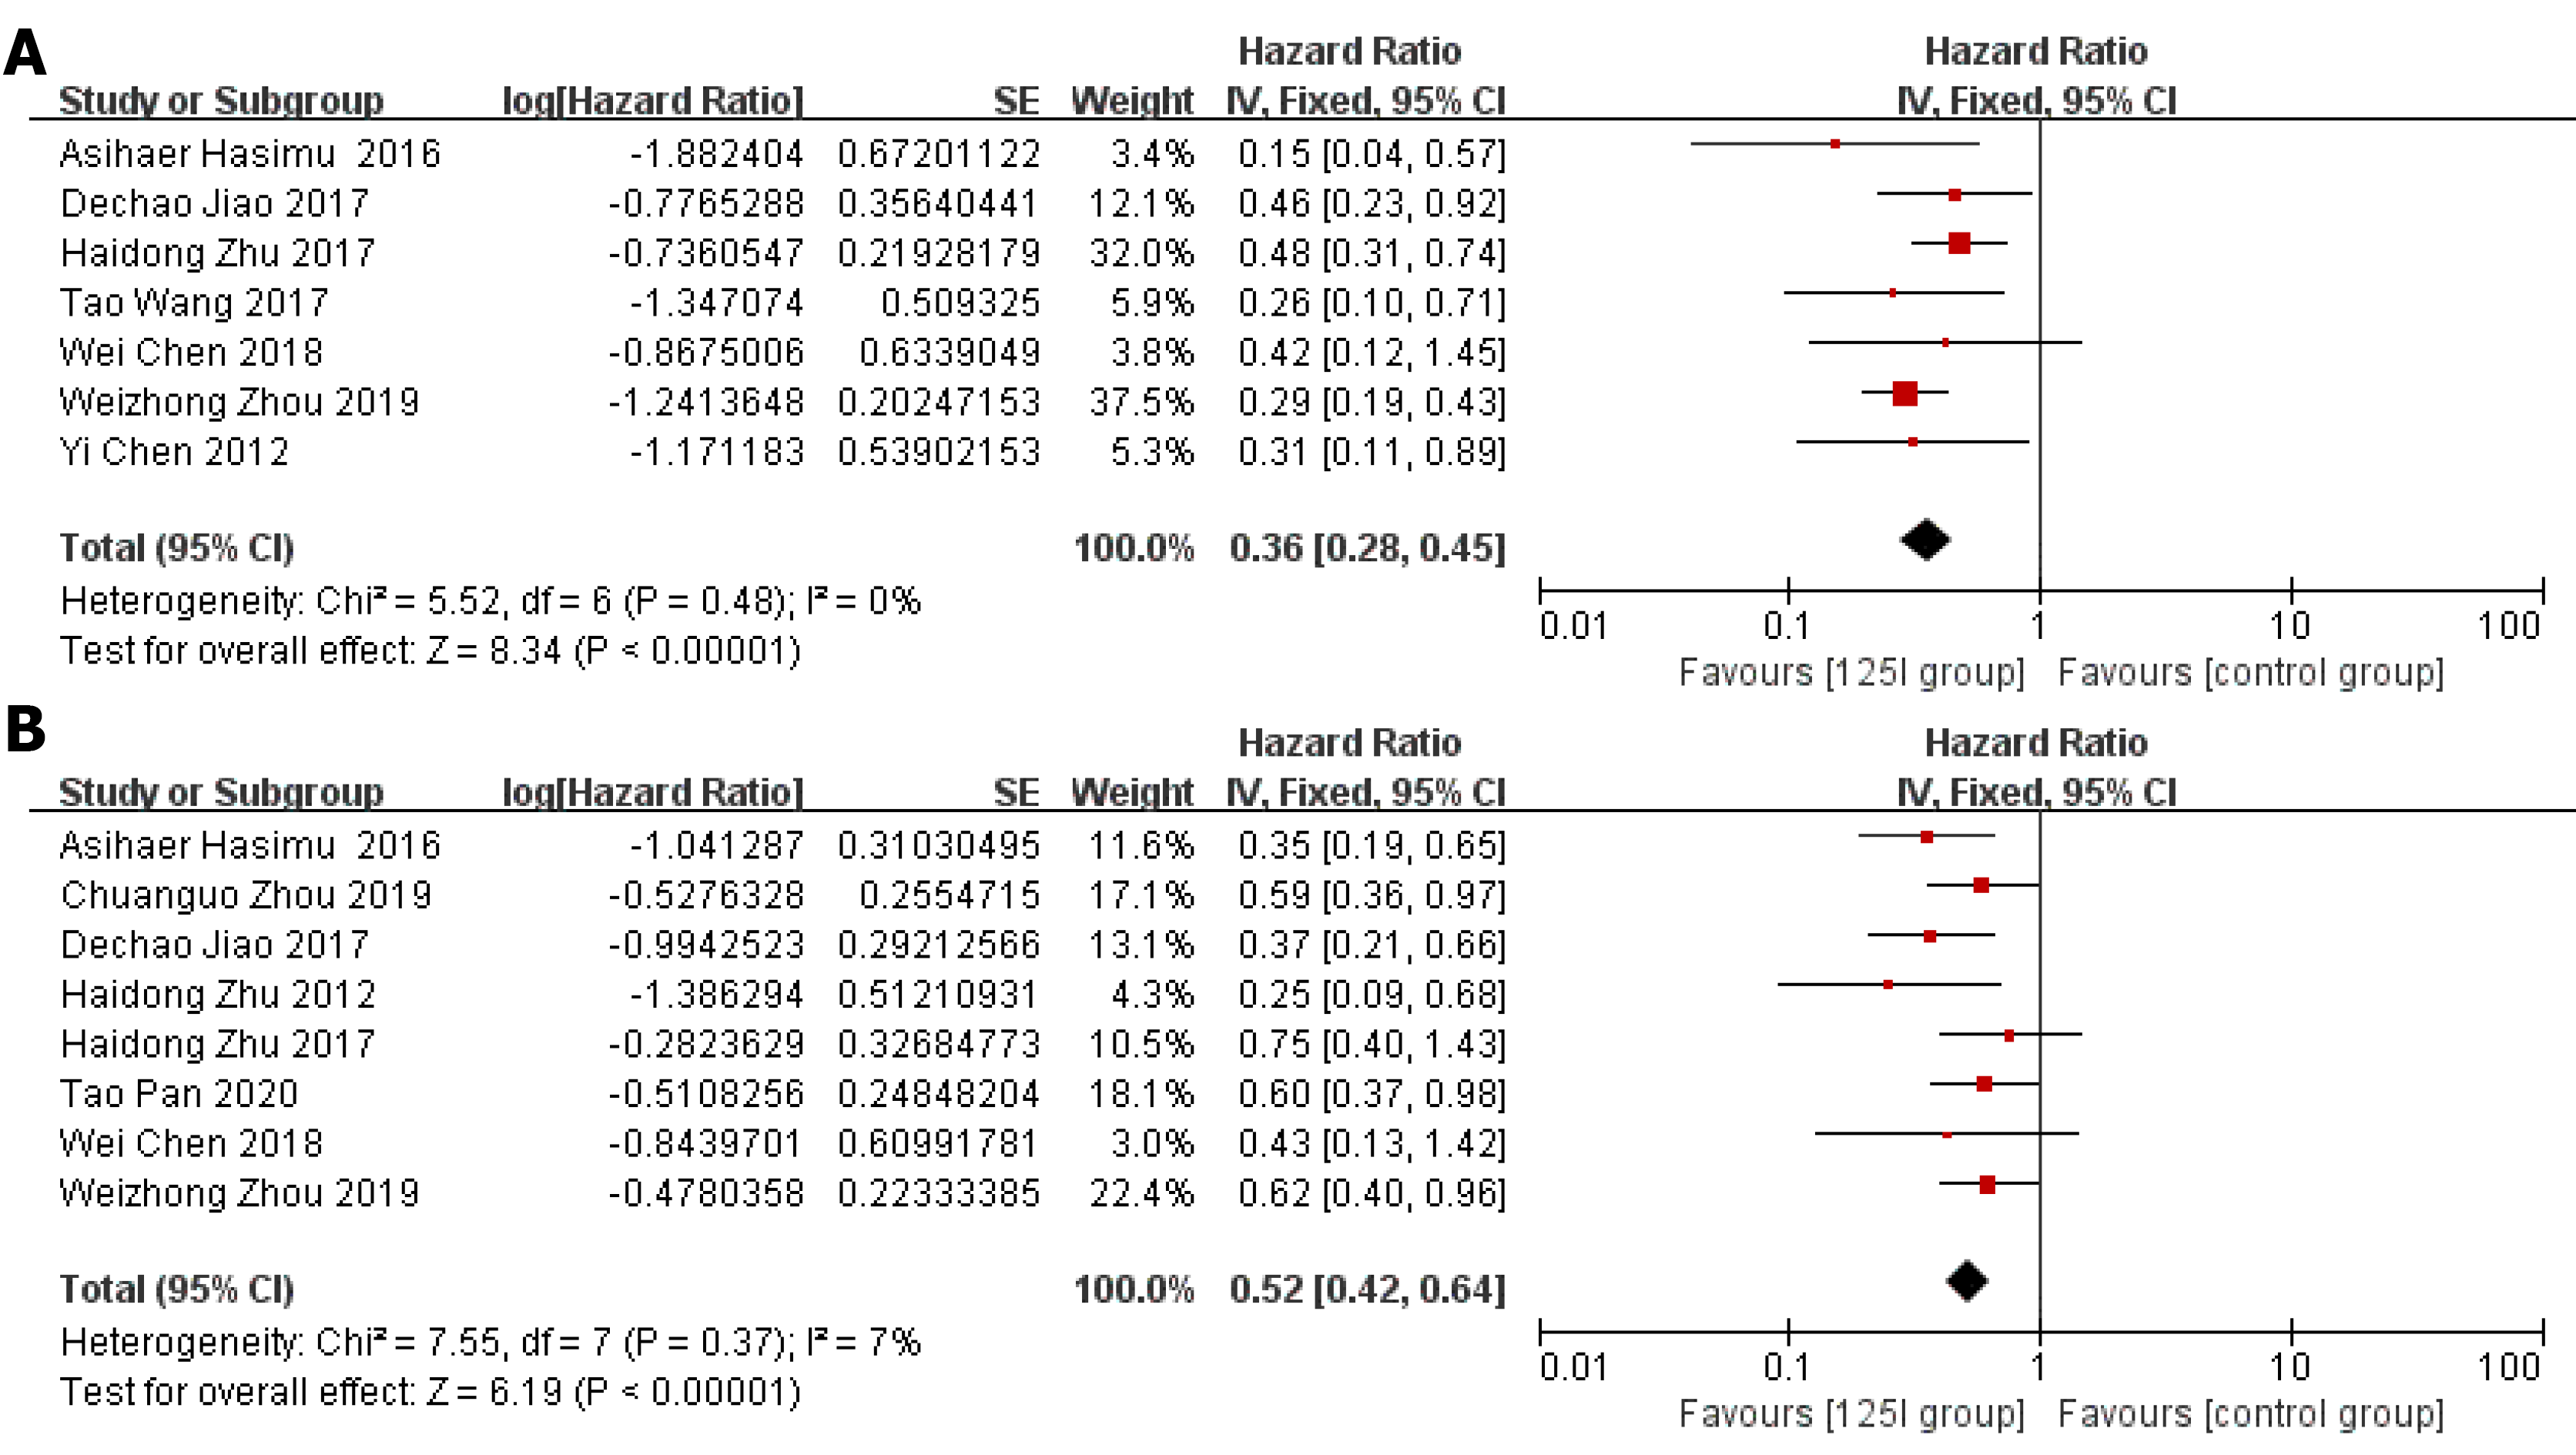
Figure 2 Forest plot (whole studies).
A: Hazard ratios for stent patency; B: Hazard ratios for overall survival.
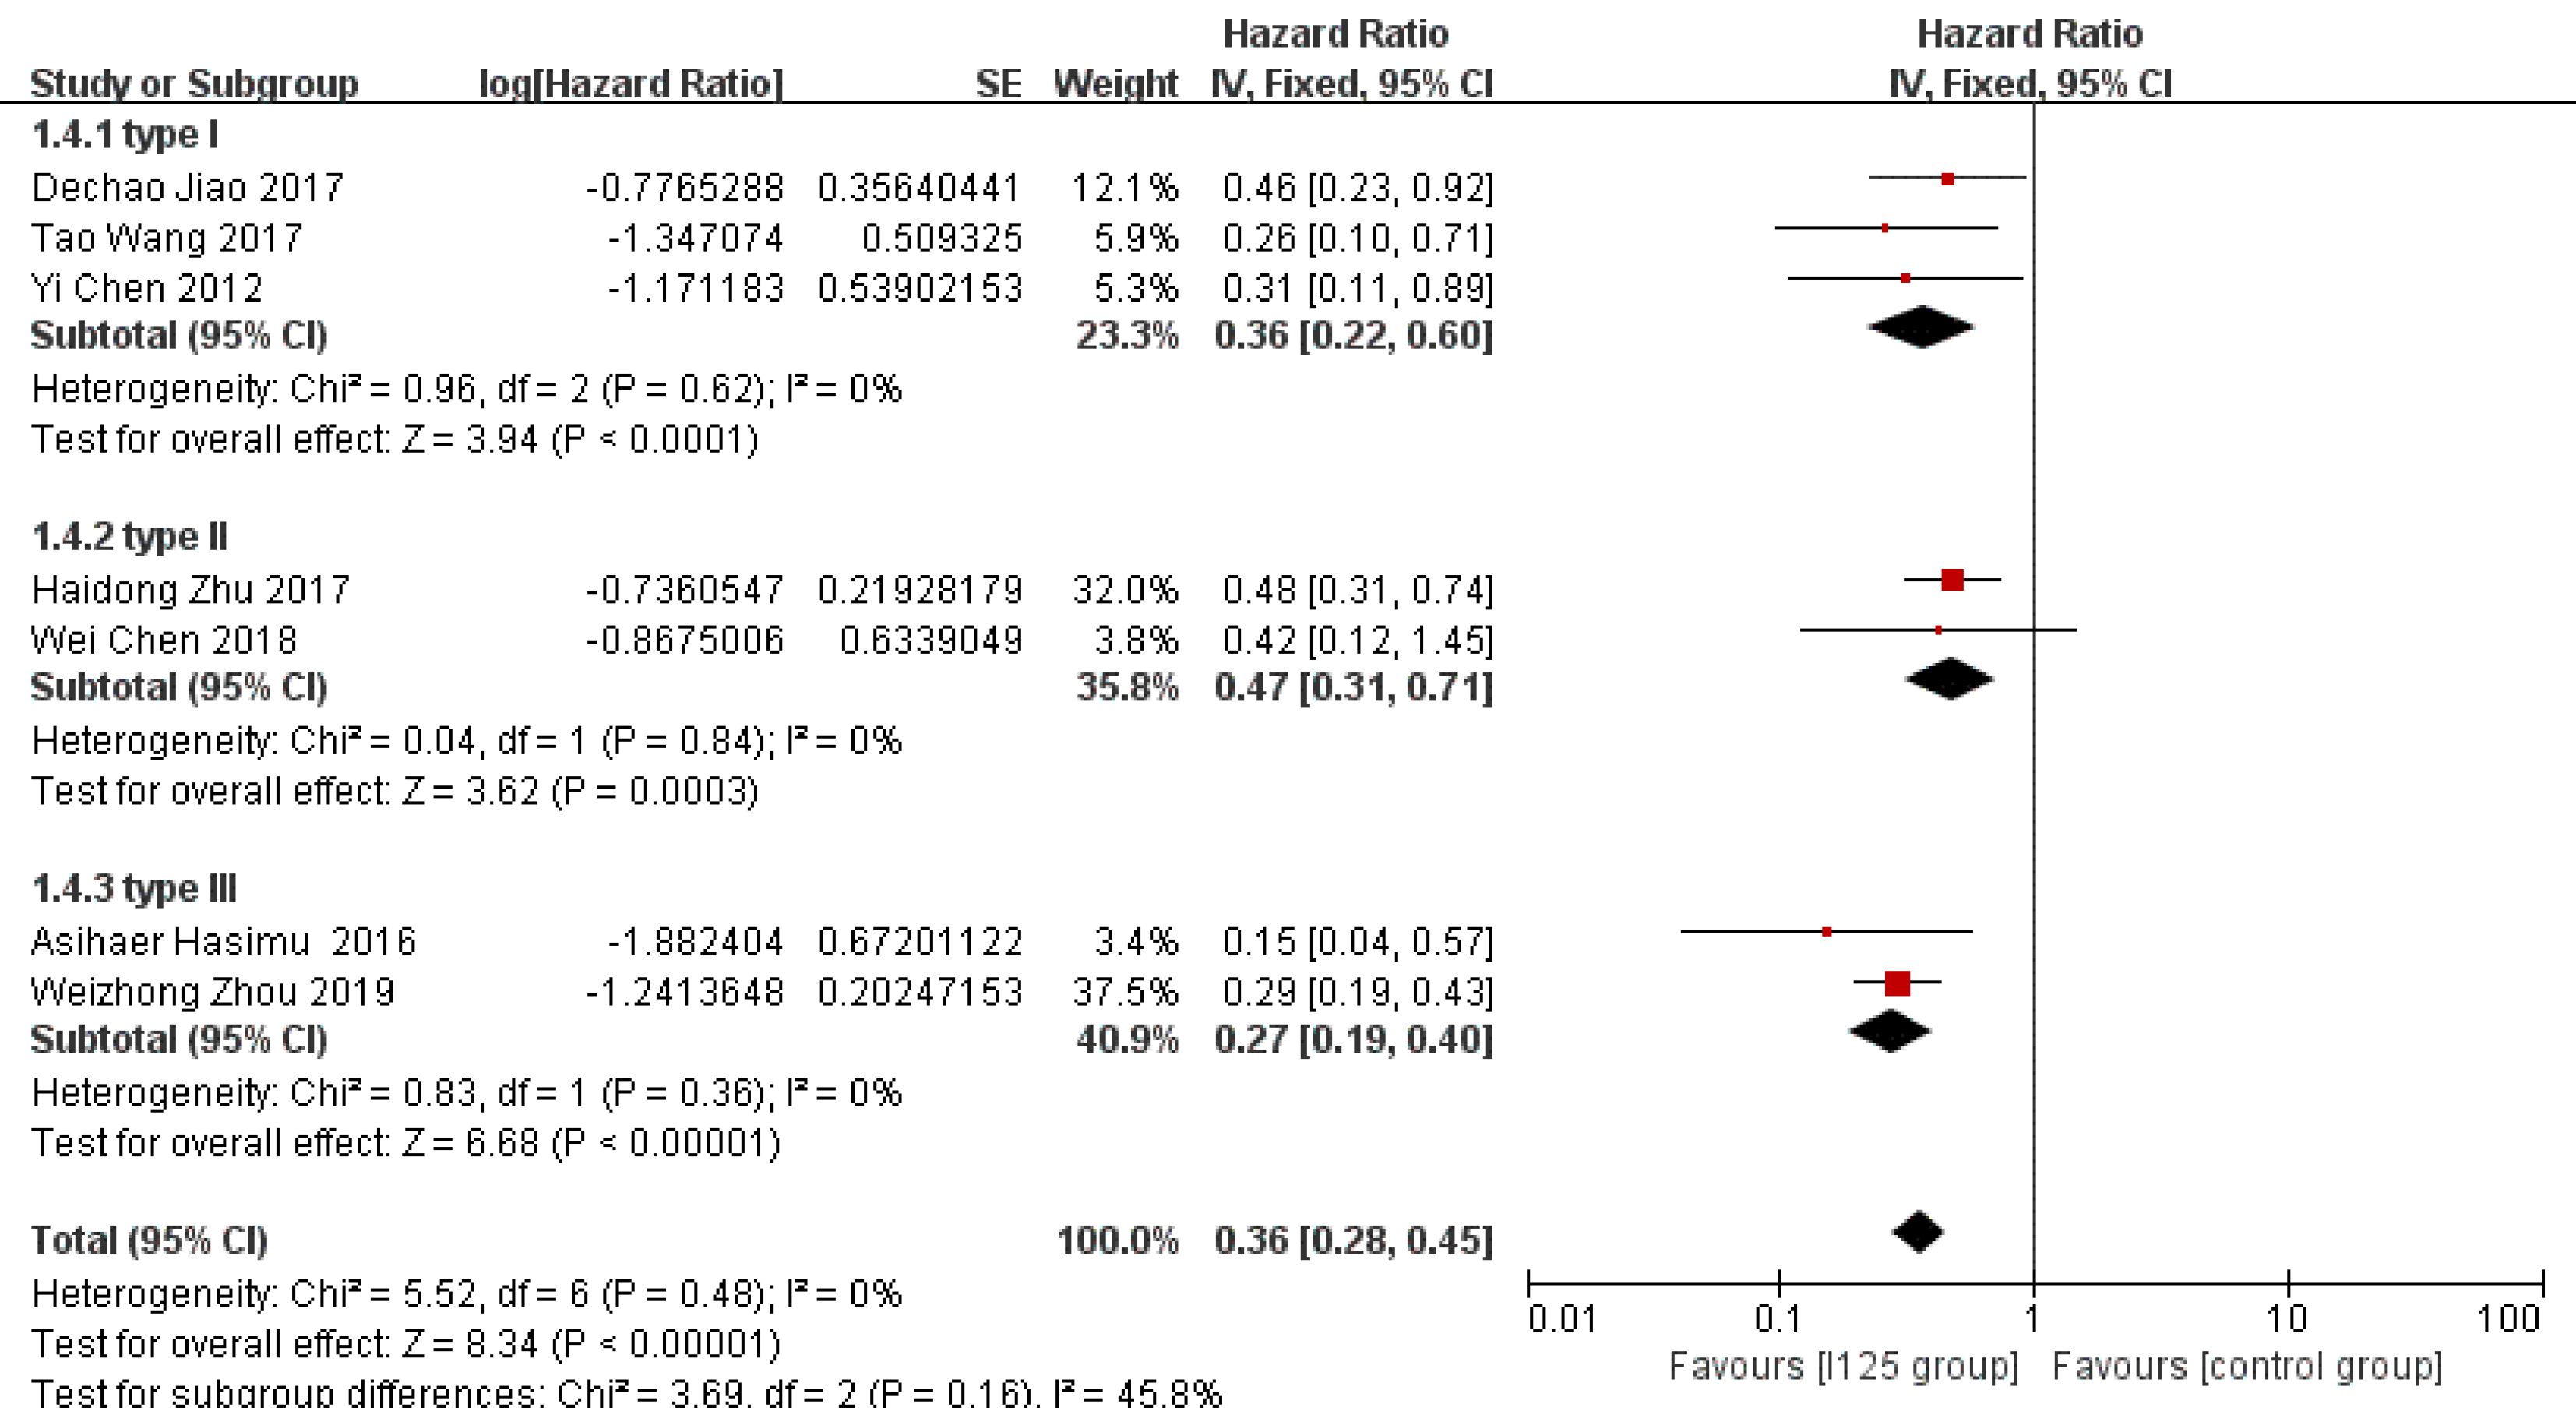
Figure 3 Subgroup analysis of stent patency based on irradiation stent type.
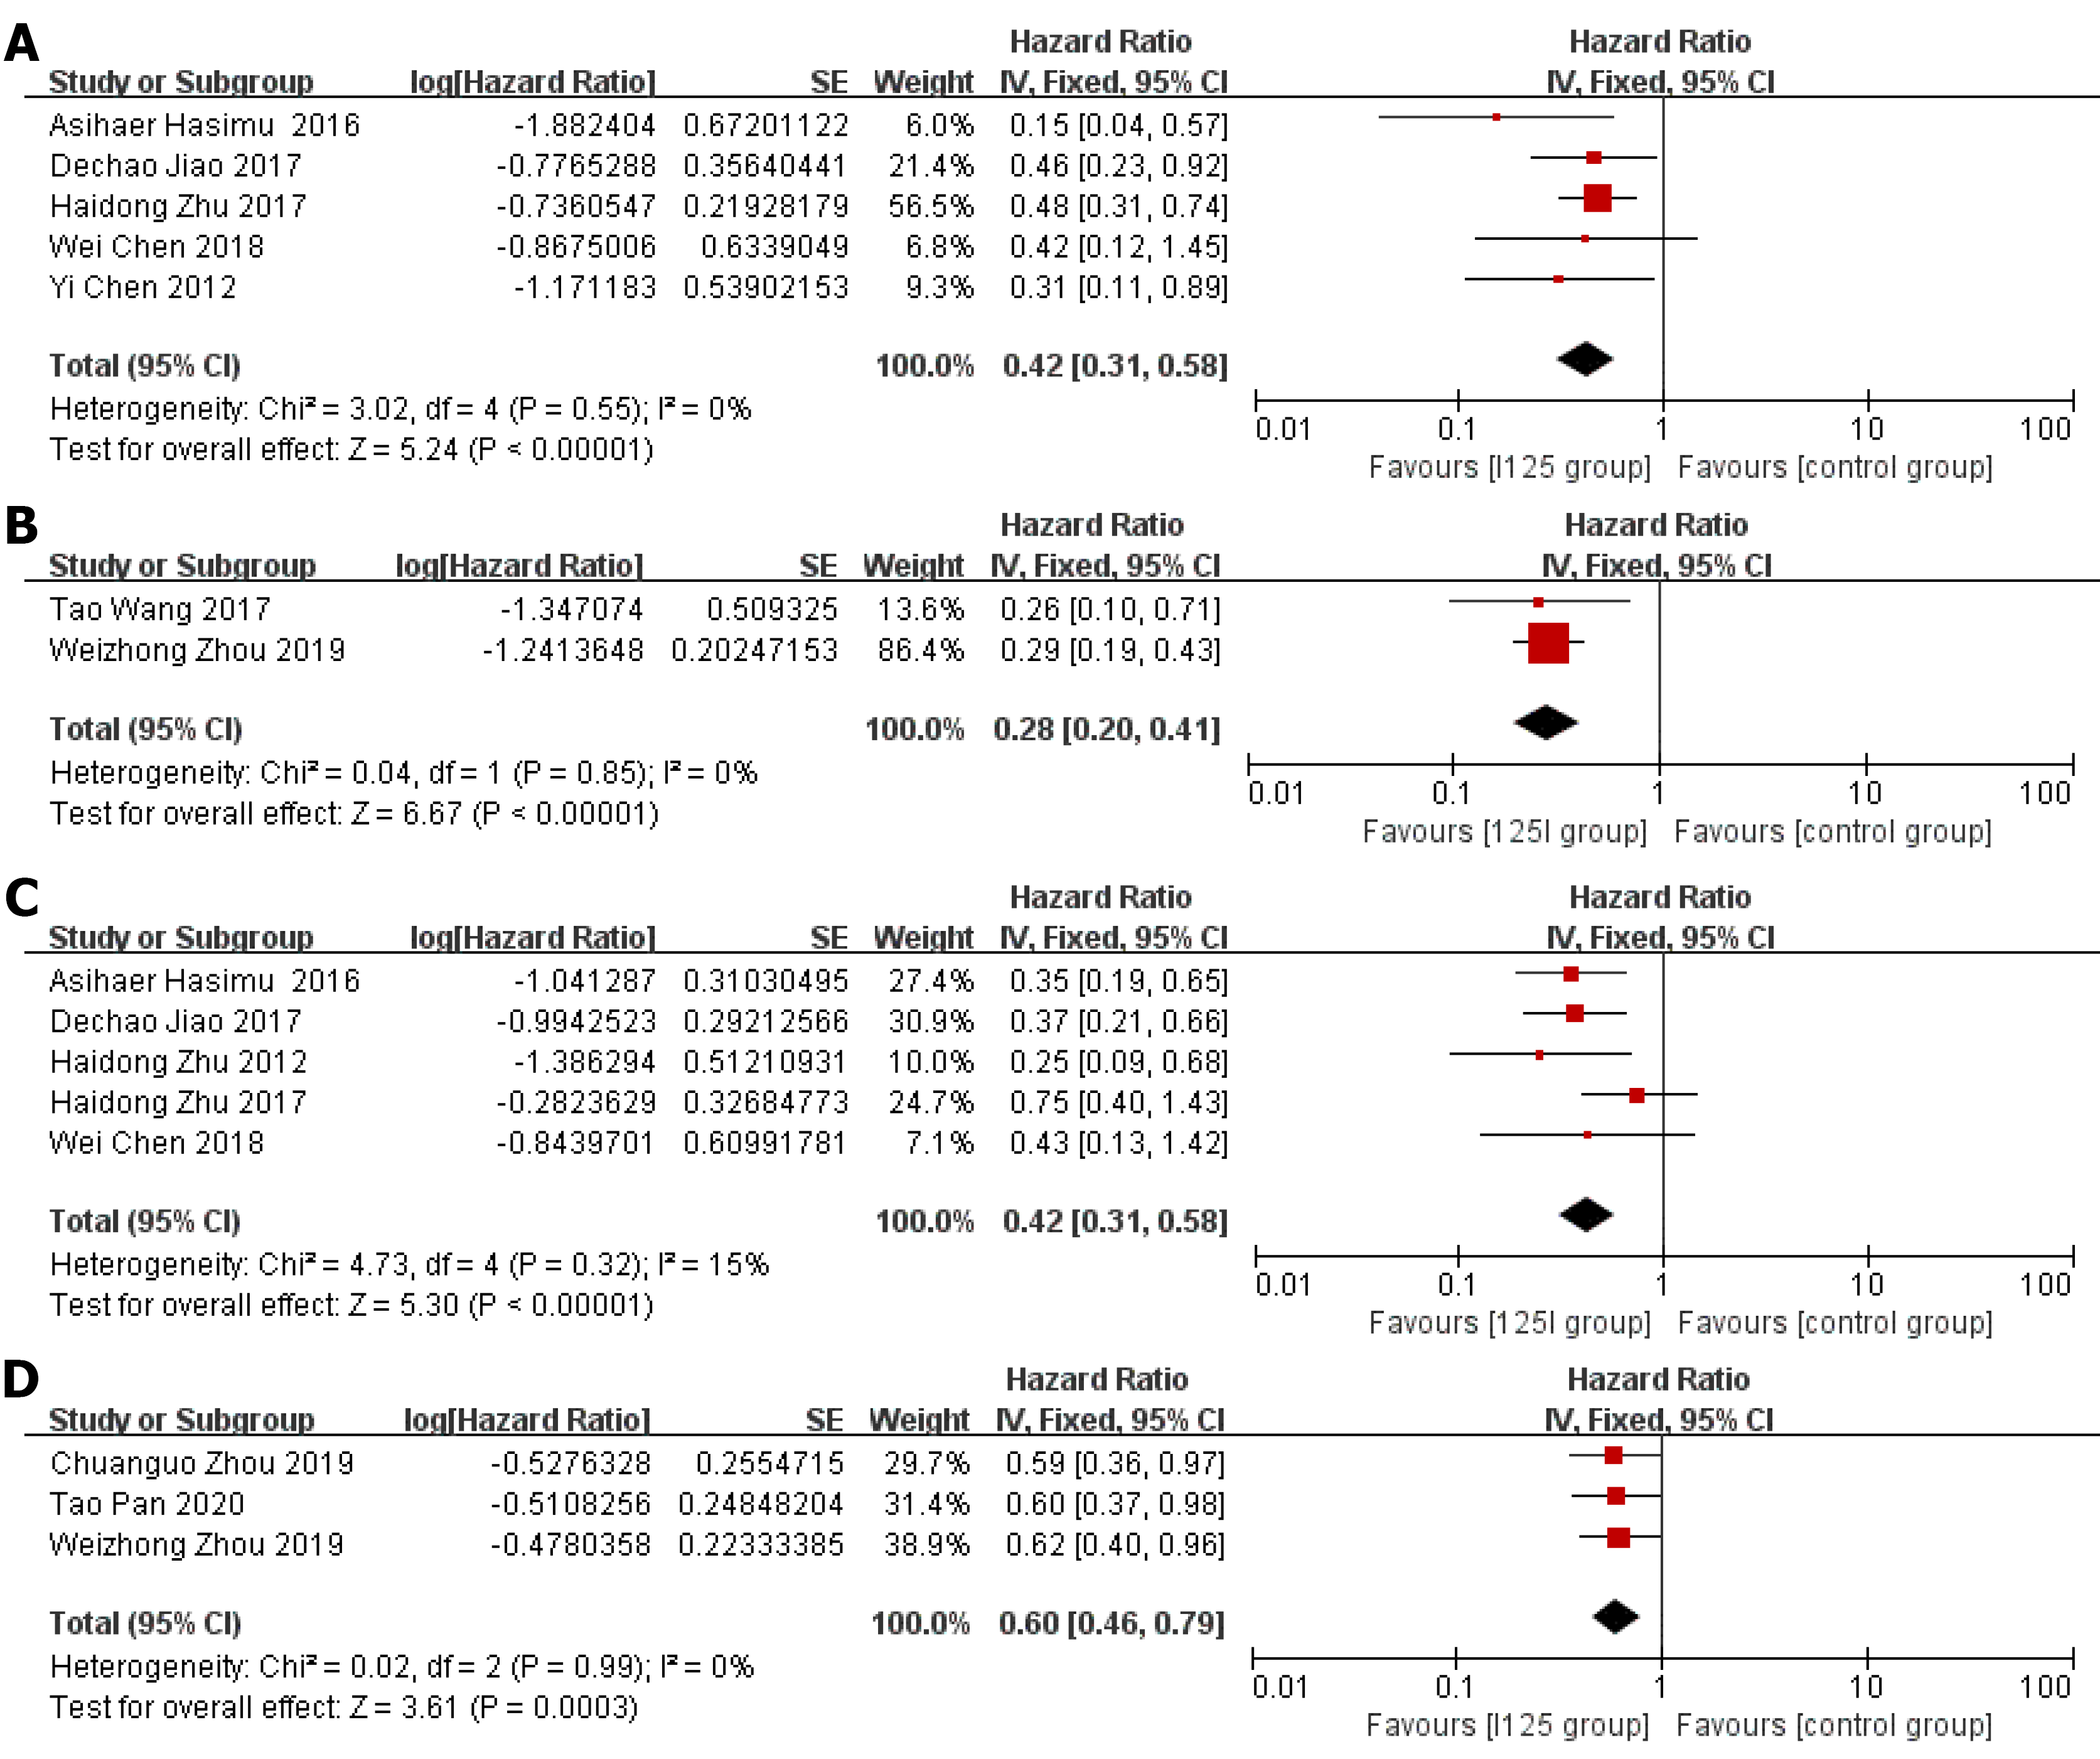
Figure 4 Forest plot (subgroup, divided by randomized controlled trials and retrospective studies).
A: Randomized controlled trial (RCT)-stent patency; B: Retrospective study-stent patency; C: RCT-overall survival; D: Retrospective study-overall survival.
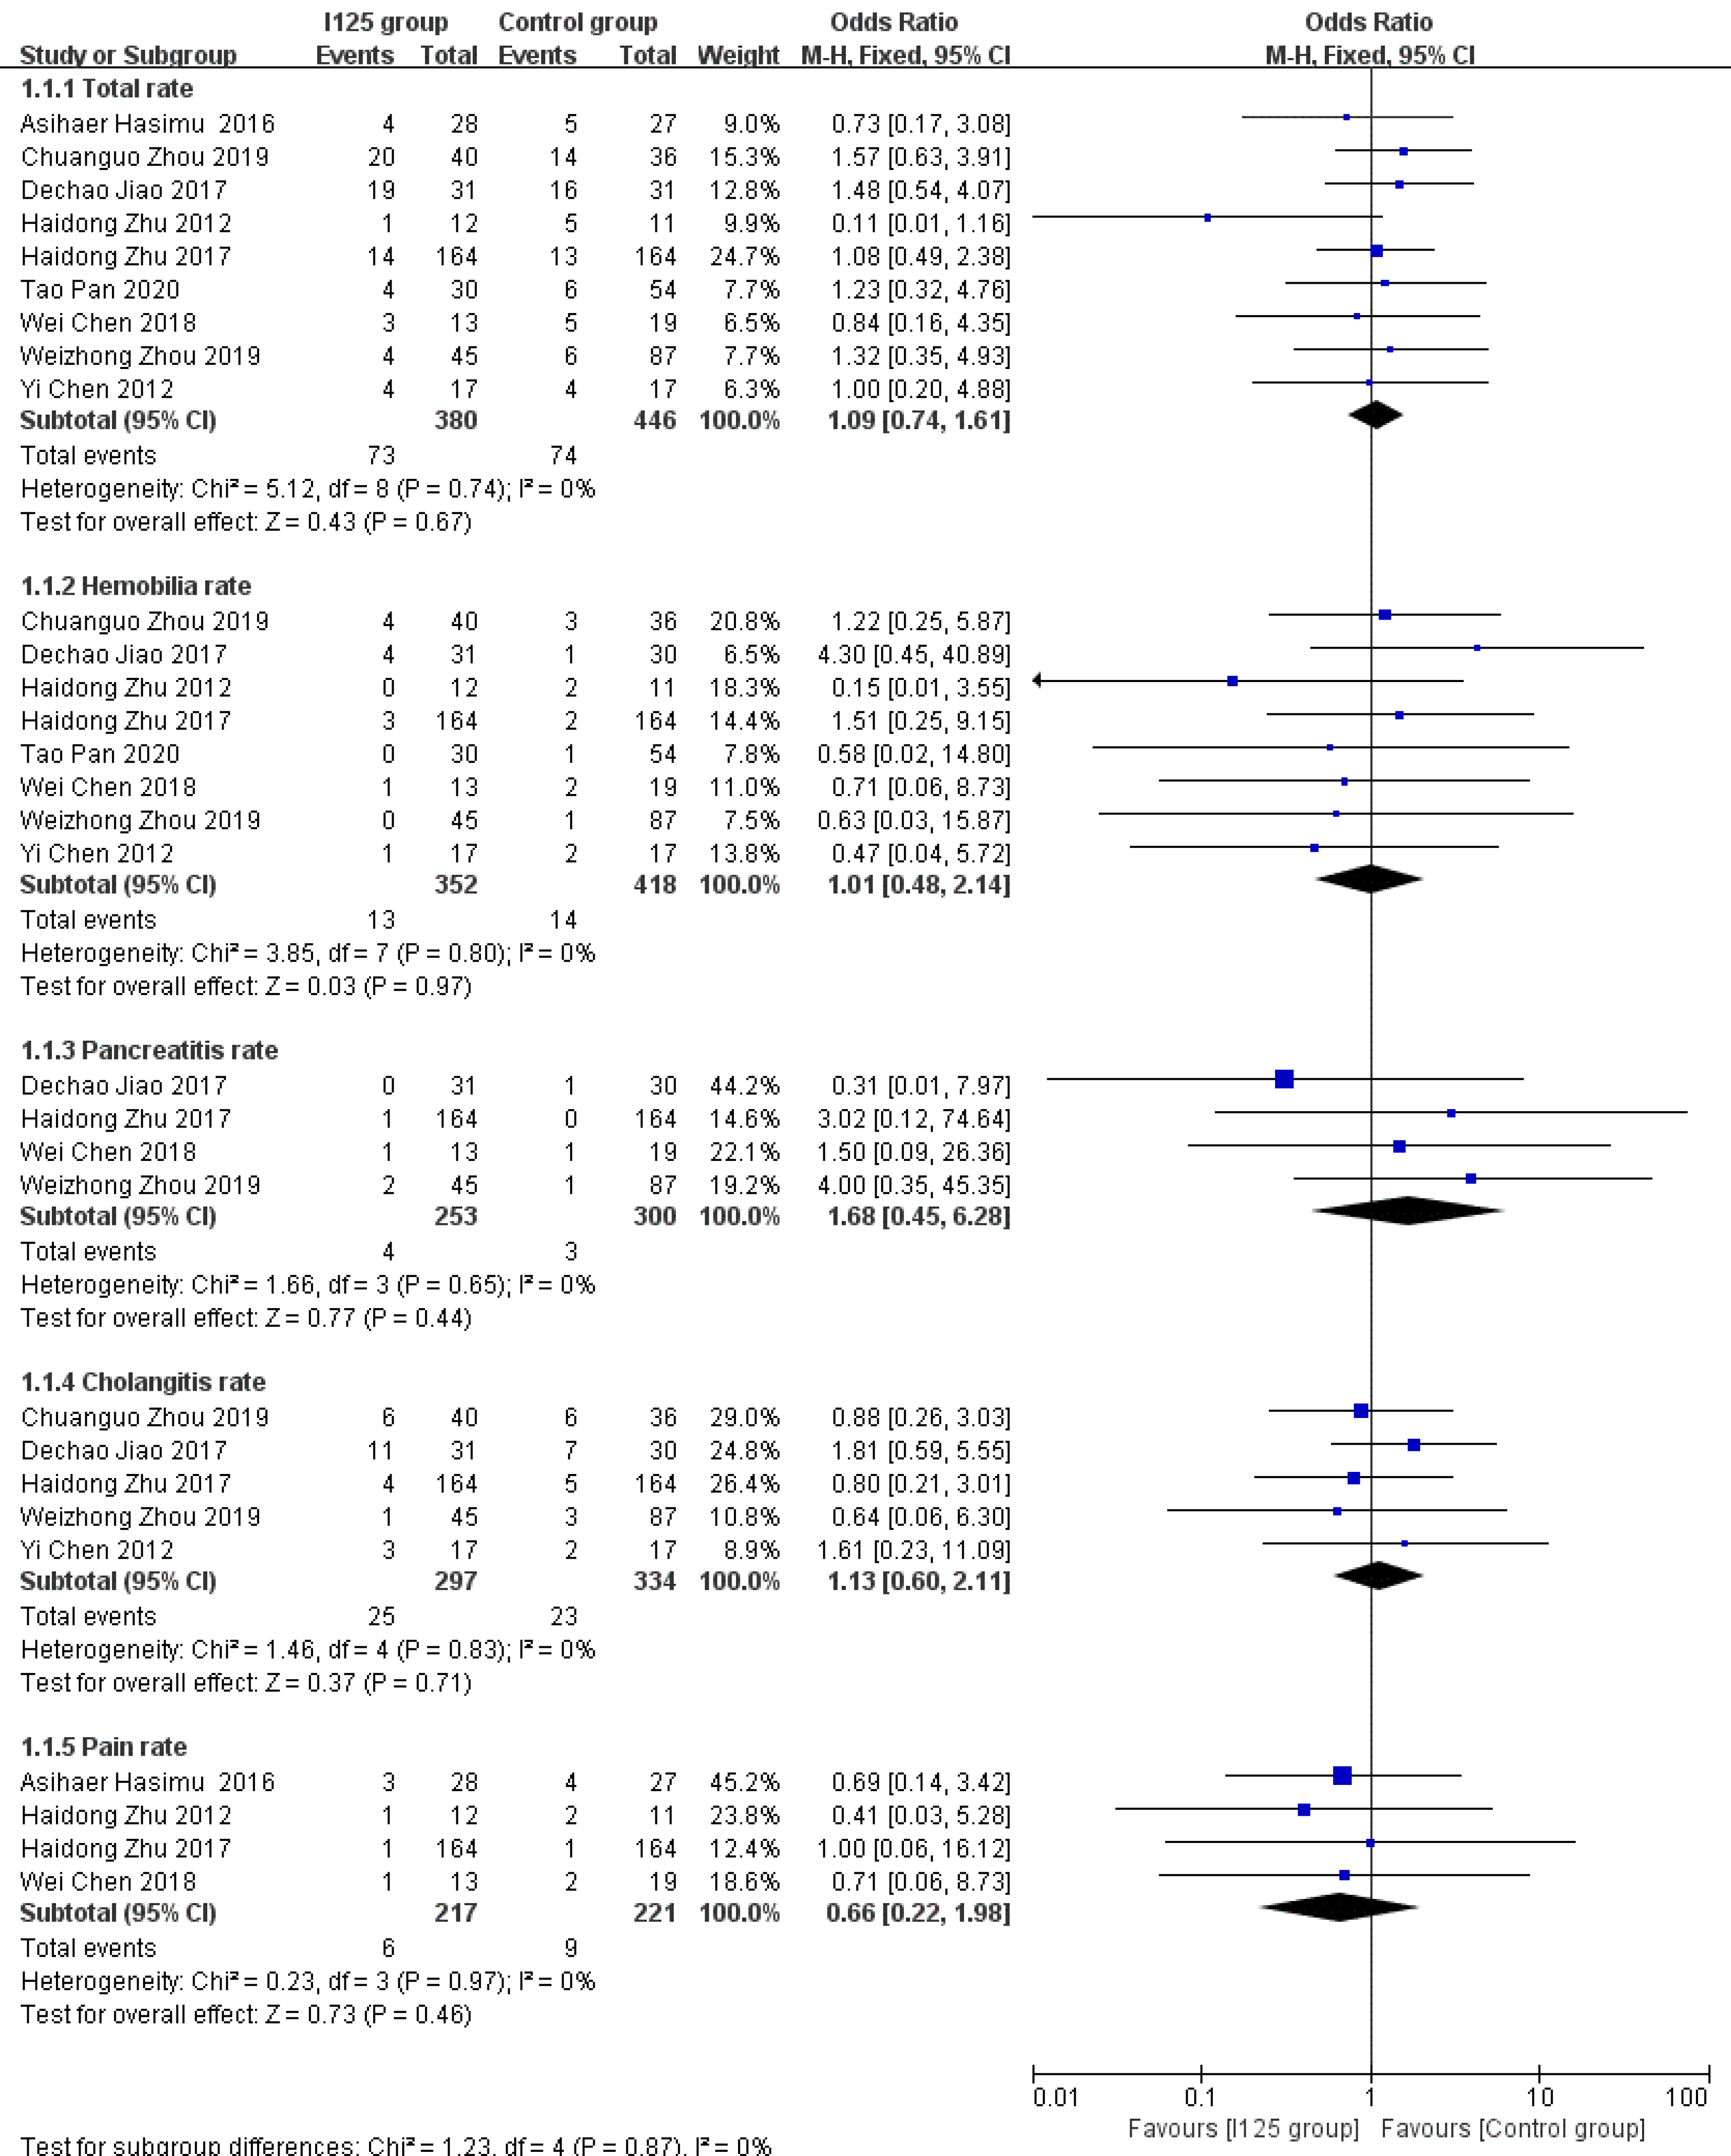
Figure 5 Forest plot comparing rate of complications.
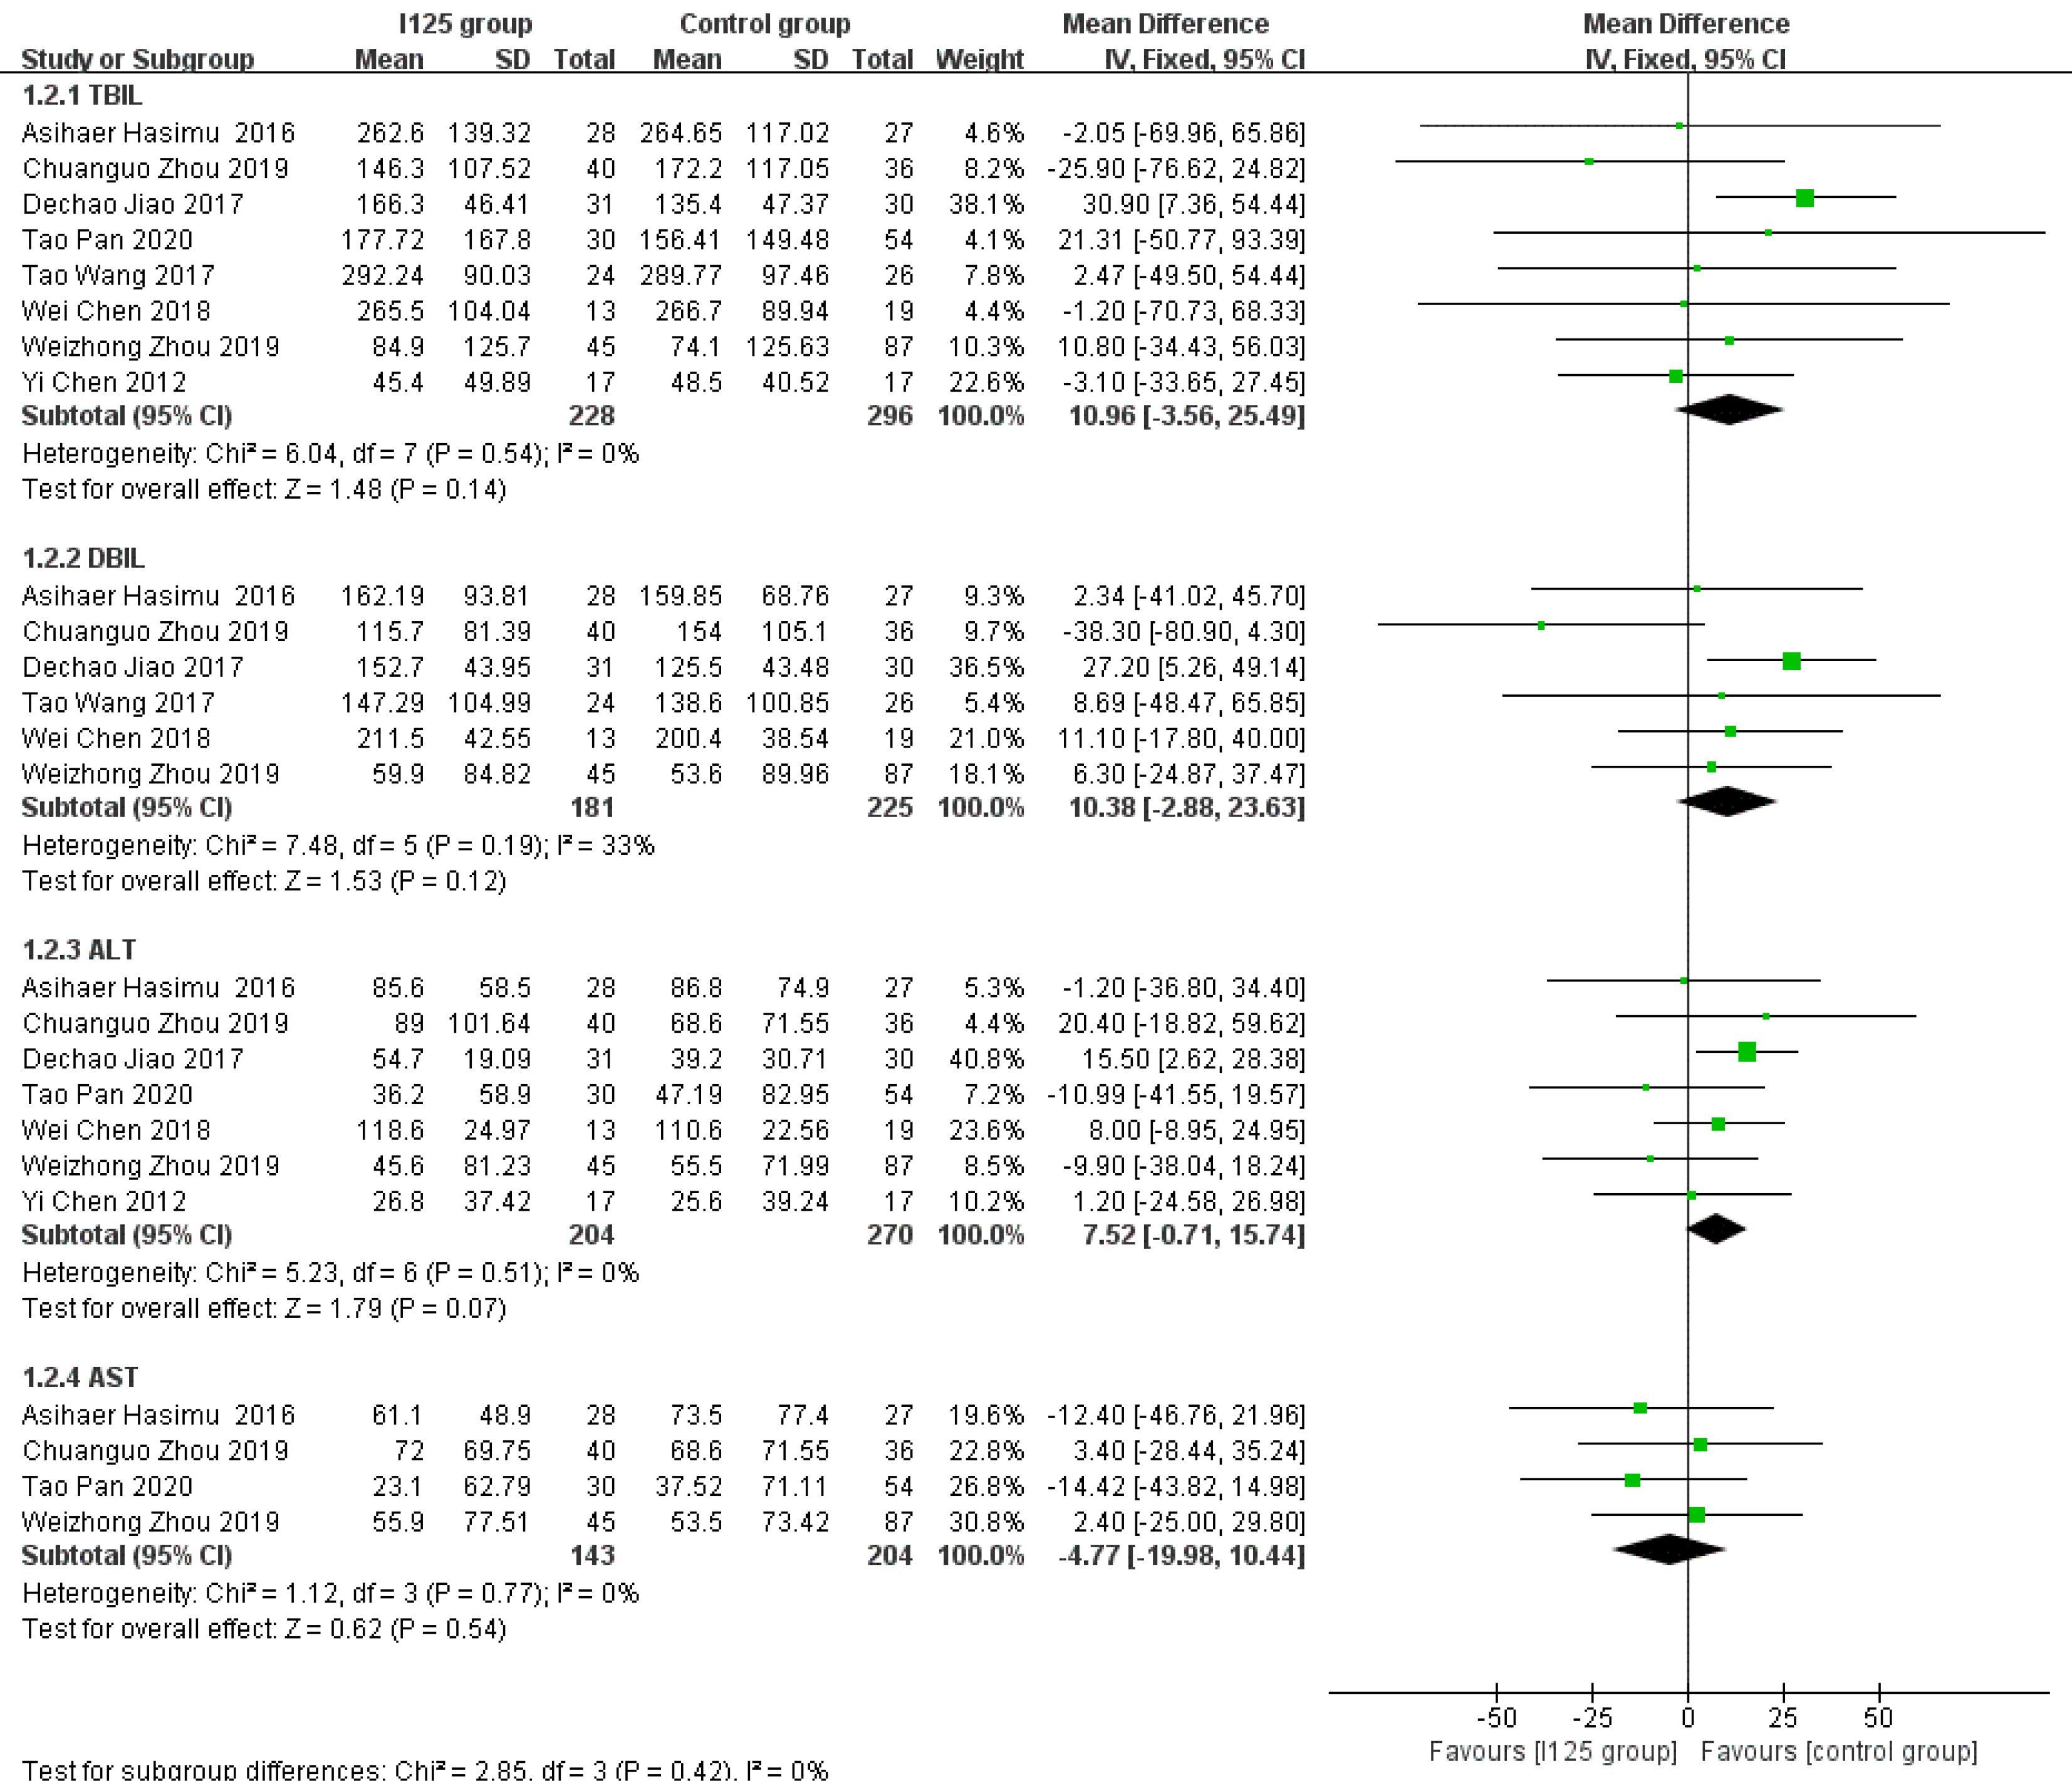
Figure 6 Forest plot comparing mean difference in posttreatment reductions in serum indices.
- Citation: Chen WY, Kong CL, Meng MM, Chen WQ, Zheng LY, Mao JT, Fang SJ, Chen L, Shu GF, Yang Y, Weng QY, Chen MJ, Xu M, Ji JS. Percutaneous biliary stent combined with brachytherapy using 125I seeds for treatment of unresectable malignant obstructive jaundice: A meta-analysis. World J Clin Cases 2021; 9(35): 10979-10993
- URL: https://www.wjgnet.com/2307-8960/full/v9/i35/10979.htm
- DOI: https://dx.doi.org/10.12998/wjcc.v9.i35.10979


