Copyright
©The Author(s) 2021.
World J Clin Cases. Dec 6, 2021; 9(34): 10626-10637
Published online Dec 6, 2021. doi: 10.12998/wjcc.v9.i34.10626
Published online Dec 6, 2021. doi: 10.12998/wjcc.v9.i34.10626
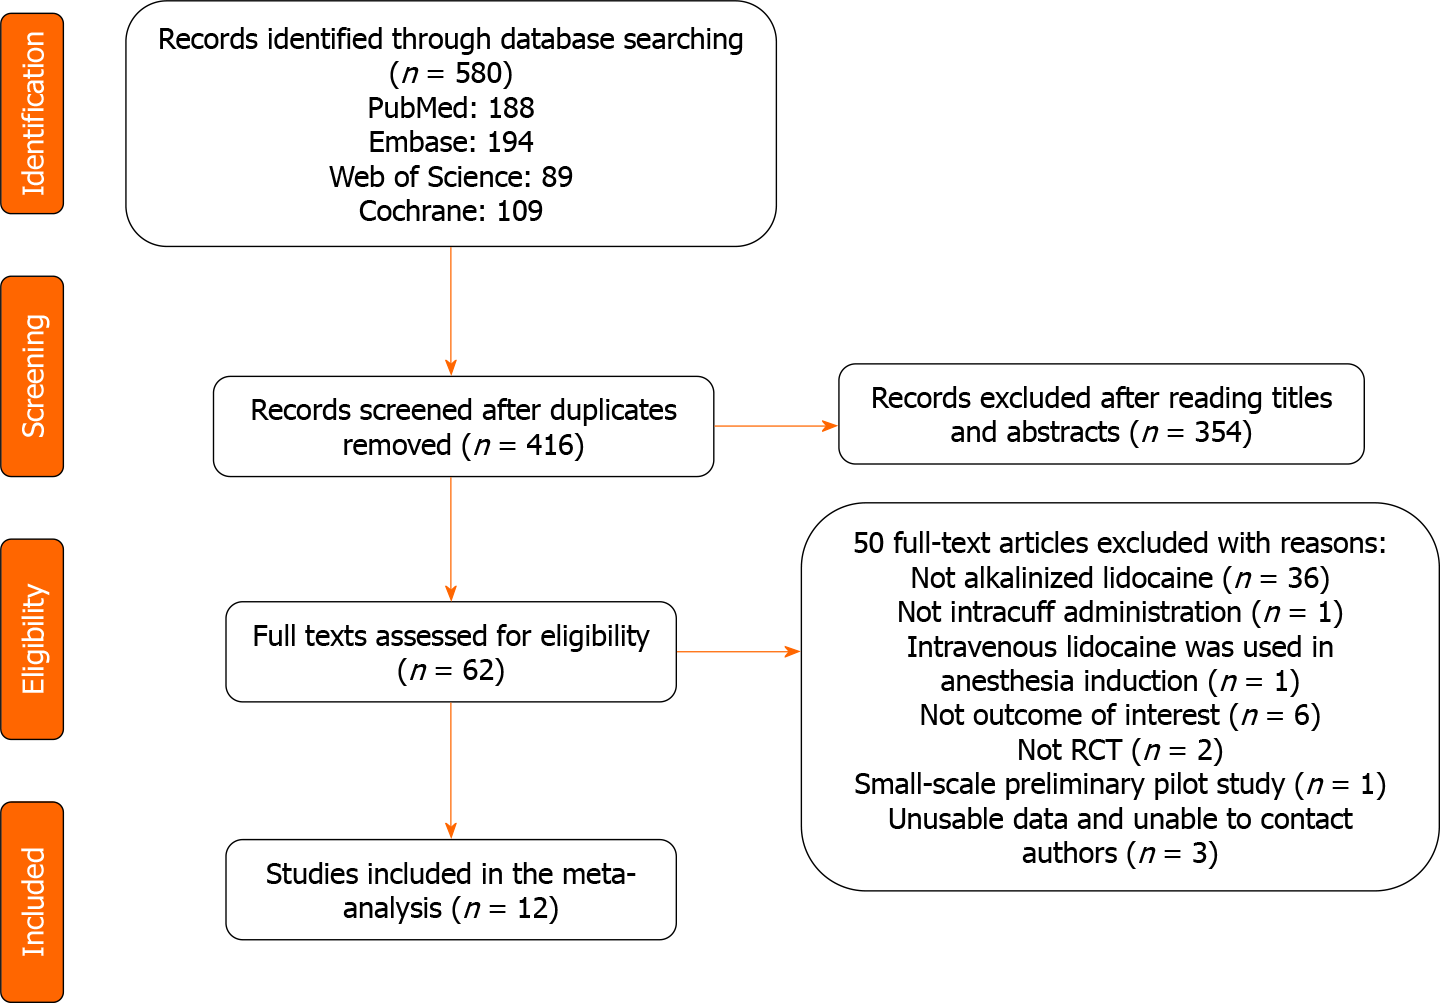
Figure 1 Flow diagram of included and excluded studies.
RCT: Randomized controlled trial.
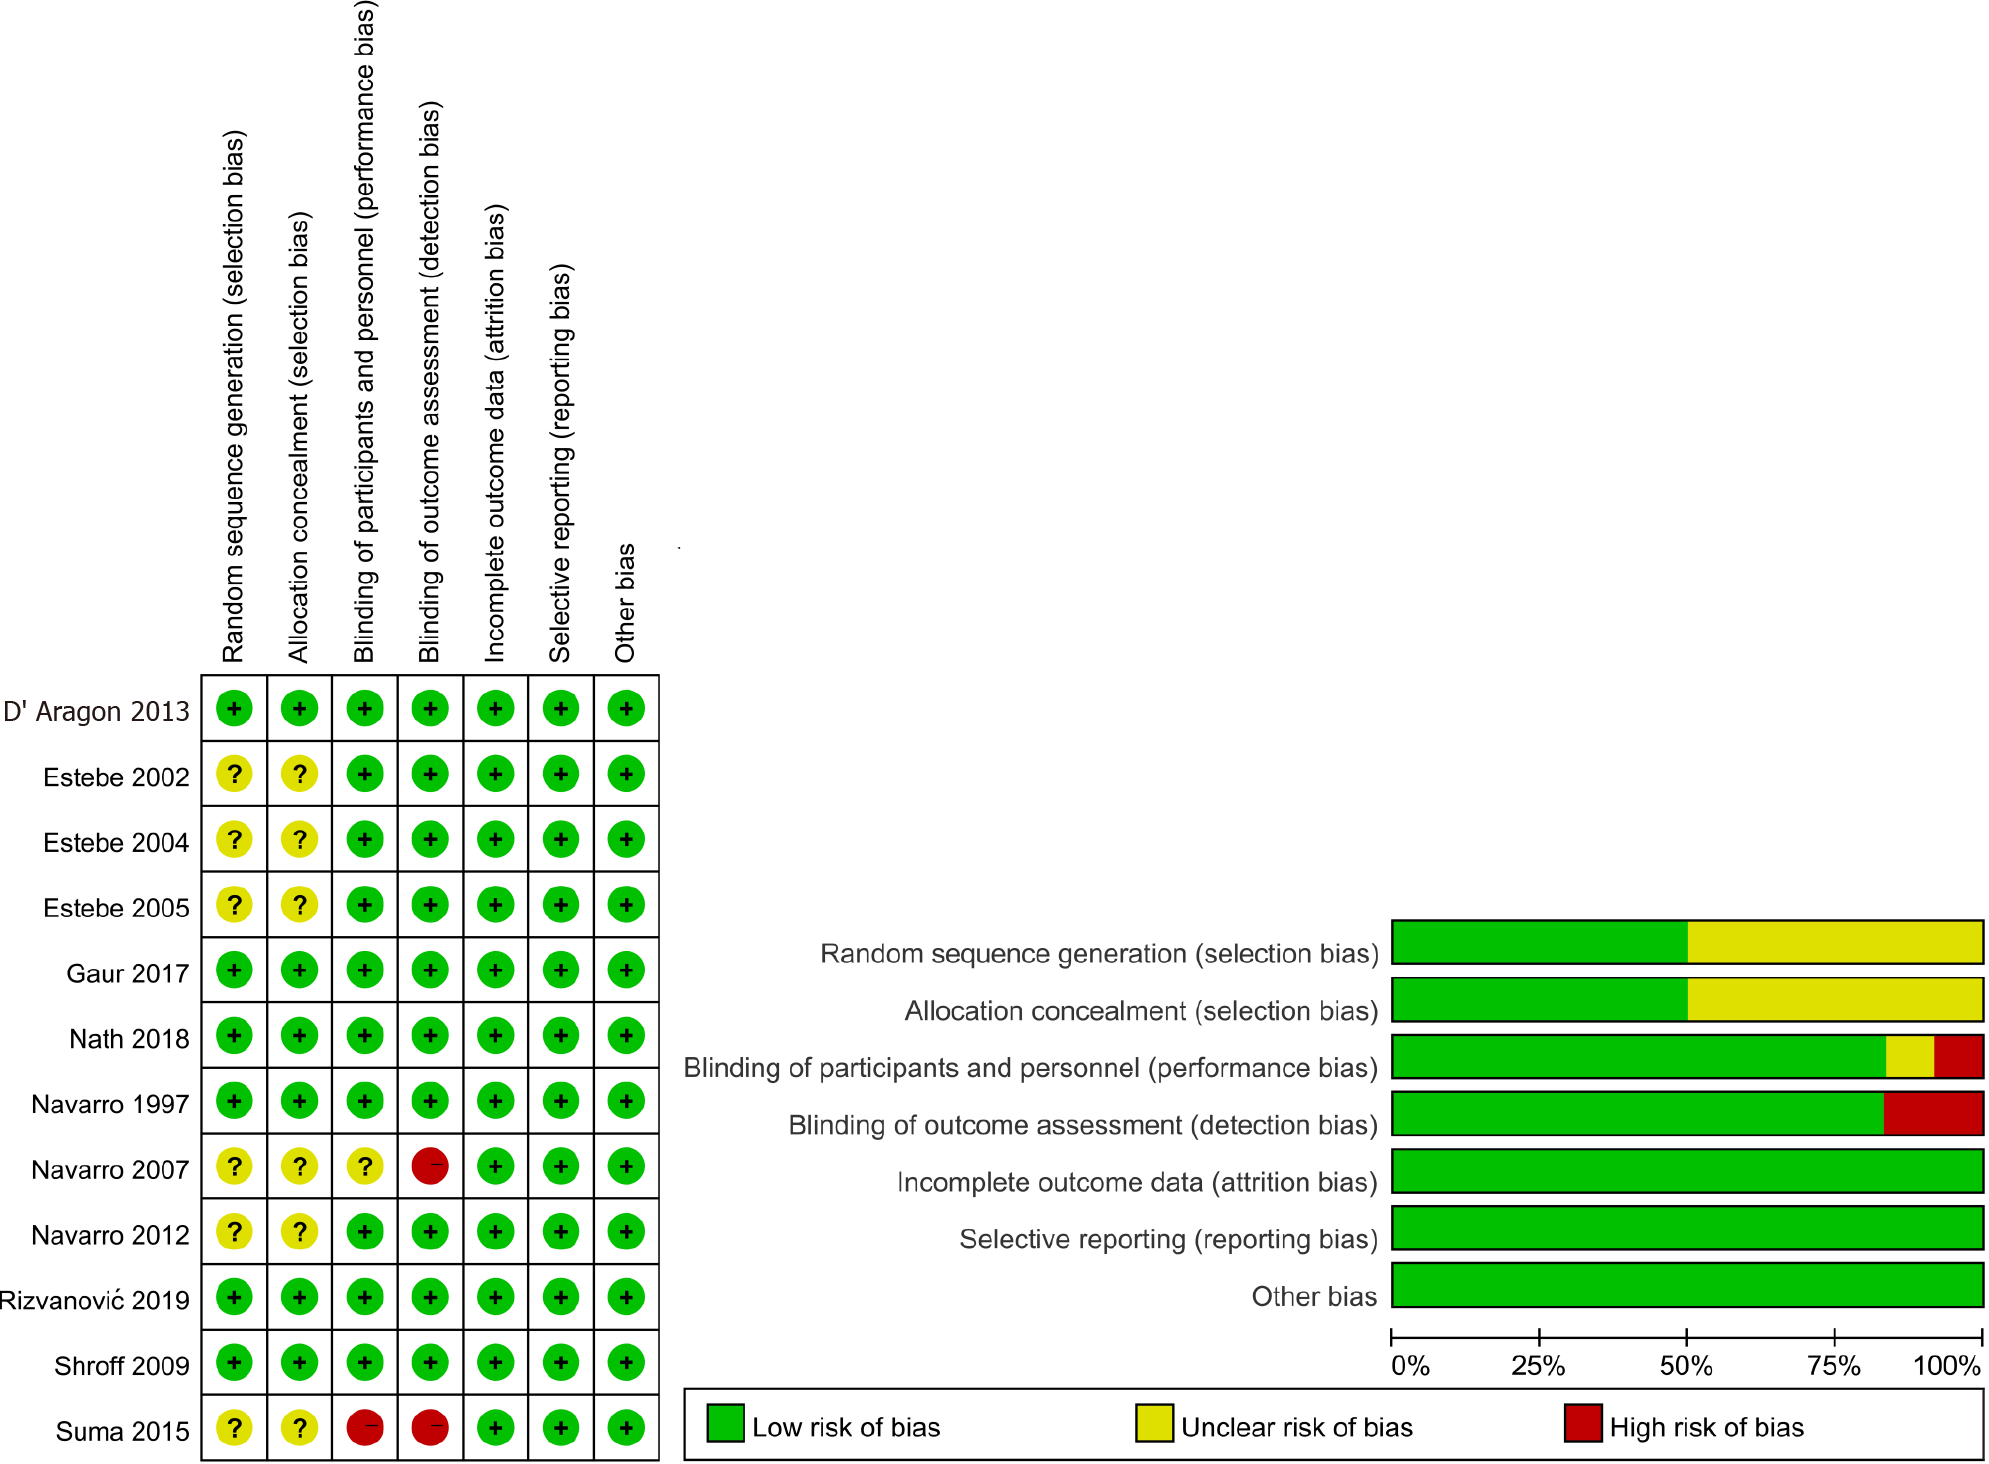
Figure 2 Risk of bias assessment for the primary studies.
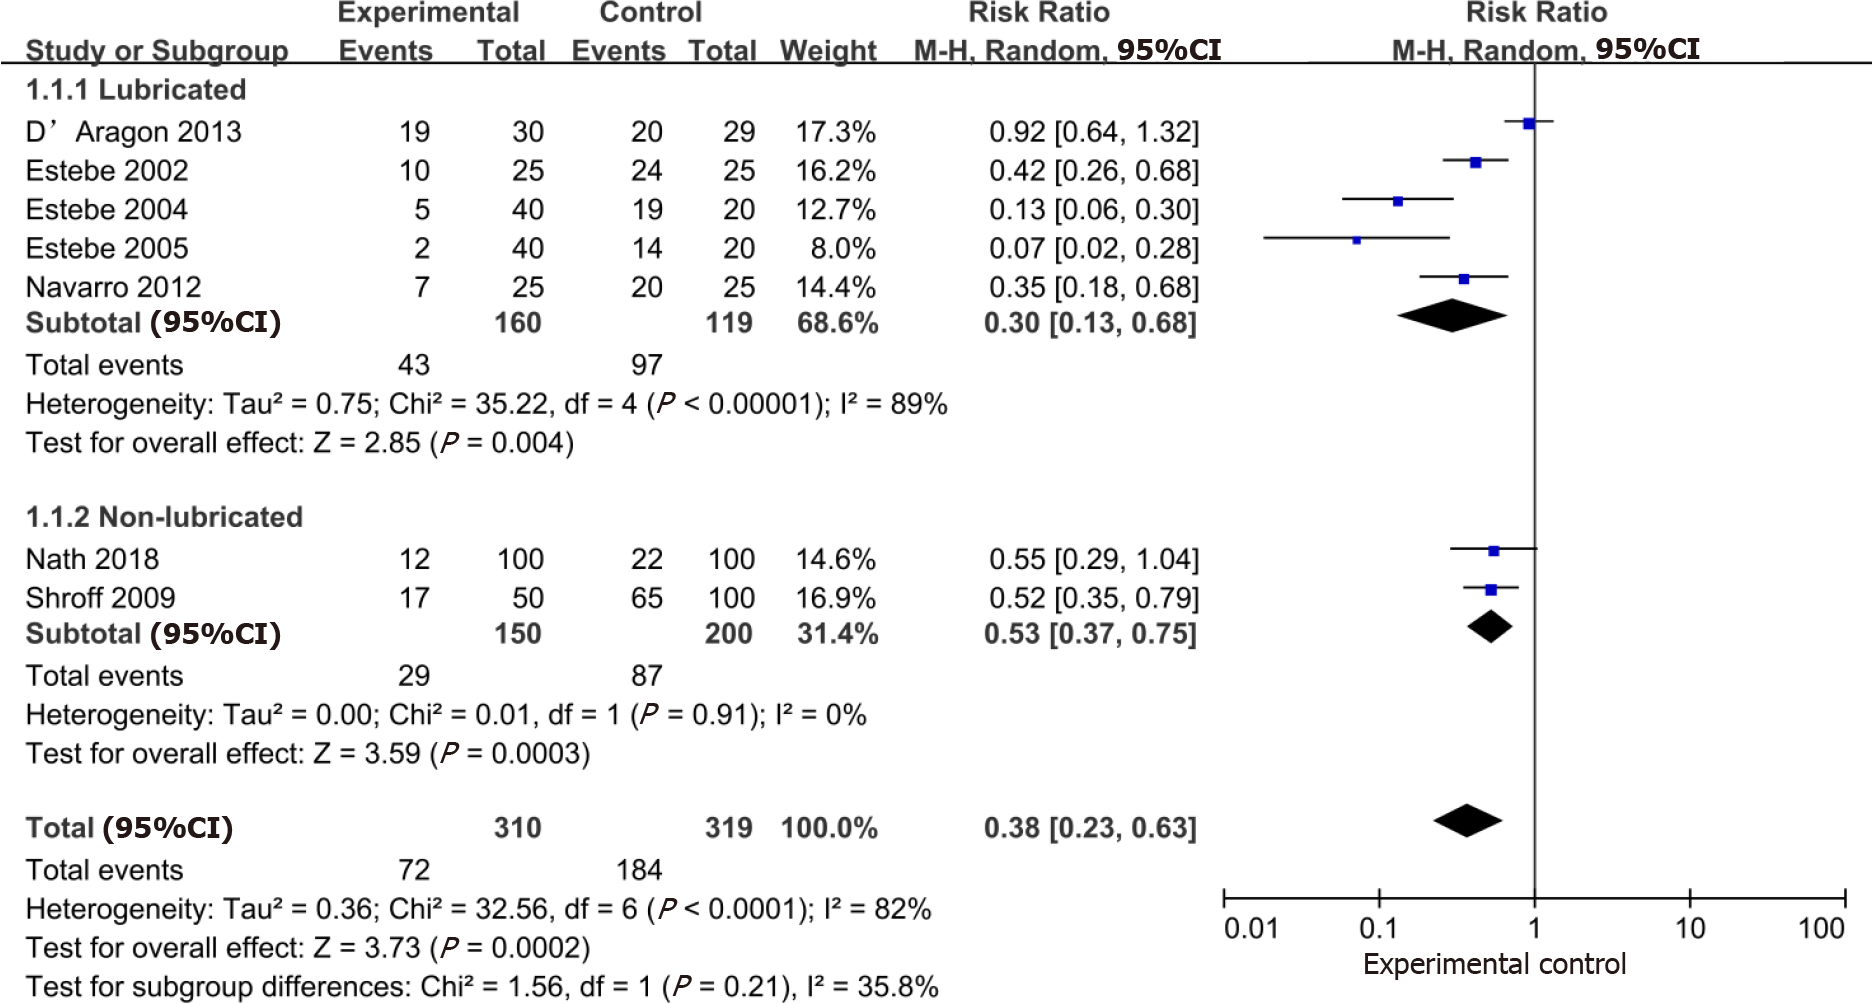
Figure 3 Forrest plots showing the effects of the intervention.
Incidence of postoperative cough. CI: Confidence interval.
Figure 4 Forrest plots showing the effects of the intervention.
Incidence of postoperative hoarseness. CI: Confidence interval.
Figure 5 Forrest plots showing the effects of the intervention.
Incidence of a postoperative sore throat within 24 h. CI: Confidence interval.
Figure 6 Forrest plots showing the effects of the intervention.
Visual analogue scale of a postoperative sore throat at 1 h. CI: Confidence interval; SD: Standard deviation.
Figure 7 Forrest plots showing the effects of the intervention.
Visual analogue scale of a postoperative sore throat at 24 h. CI: Confidence interval; SD: Standard deviation.
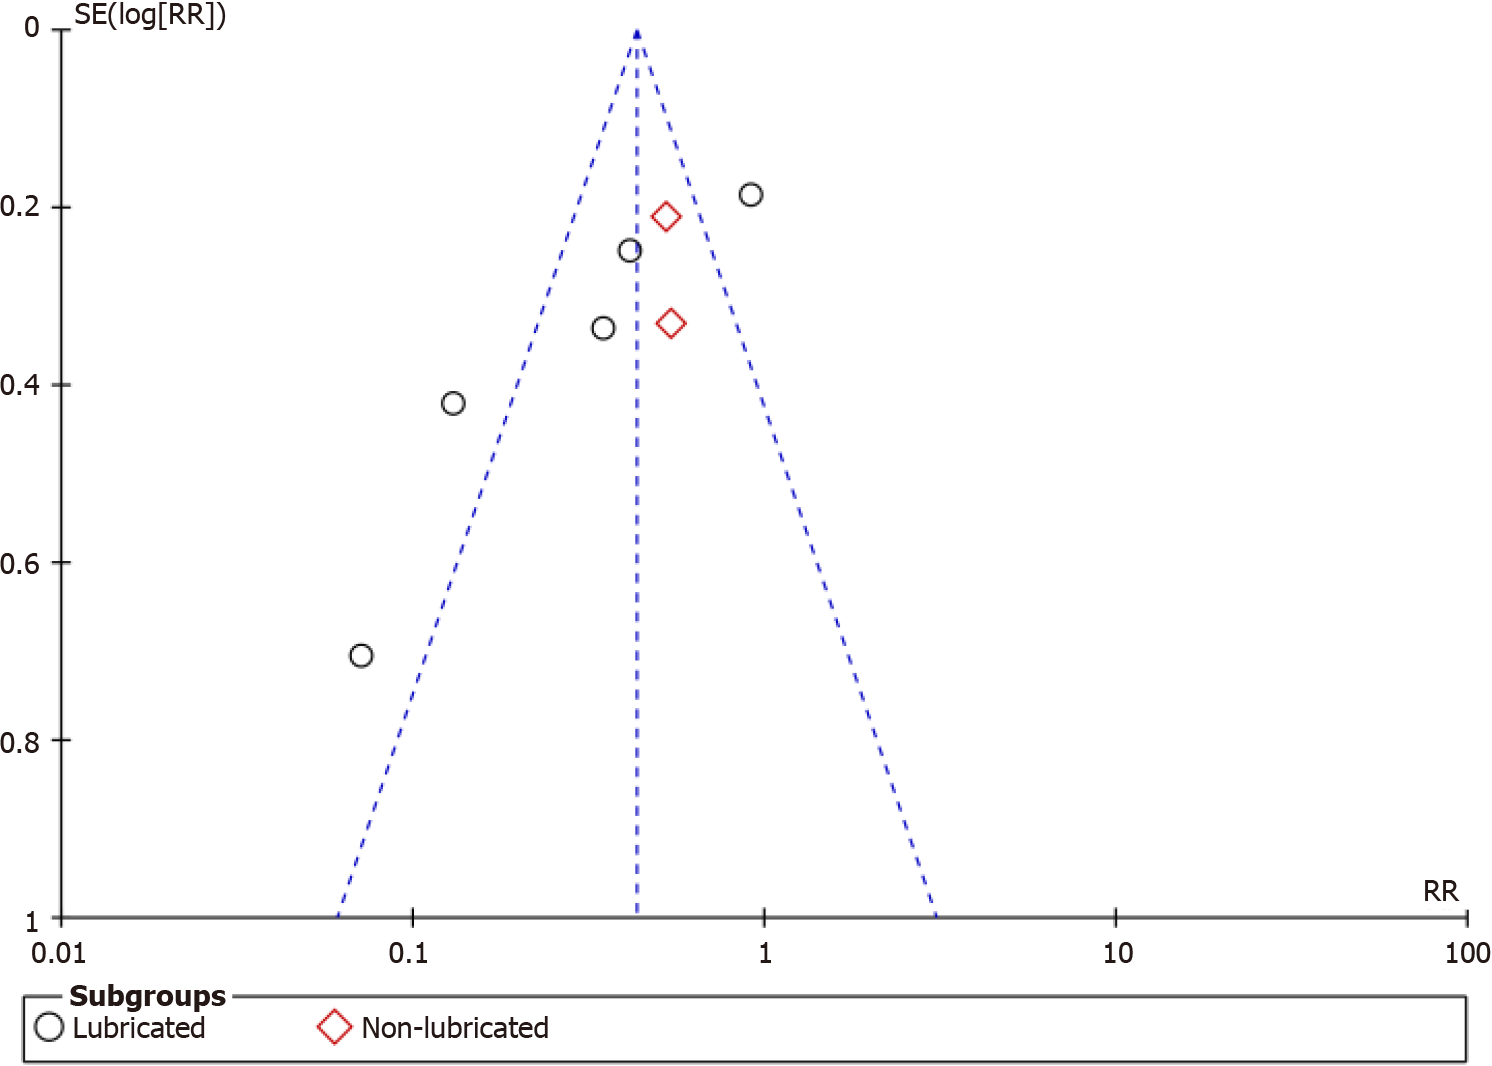
Figure 8 Funnel plot for evaluation of potential publication bias.
RR: Risk ratio.
- Citation: Chen ZX, Shi Z, Wang B, Zhang Y. Intracuff alkalinized lidocaine to prevent postoperative airway complications: A meta-analysis. World J Clin Cases 2021; 9(34): 10626-10637
- URL: https://www.wjgnet.com/2307-8960/full/v9/i34/10626.htm
- DOI: https://dx.doi.org/10.12998/wjcc.v9.i34.10626


