Meta-Analysis
Copyright ©The Author(s) 2021.
World J Clin Cases. Nov 16, 2021; 9(32): 9878-9888
Published online Nov 16, 2021. doi: 10.12998/wjcc.v9.i32.9878
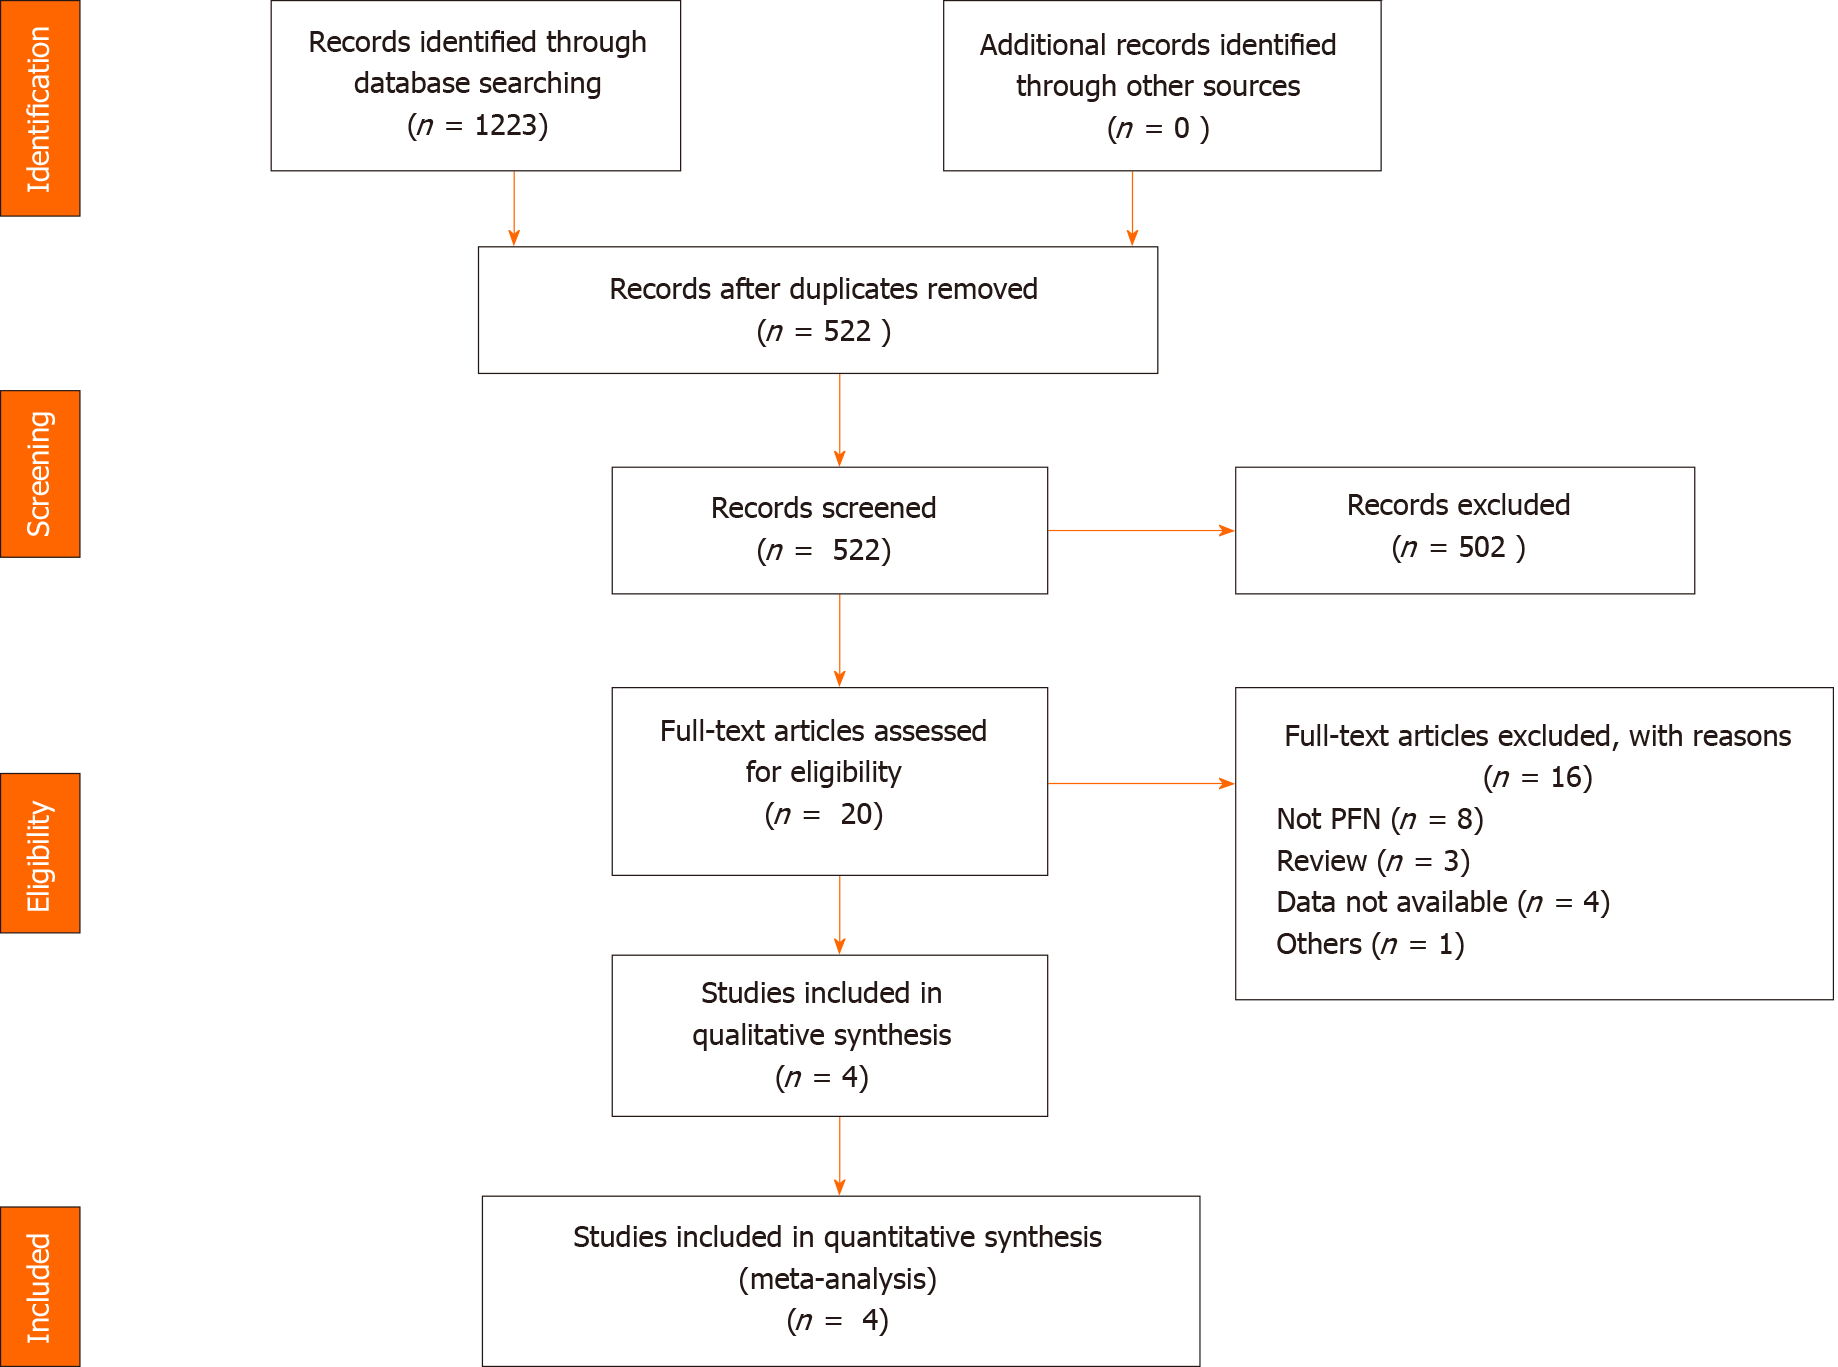
Figure 1
Figure 1 PRISMA flow chart depicting selection of articles. PFN: Proximal femoral nail.
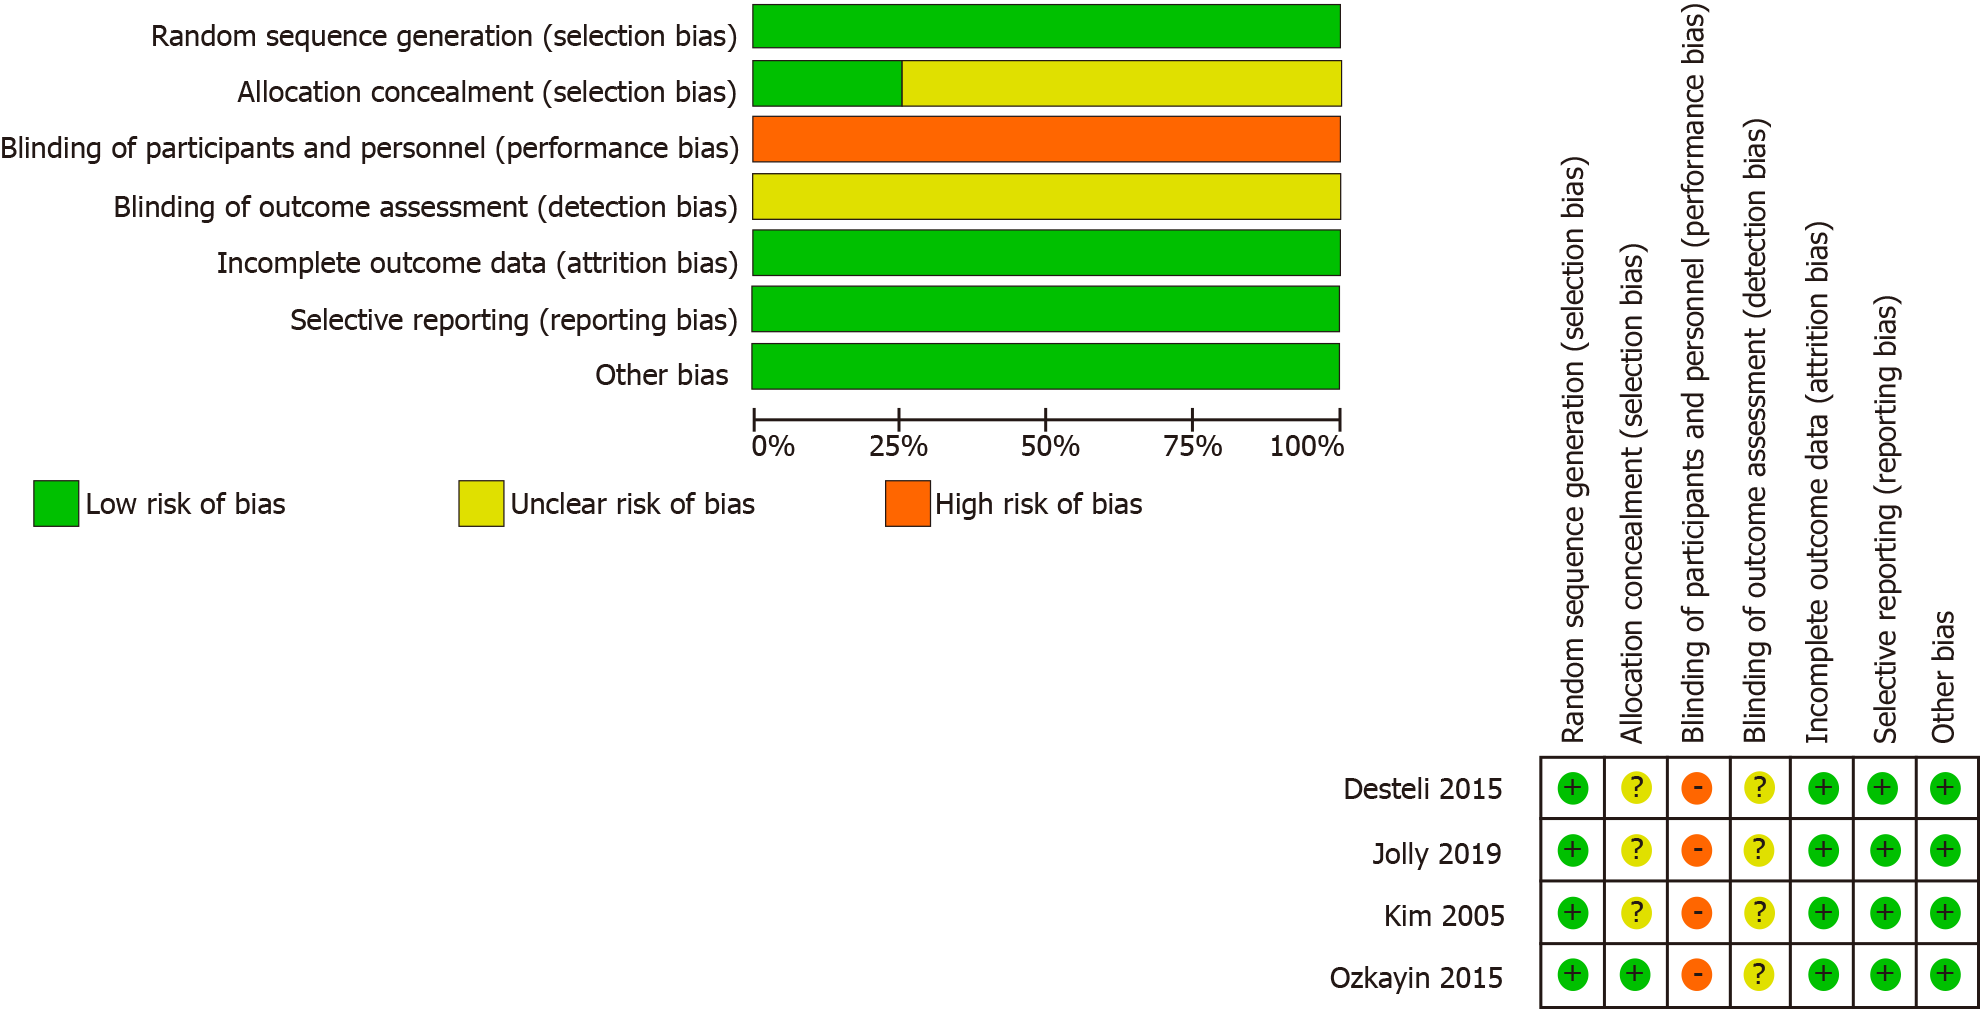
Figure 2
Figure 2 Risk of bias graph: Investigators judgment each risk of bias item presented across all studies.
Figure 3
Figure 3 Forest plot diagram of compared Harris Hip Score between arthroplasty and proximal femoral nail[14,17,18]. HA: arthroplasty; PFN: proximal femoral nail; CI: confidence interval.
Figure 4
Figure 4 Forest plot diagram of mortality compared between arthroplasty and proximal femoral nail[14,15,18]. HA: arthroplasty; PFN: proximal femoral nail; CI: confidence interval.
Figure 5
Figure 5 Forest plot diagram of complications compared between arthroplasty and proximal femoral nail[14,15,18,17]. HA: arthroplasty; PFN: proximal femoral nail; CI: confidence interval.
Figure 6
Figure 6 Forest plot diagram of blood loss compared between arthroplasty and proximal femoral nail[14,18]. HA: arthroplasty; PFN: proximal femoral nail; CI: confidence interval.
Figure 7
Figure 7 Forest plot diagram of operation time compared between arthroplasty and proximal femoral nail[14,15,18,17]. HA: arthroplasty; PFN: proximal femoral nail; CI: confidence interval.
Figure 8
Figure 8 Forest plot diagram of the length of hospital stay compared arthroplasty and proximal femoral nail[15,17]. HA: arthroplasty; PFN: proximal femoral nail; CI: confidence interval.
Figure 9
Figure 9 Forest plot diagram of anesthesia compared between arthroplasty and proximal femoral nail[14,15,17]. HA: arthroplasty; PFN: proximal femoral nail; CI: confidence interval.