Copyright
©The Author(s) 2021.
World J Clin Cases. Nov 6, 2021; 9(31): 9509-9519
Published online Nov 6, 2021. doi: 10.12998/wjcc.v9.i31.9509
Published online Nov 6, 2021. doi: 10.12998/wjcc.v9.i31.9509
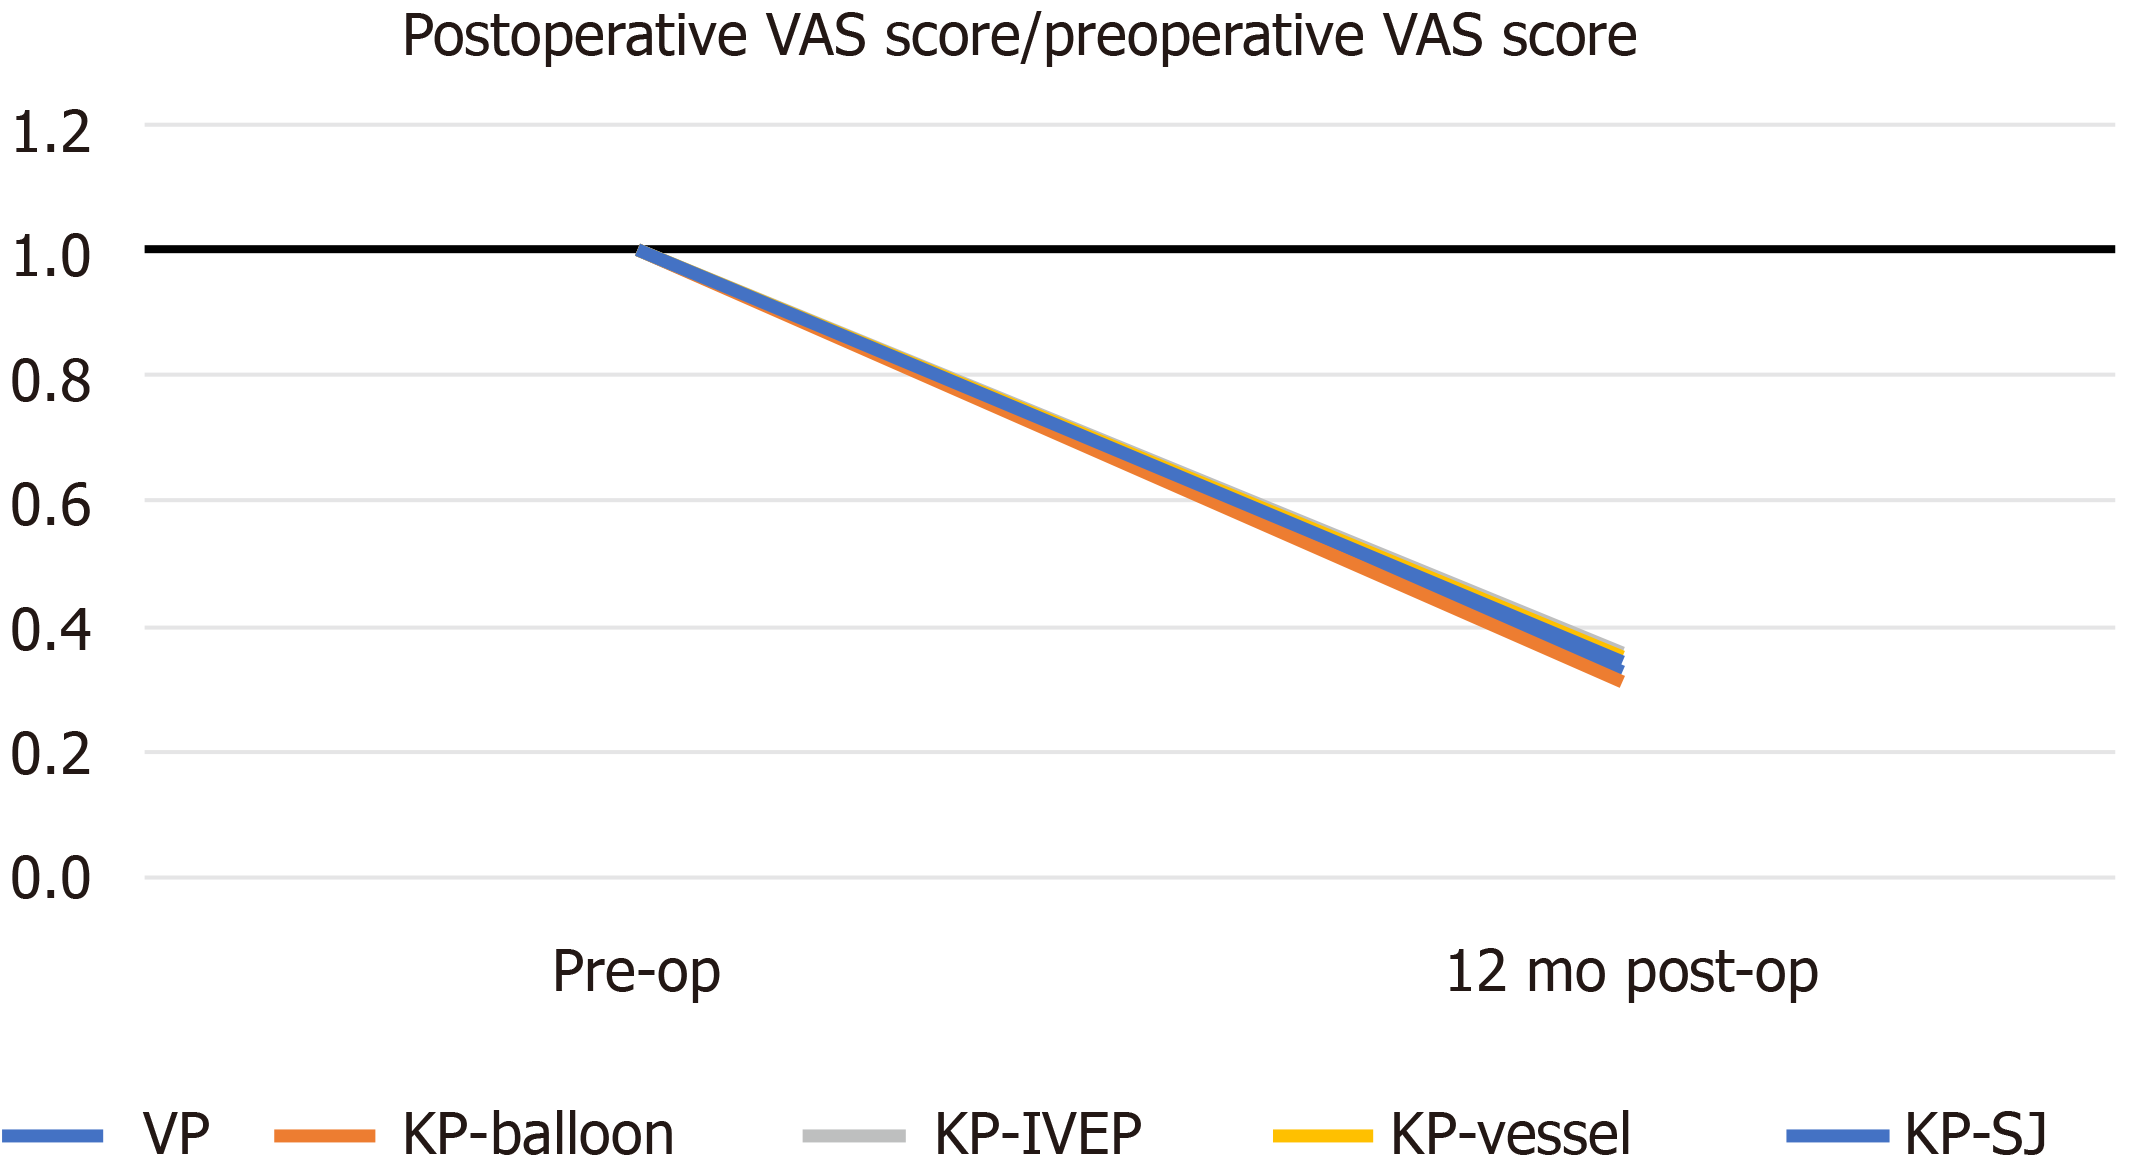
Figure 1 Ratio of the preoperative visual analog scale score/postoperative visual analog scale score.
There was no significant different between any of the surgical treatments 1 year postoperatively. VAS: Visual analog scale; VP: Vertebroplasty; KP: Kyphoplasty; IVEP: Intravertebral expandable pillar; SJ: SpineJack; pre-op: Preoperatively; post-op: Postoperatively.
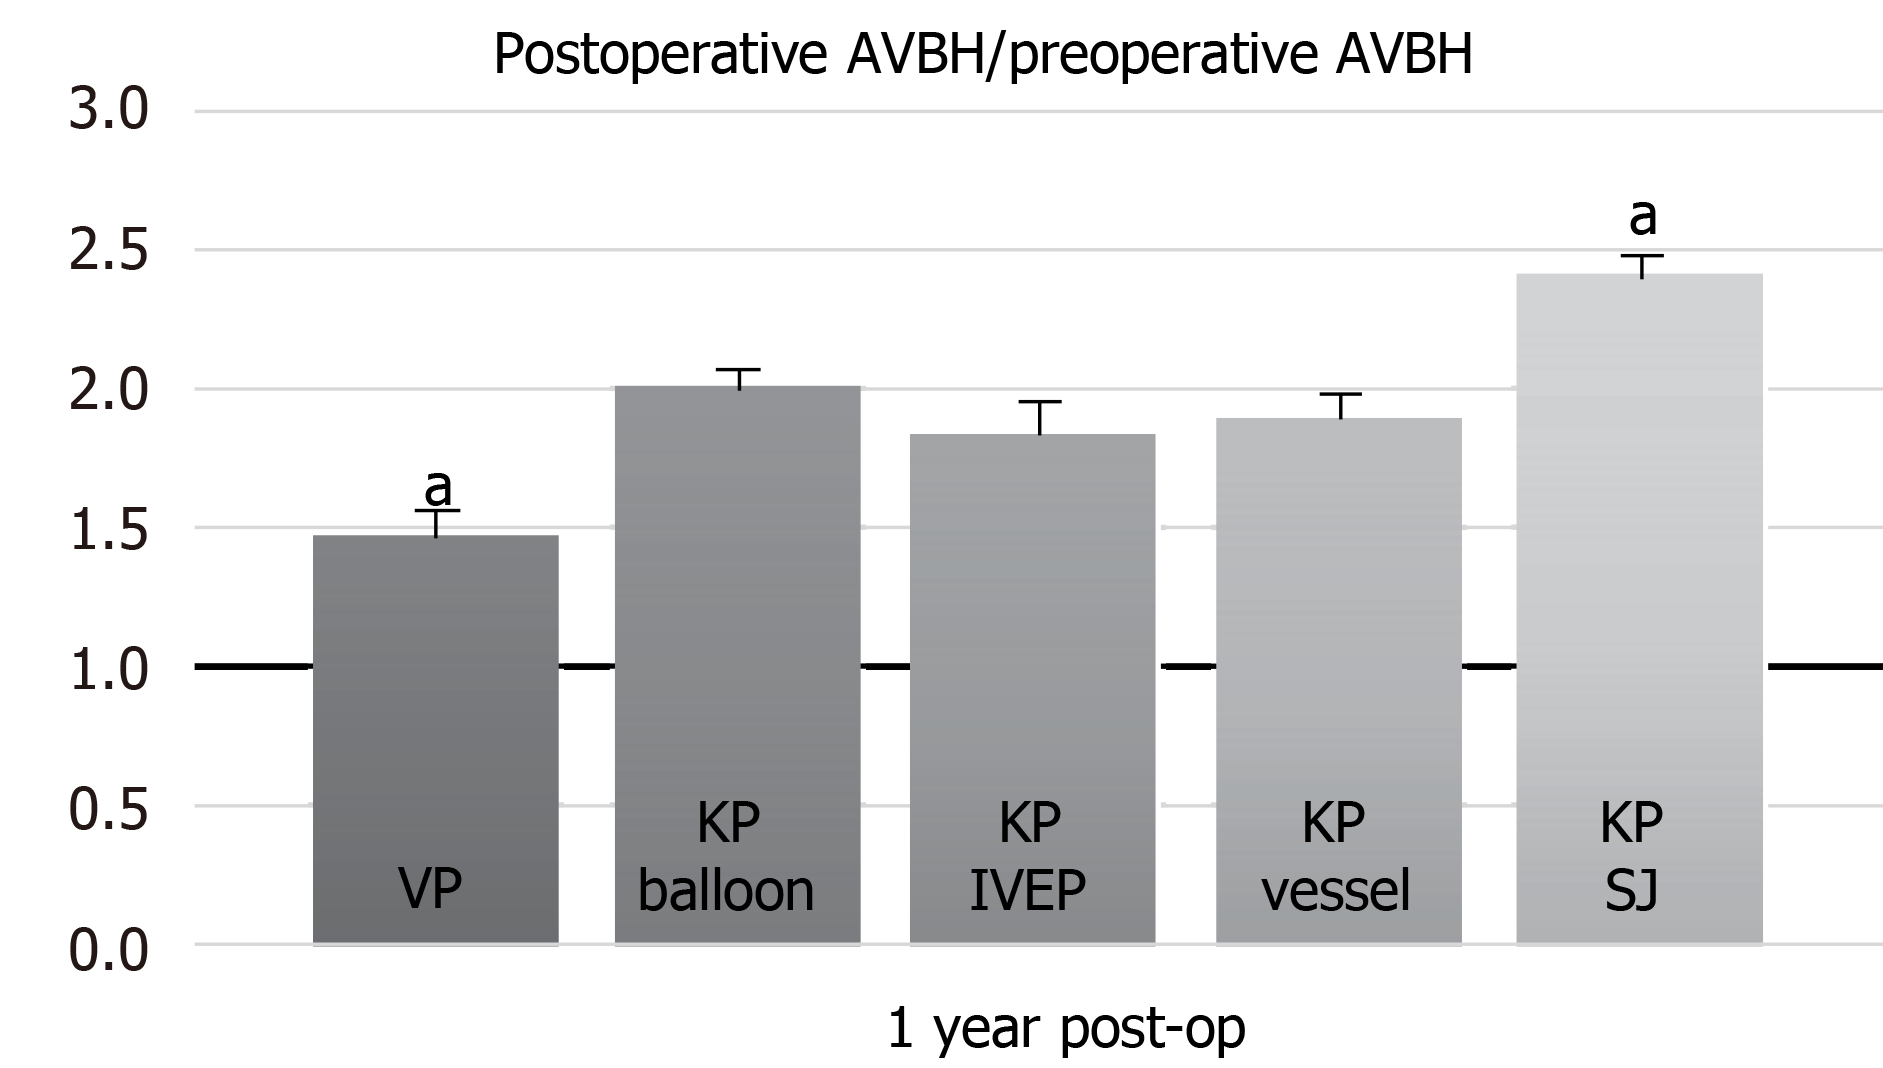
Figure 2 Ratio of 1-year postoperative average body height/preoperative average body height.
The vertebroplasty group had the worst performance in terms of average body height. aP < 0.05. AVBH: Average body height; VP: Vertebroplasty; KP: Kyphoplasty; IVEP: Intravertebral expandable pillar; SJ: SpineJack; post-op: Postoperatively.
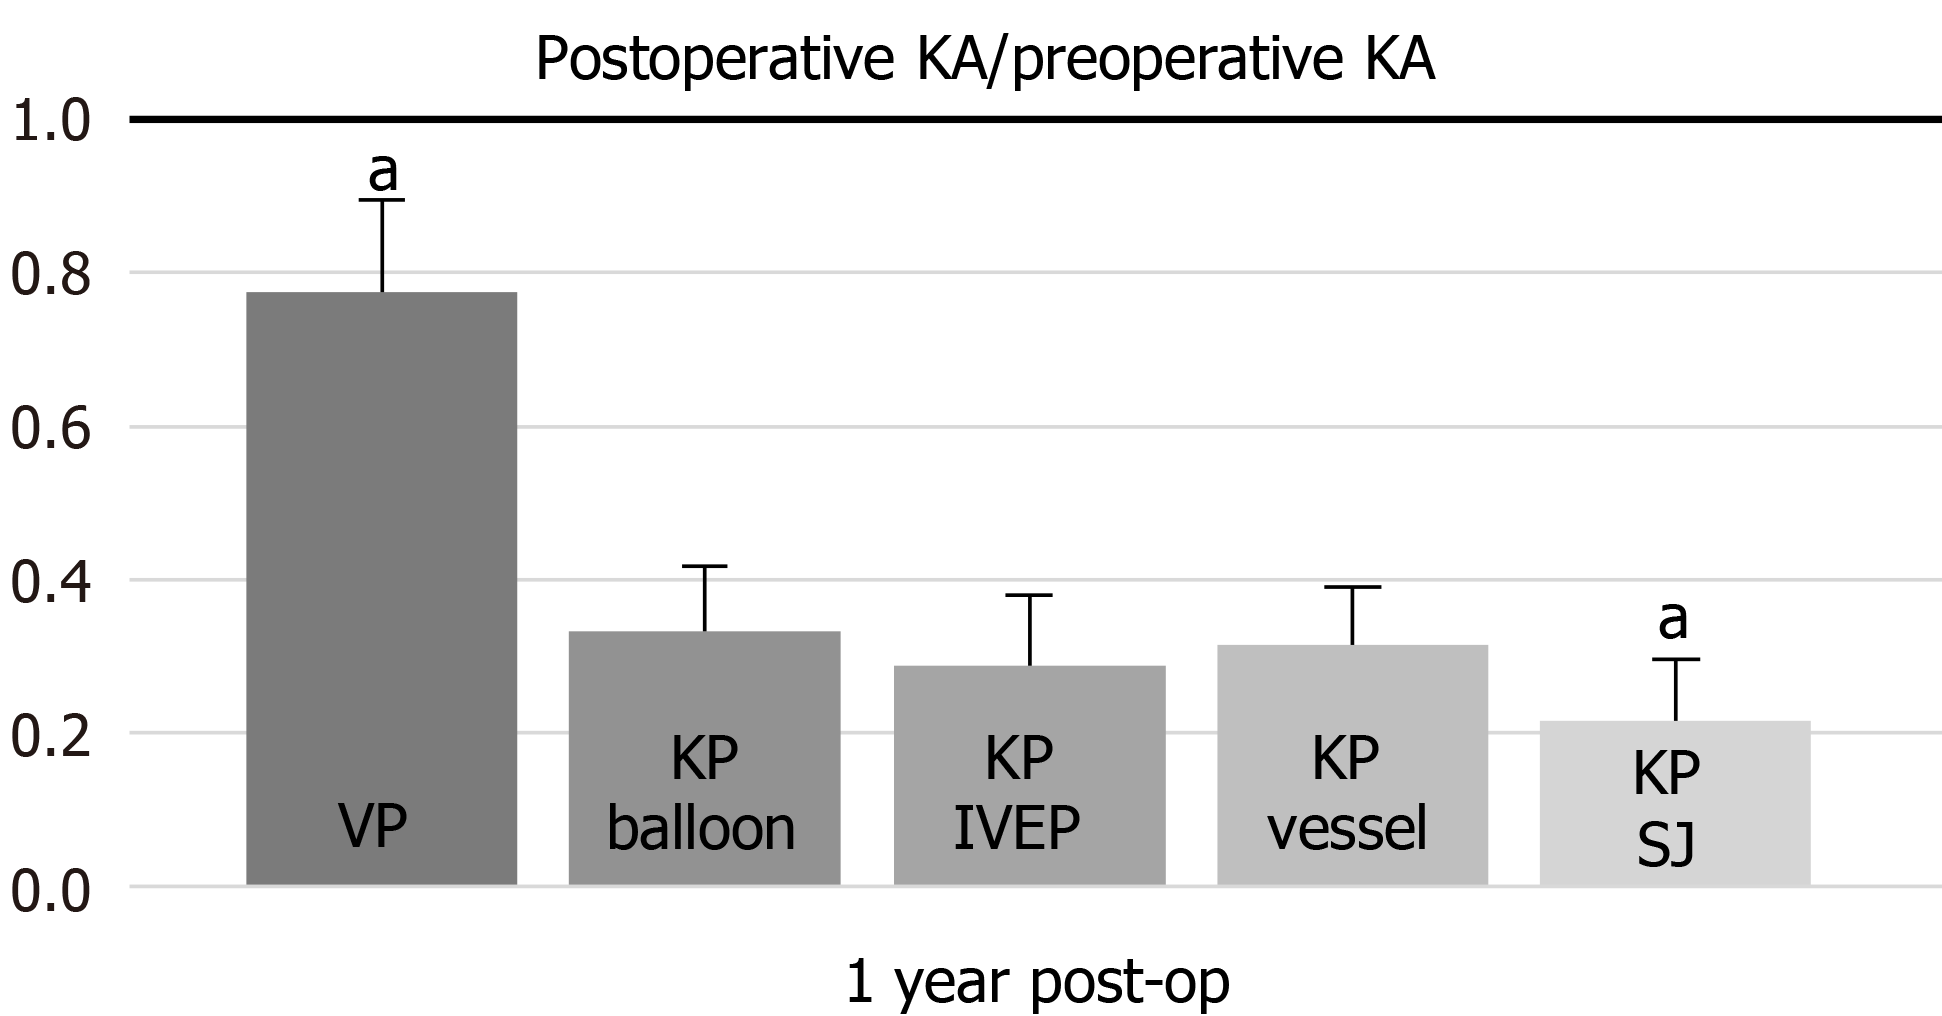
Figure 3 Ratio of the 1-year postoperative kyphotic angle/preoperative kyphotic angle.
The vertebroplasty group had the worst performance in terms of kyphotic angle correction. aP < 0.05. KA: Kyphotic angle; VP: Vertebroplasty; KP: Kyphoplasty; IVEP: Intravertebral expandable pillar; SJ: SpineJack.
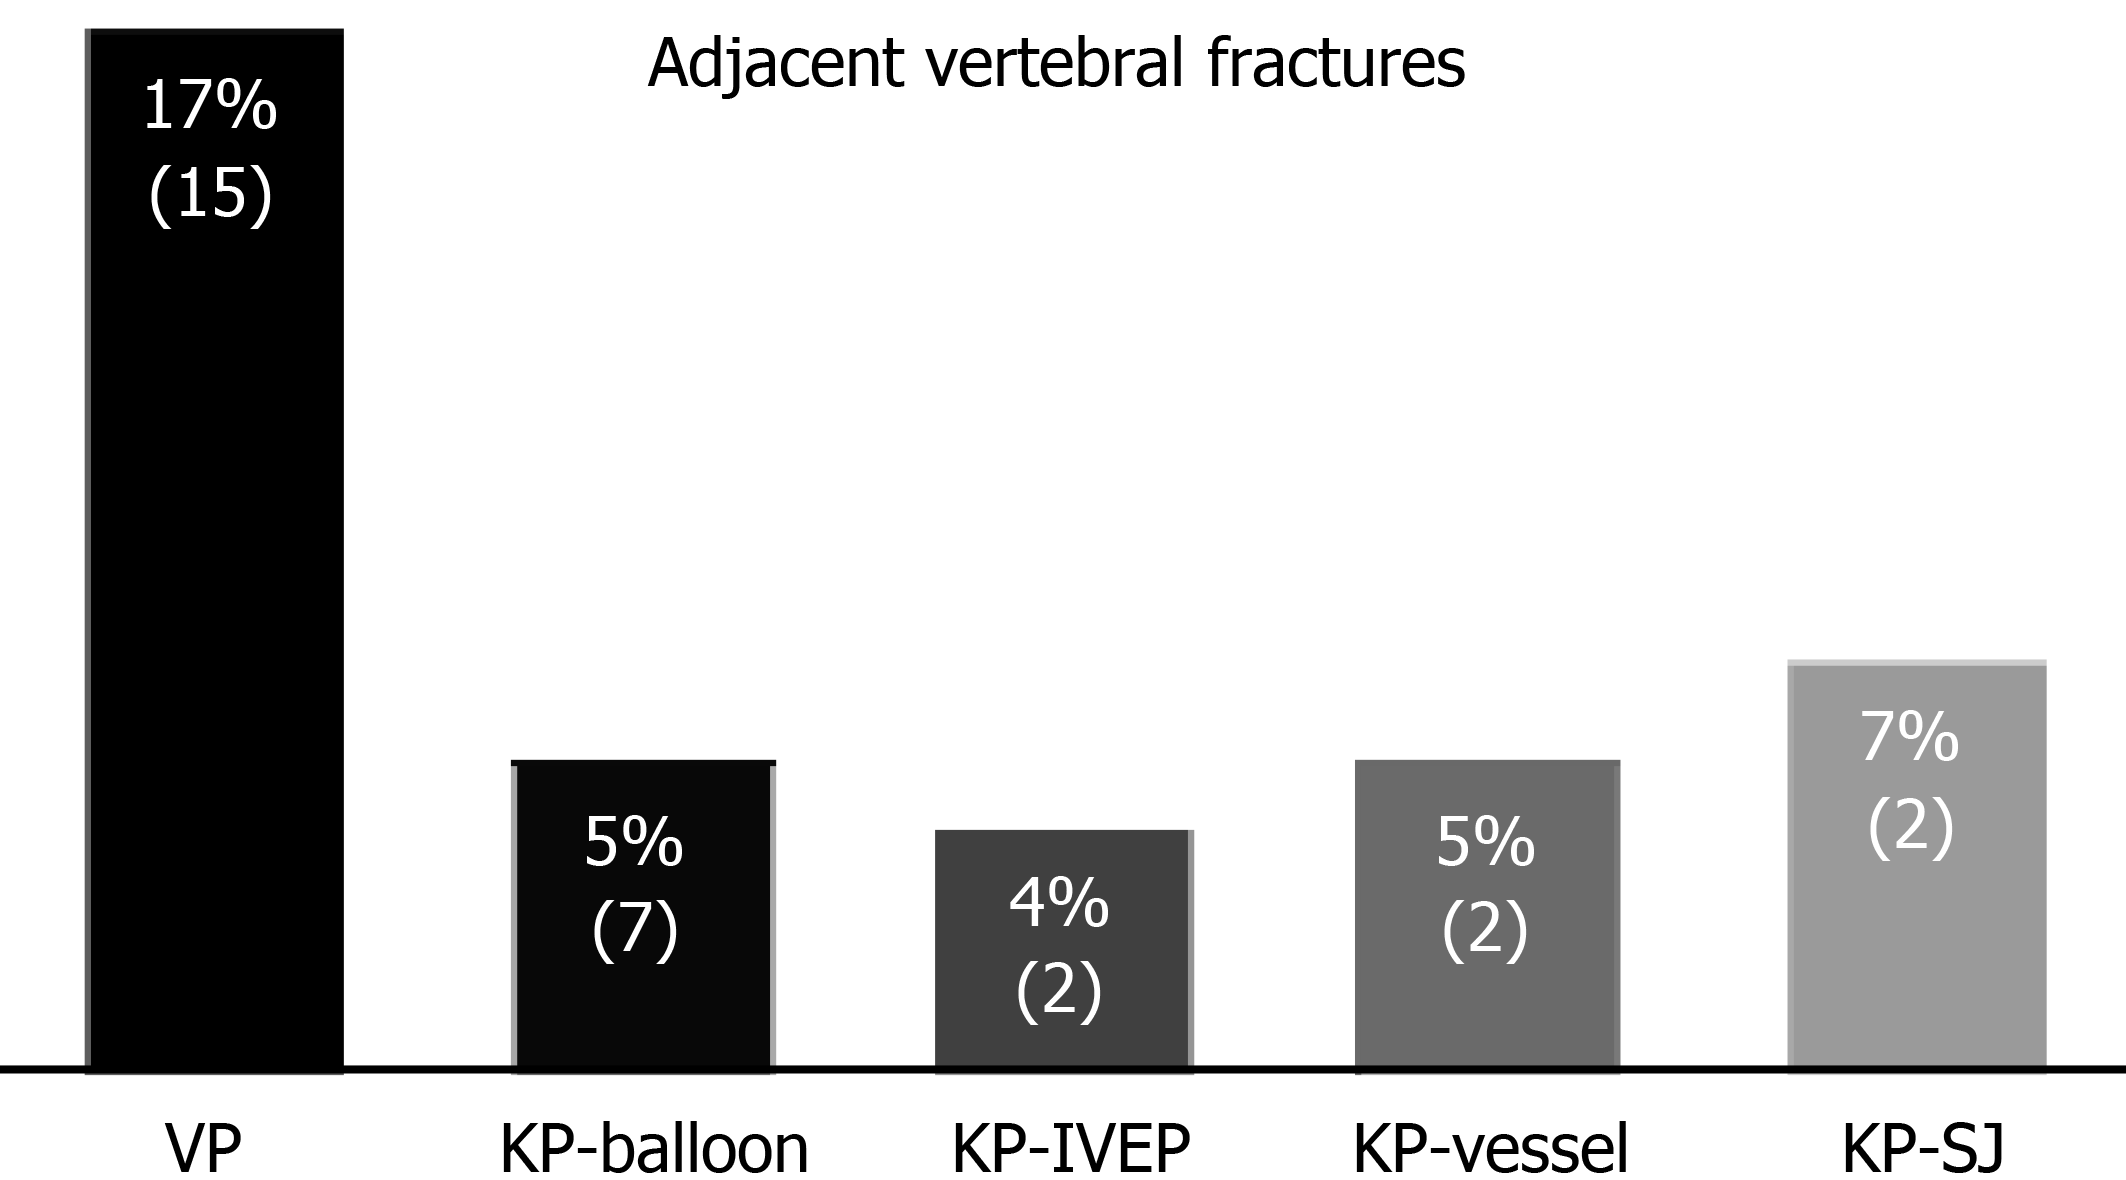
Figure 4 Rate of adjacent vertebral fractures.
The highest rate of adjacent vertebral fracture occurred in the vertebroplasty group, with a rate as high as 17%. VP: Vertebroplasty; KP: Kyphoplasty; IVEP: Intravertebral expandable pillar; SJ: SpineJack.
- Citation: Yeh KL, Wu SH, Liaw CK, Hou SM, Wu SS. Outcomes of different minimally invasive surgical treatments for vertebral compression fractures: An observational study. World J Clin Cases 2021; 9(31): 9509-9519
- URL: https://www.wjgnet.com/2307-8960/full/v9/i31/9509.htm
- DOI: https://dx.doi.org/10.12998/wjcc.v9.i31.9509


