Copyright
©The Author(s) 2021.
World J Clin Cases. Nov 6, 2021; 9(31): 9431-9439
Published online Nov 6, 2021. doi: 10.12998/wjcc.v9.i31.9431
Published online Nov 6, 2021. doi: 10.12998/wjcc.v9.i31.9431
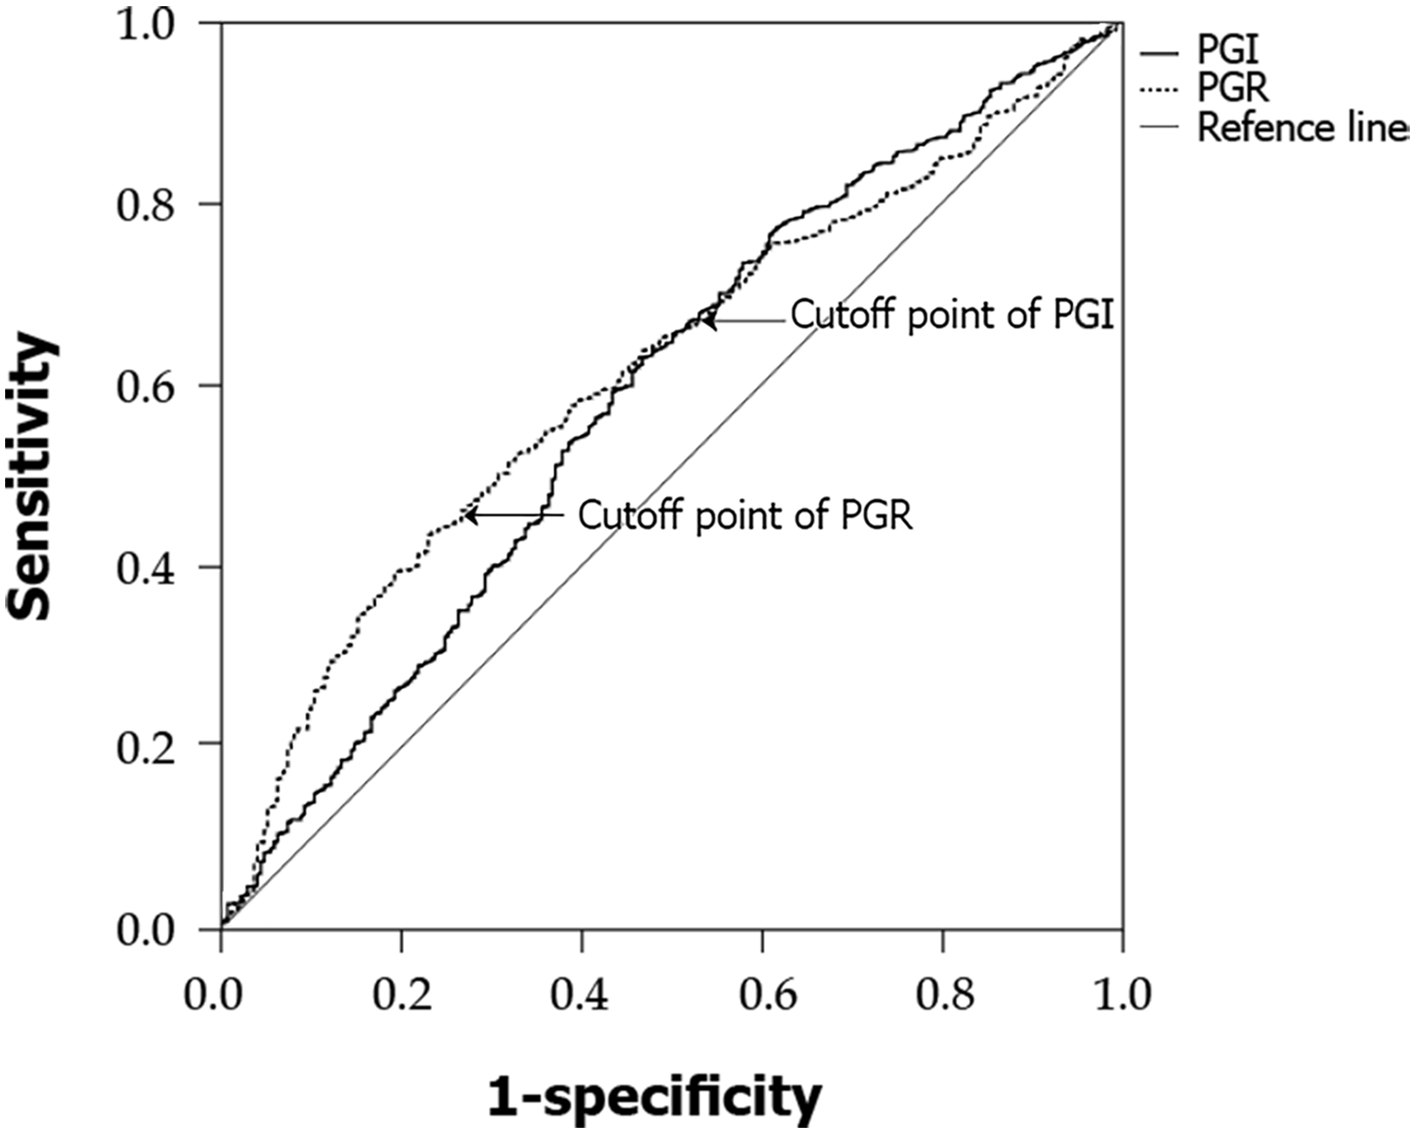
Figure 1 Operating characteristics curve analysis of pepsinogen I and pepsinogen I/pepsinogen II ratio for the low-risk group.
The Operative Link for Gastritis Assessment (OLGA) I and II groups were combined as the low-risk group and compared with the OLGA-0 group. PG: Pepsinogen; PGR: Pepsinogen I/pepsinogen II ratio; OLGA: Operative Link for Gastritis Assessment.
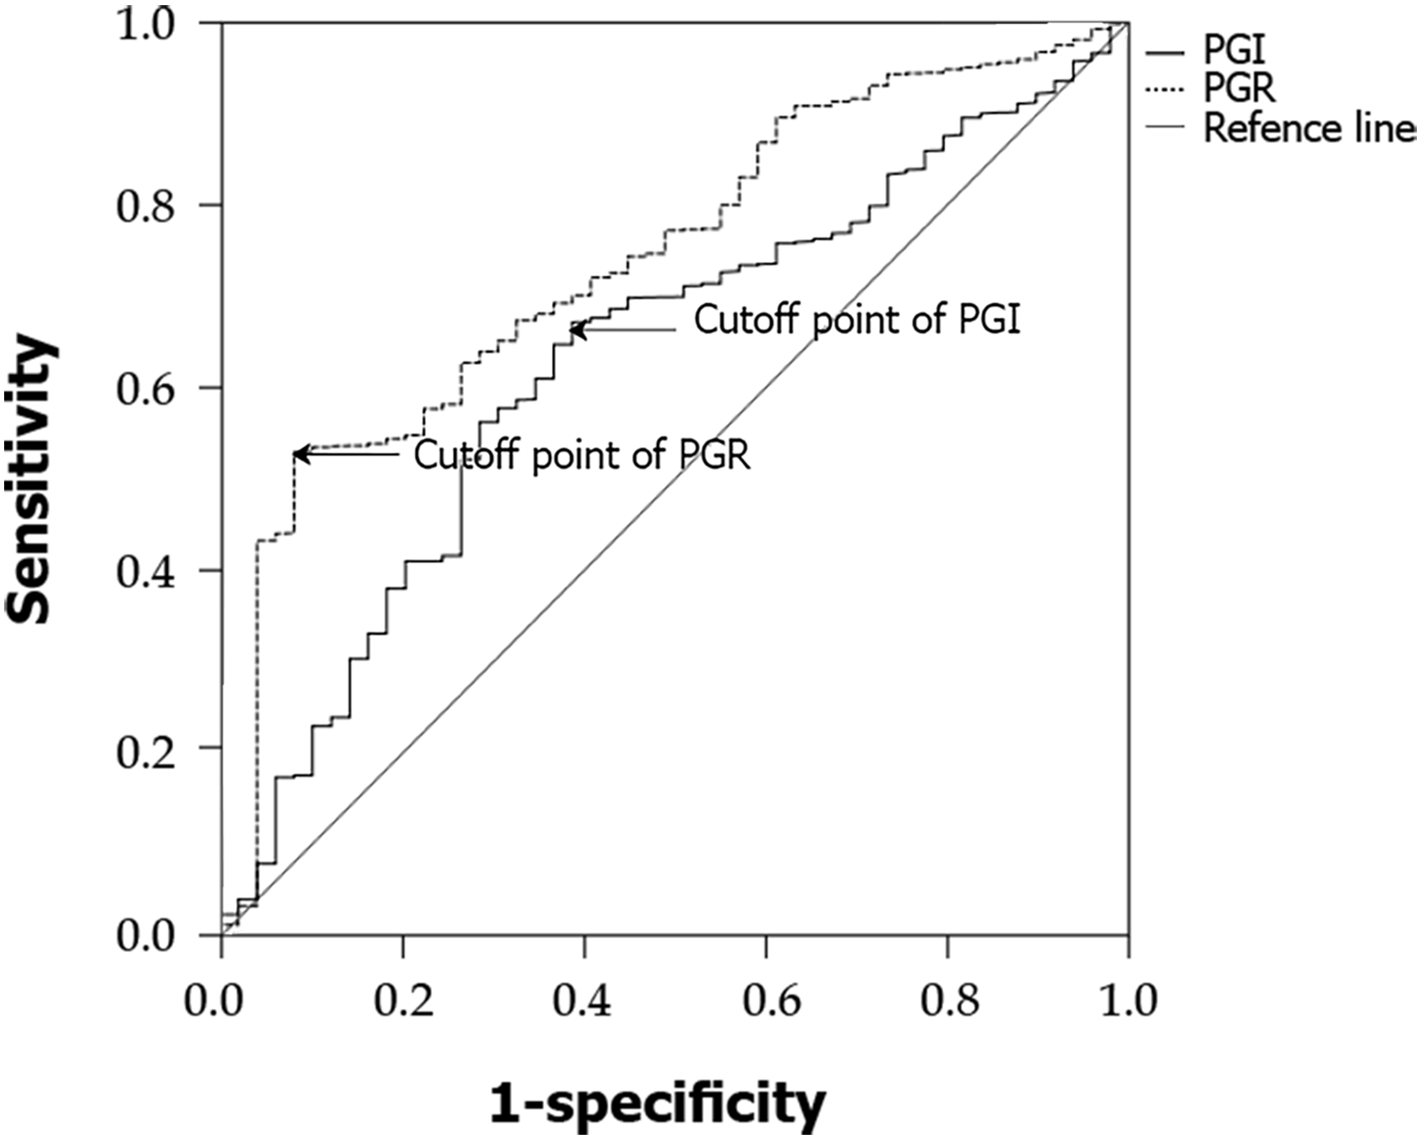
Figure 2 Operating characteristics curve analysis of pepsinogen I and pepsinogen I/pepsinogen II ratio for the high-risk group.
The Operative Link for Gastritis Assessment (OLGA) III and IV groups were combined as the high-risk group and compared with OLGA 0, I, and II groups. PG: Pepsinogen; PGR: Pepsinogen I/pepsinogen II ratio; OLGA: Operative Link for Gastritis Assessment.
- Citation: Cai HL, Tong YL. Association of serum pepsinogen with degree of gastric mucosal atrophy in an asymptomatic population. World J Clin Cases 2021; 9(31): 9431-9439
- URL: https://www.wjgnet.com/2307-8960/full/v9/i31/9431.htm
- DOI: https://dx.doi.org/10.12998/wjcc.v9.i31.9431


