Copyright
©The Author(s) 2021.
World J Clin Cases. Oct 26, 2021; 9(30): 9090-9100
Published online Oct 26, 2021. doi: 10.12998/wjcc.v9.i30.9090
Published online Oct 26, 2021. doi: 10.12998/wjcc.v9.i30.9090
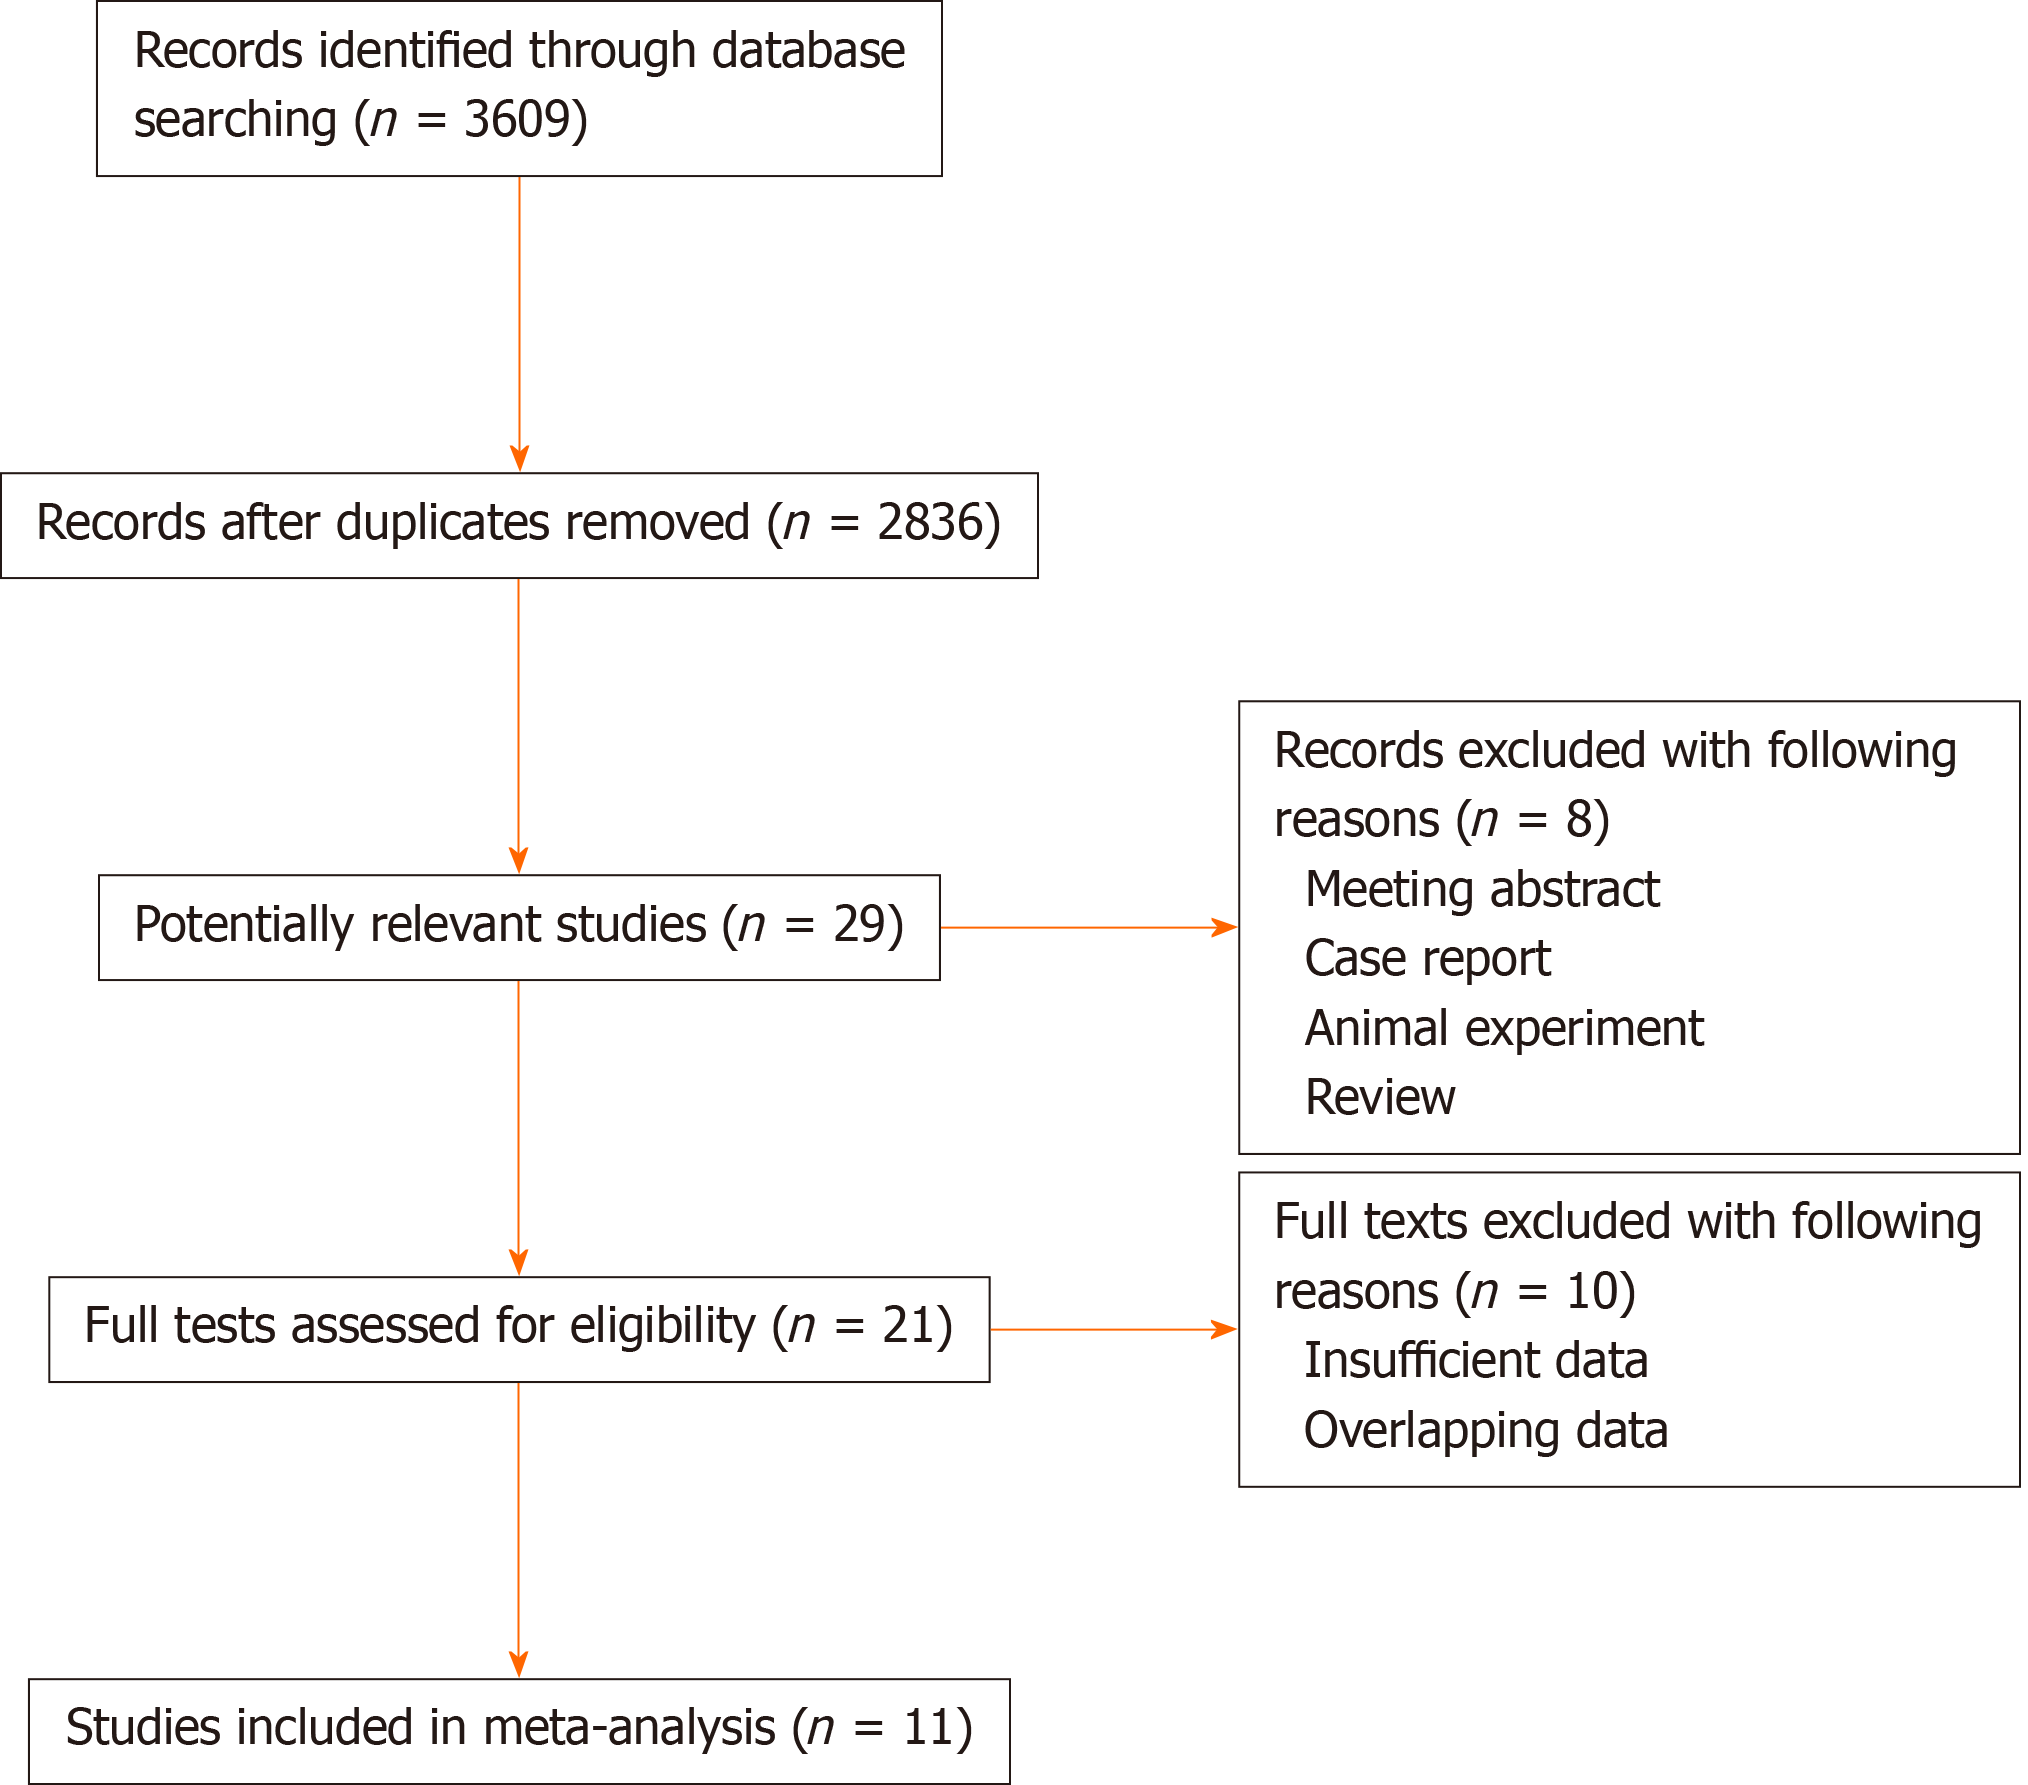
Figure 1 Flow diagram of literature review.
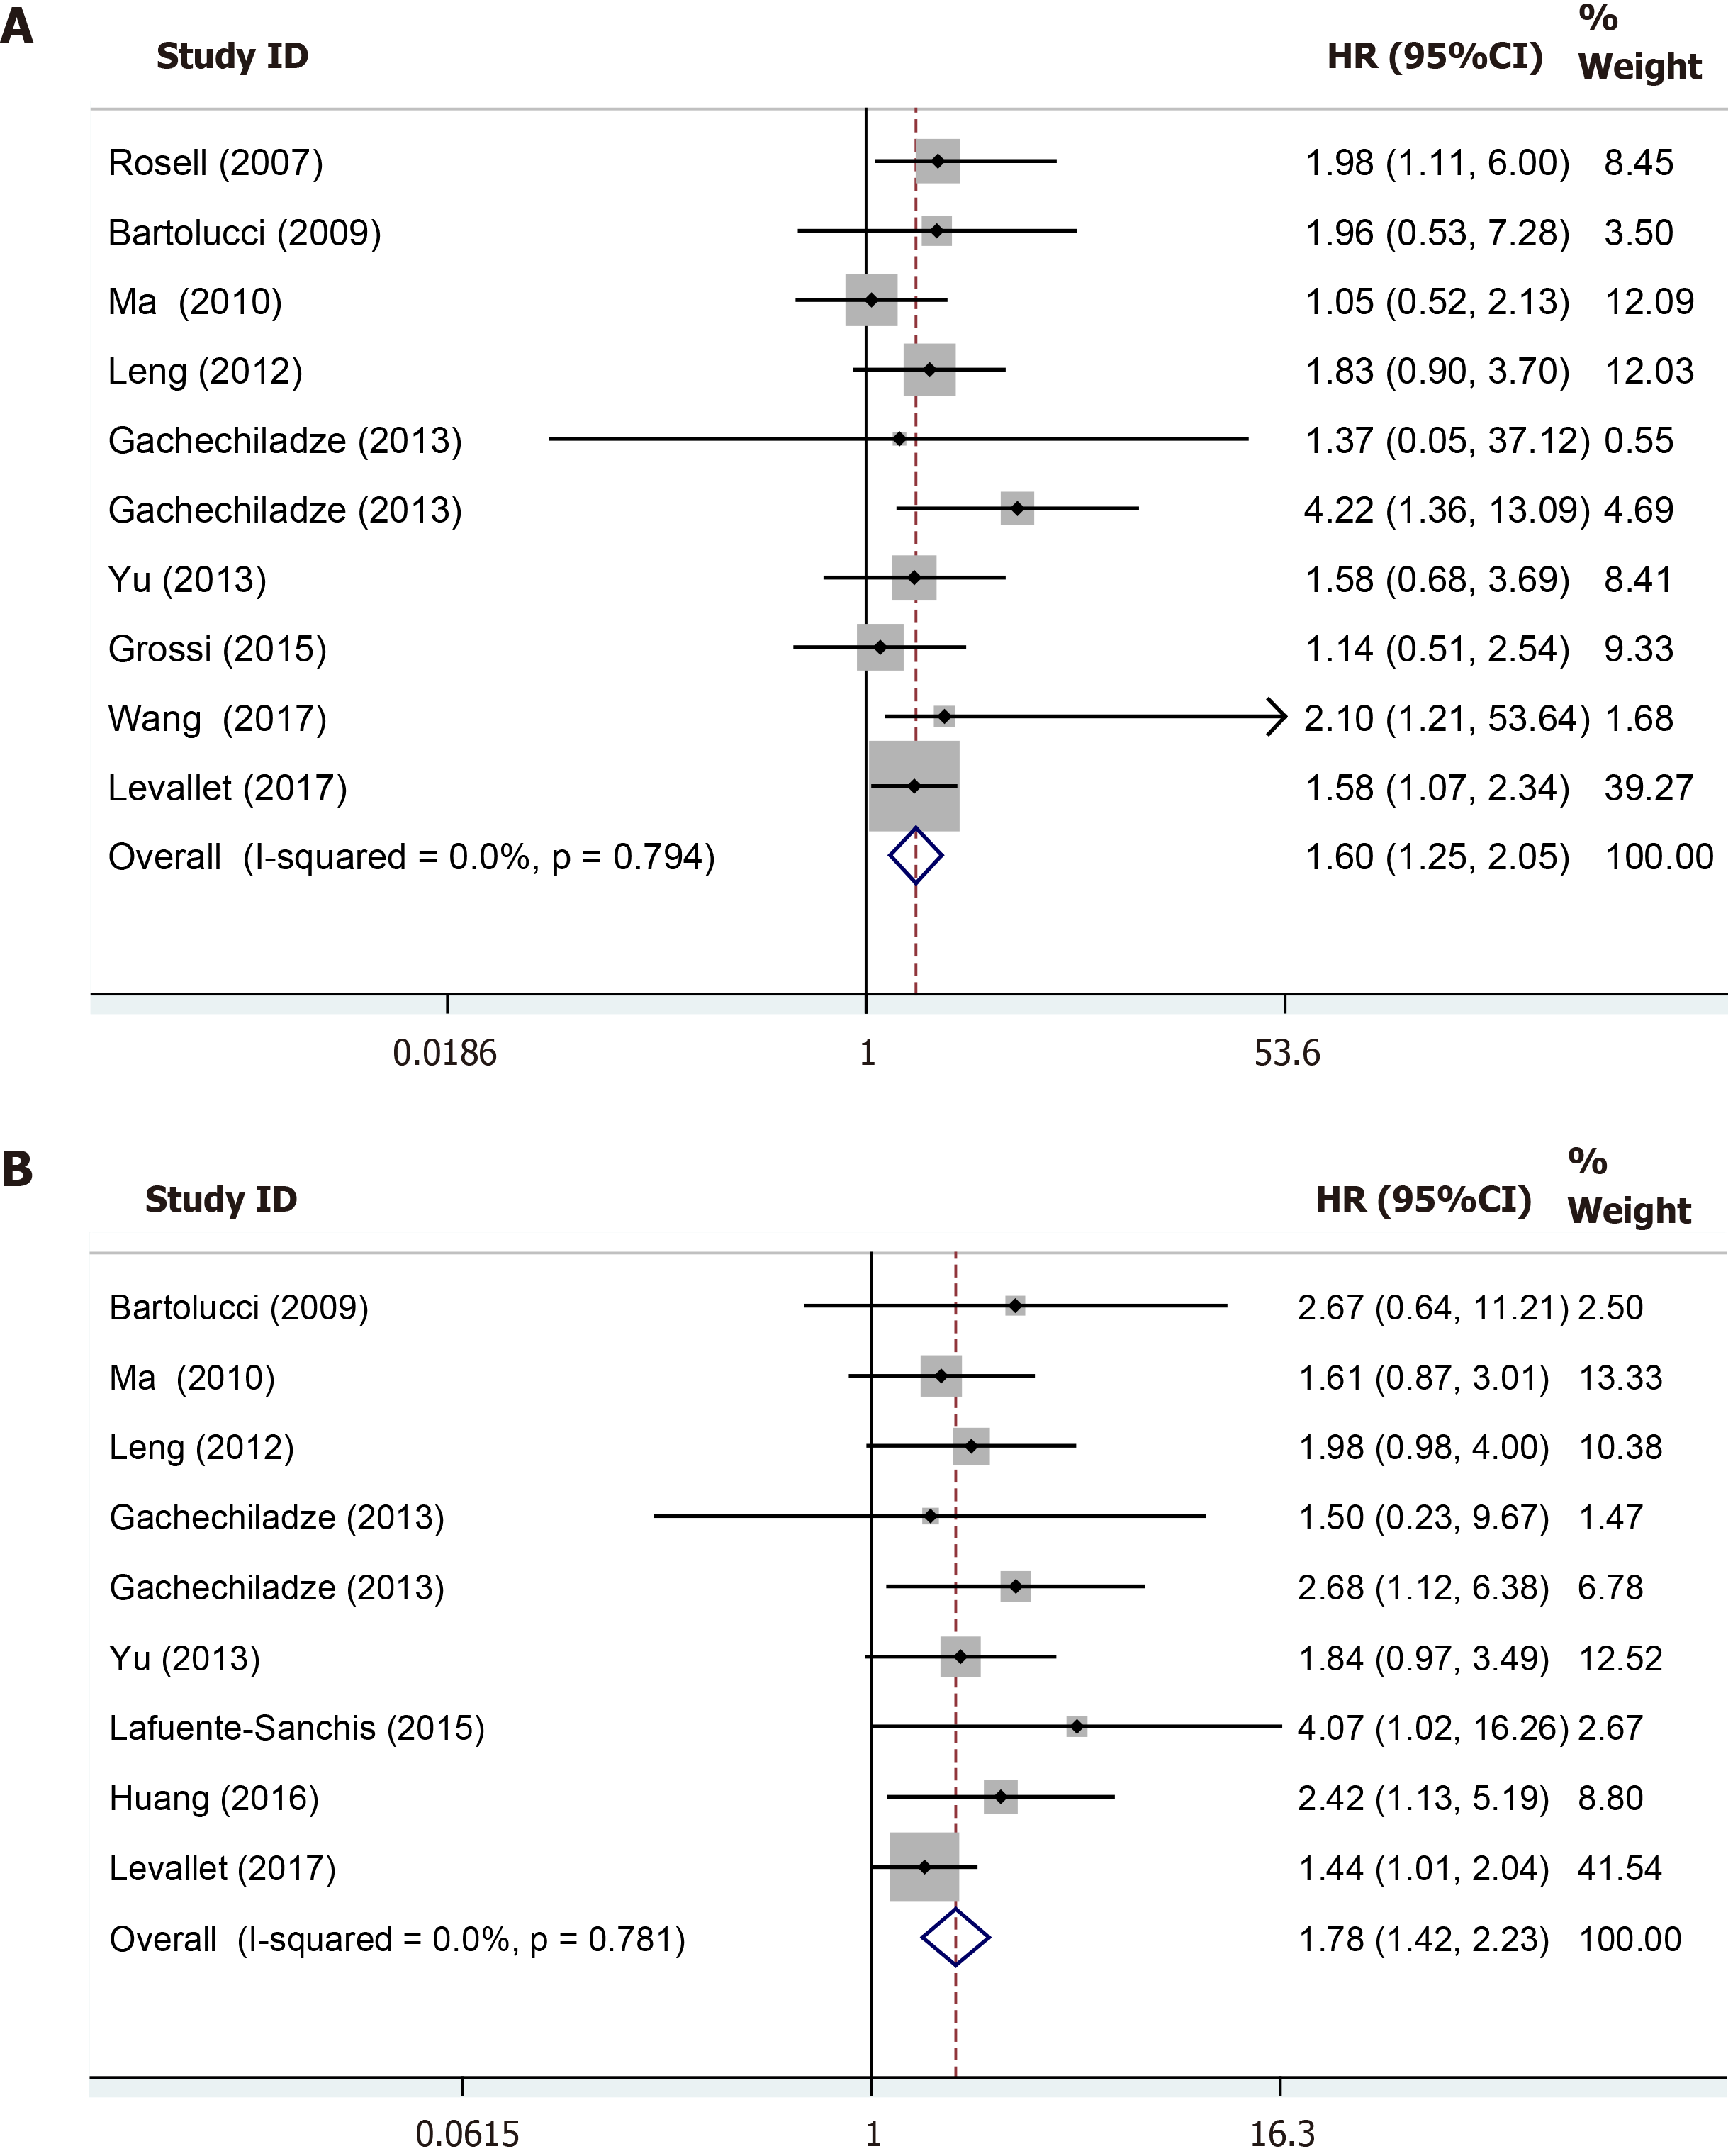
Figure 2 Forest plot of association of breast cancer susceptibility gene 1 expression with overall survival and disease-free survival.
A: Association between breast cancer susceptibility gene 1 (BRCA1) expression and overall survival; B: Association between BRCA1 expression and disease-free survival.
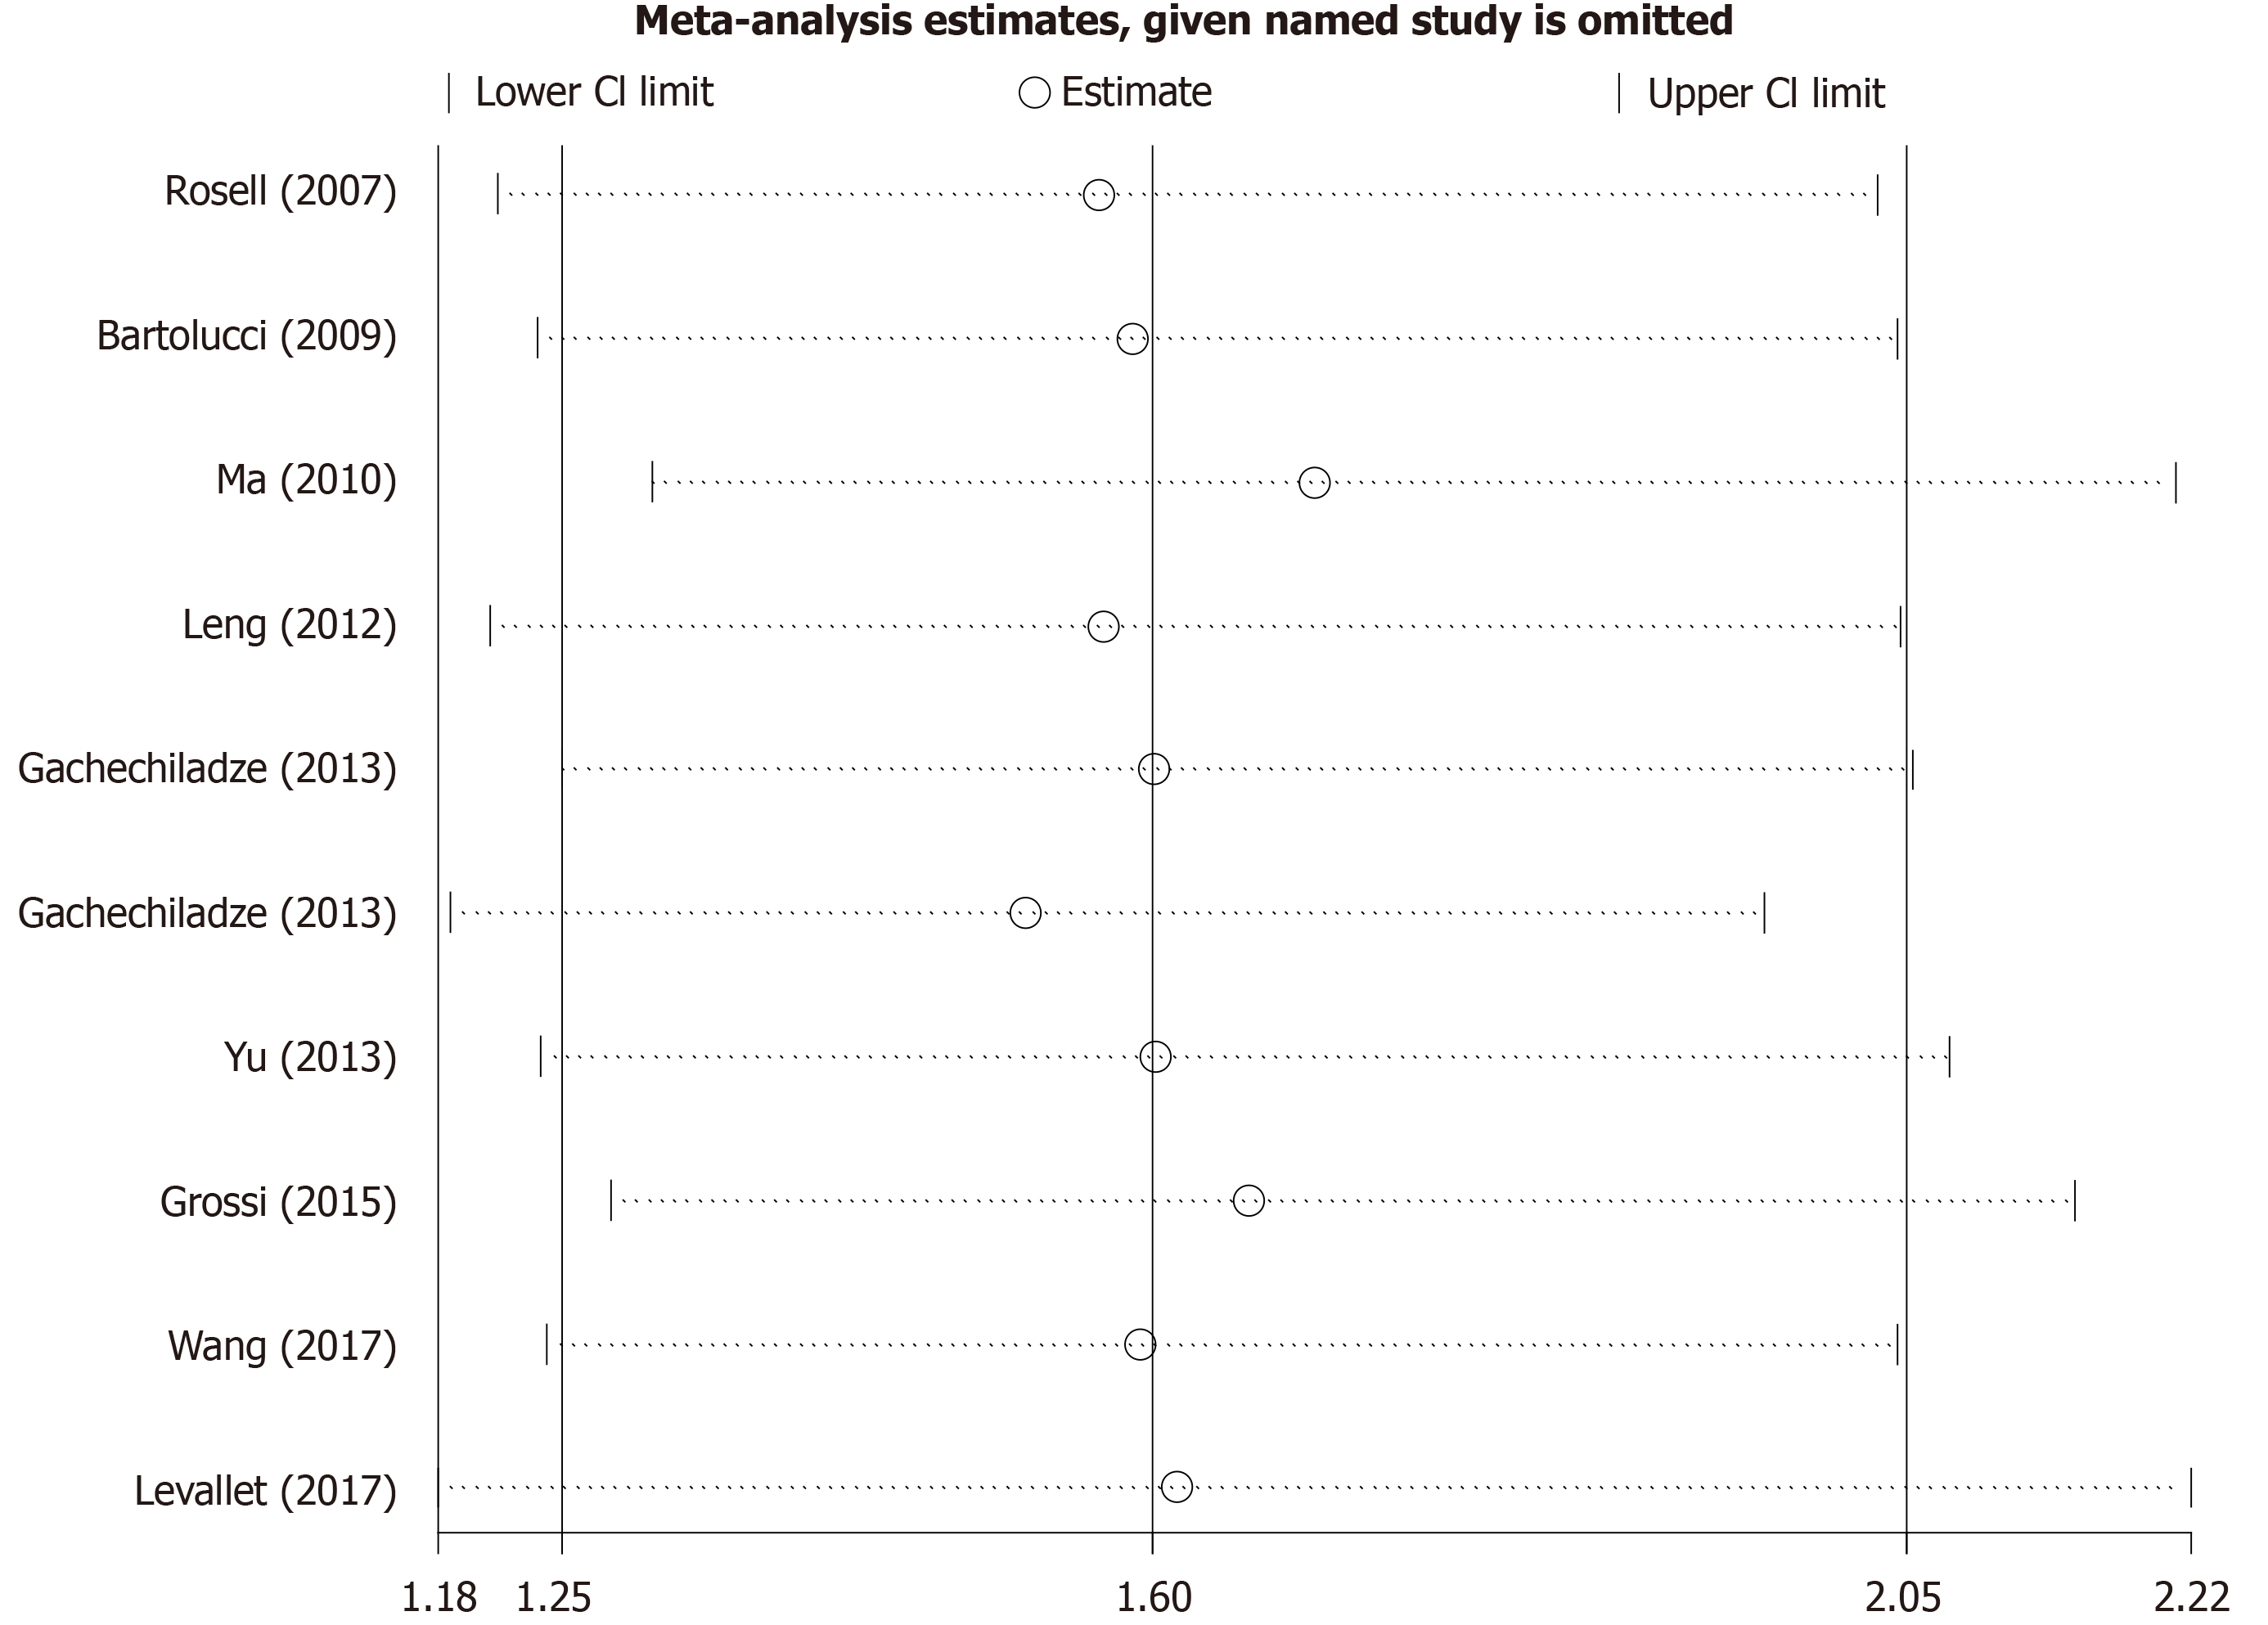
Figure 3 Sensitivity analysis of association between breast cancer susceptibility gene 1 expression and overall survival.
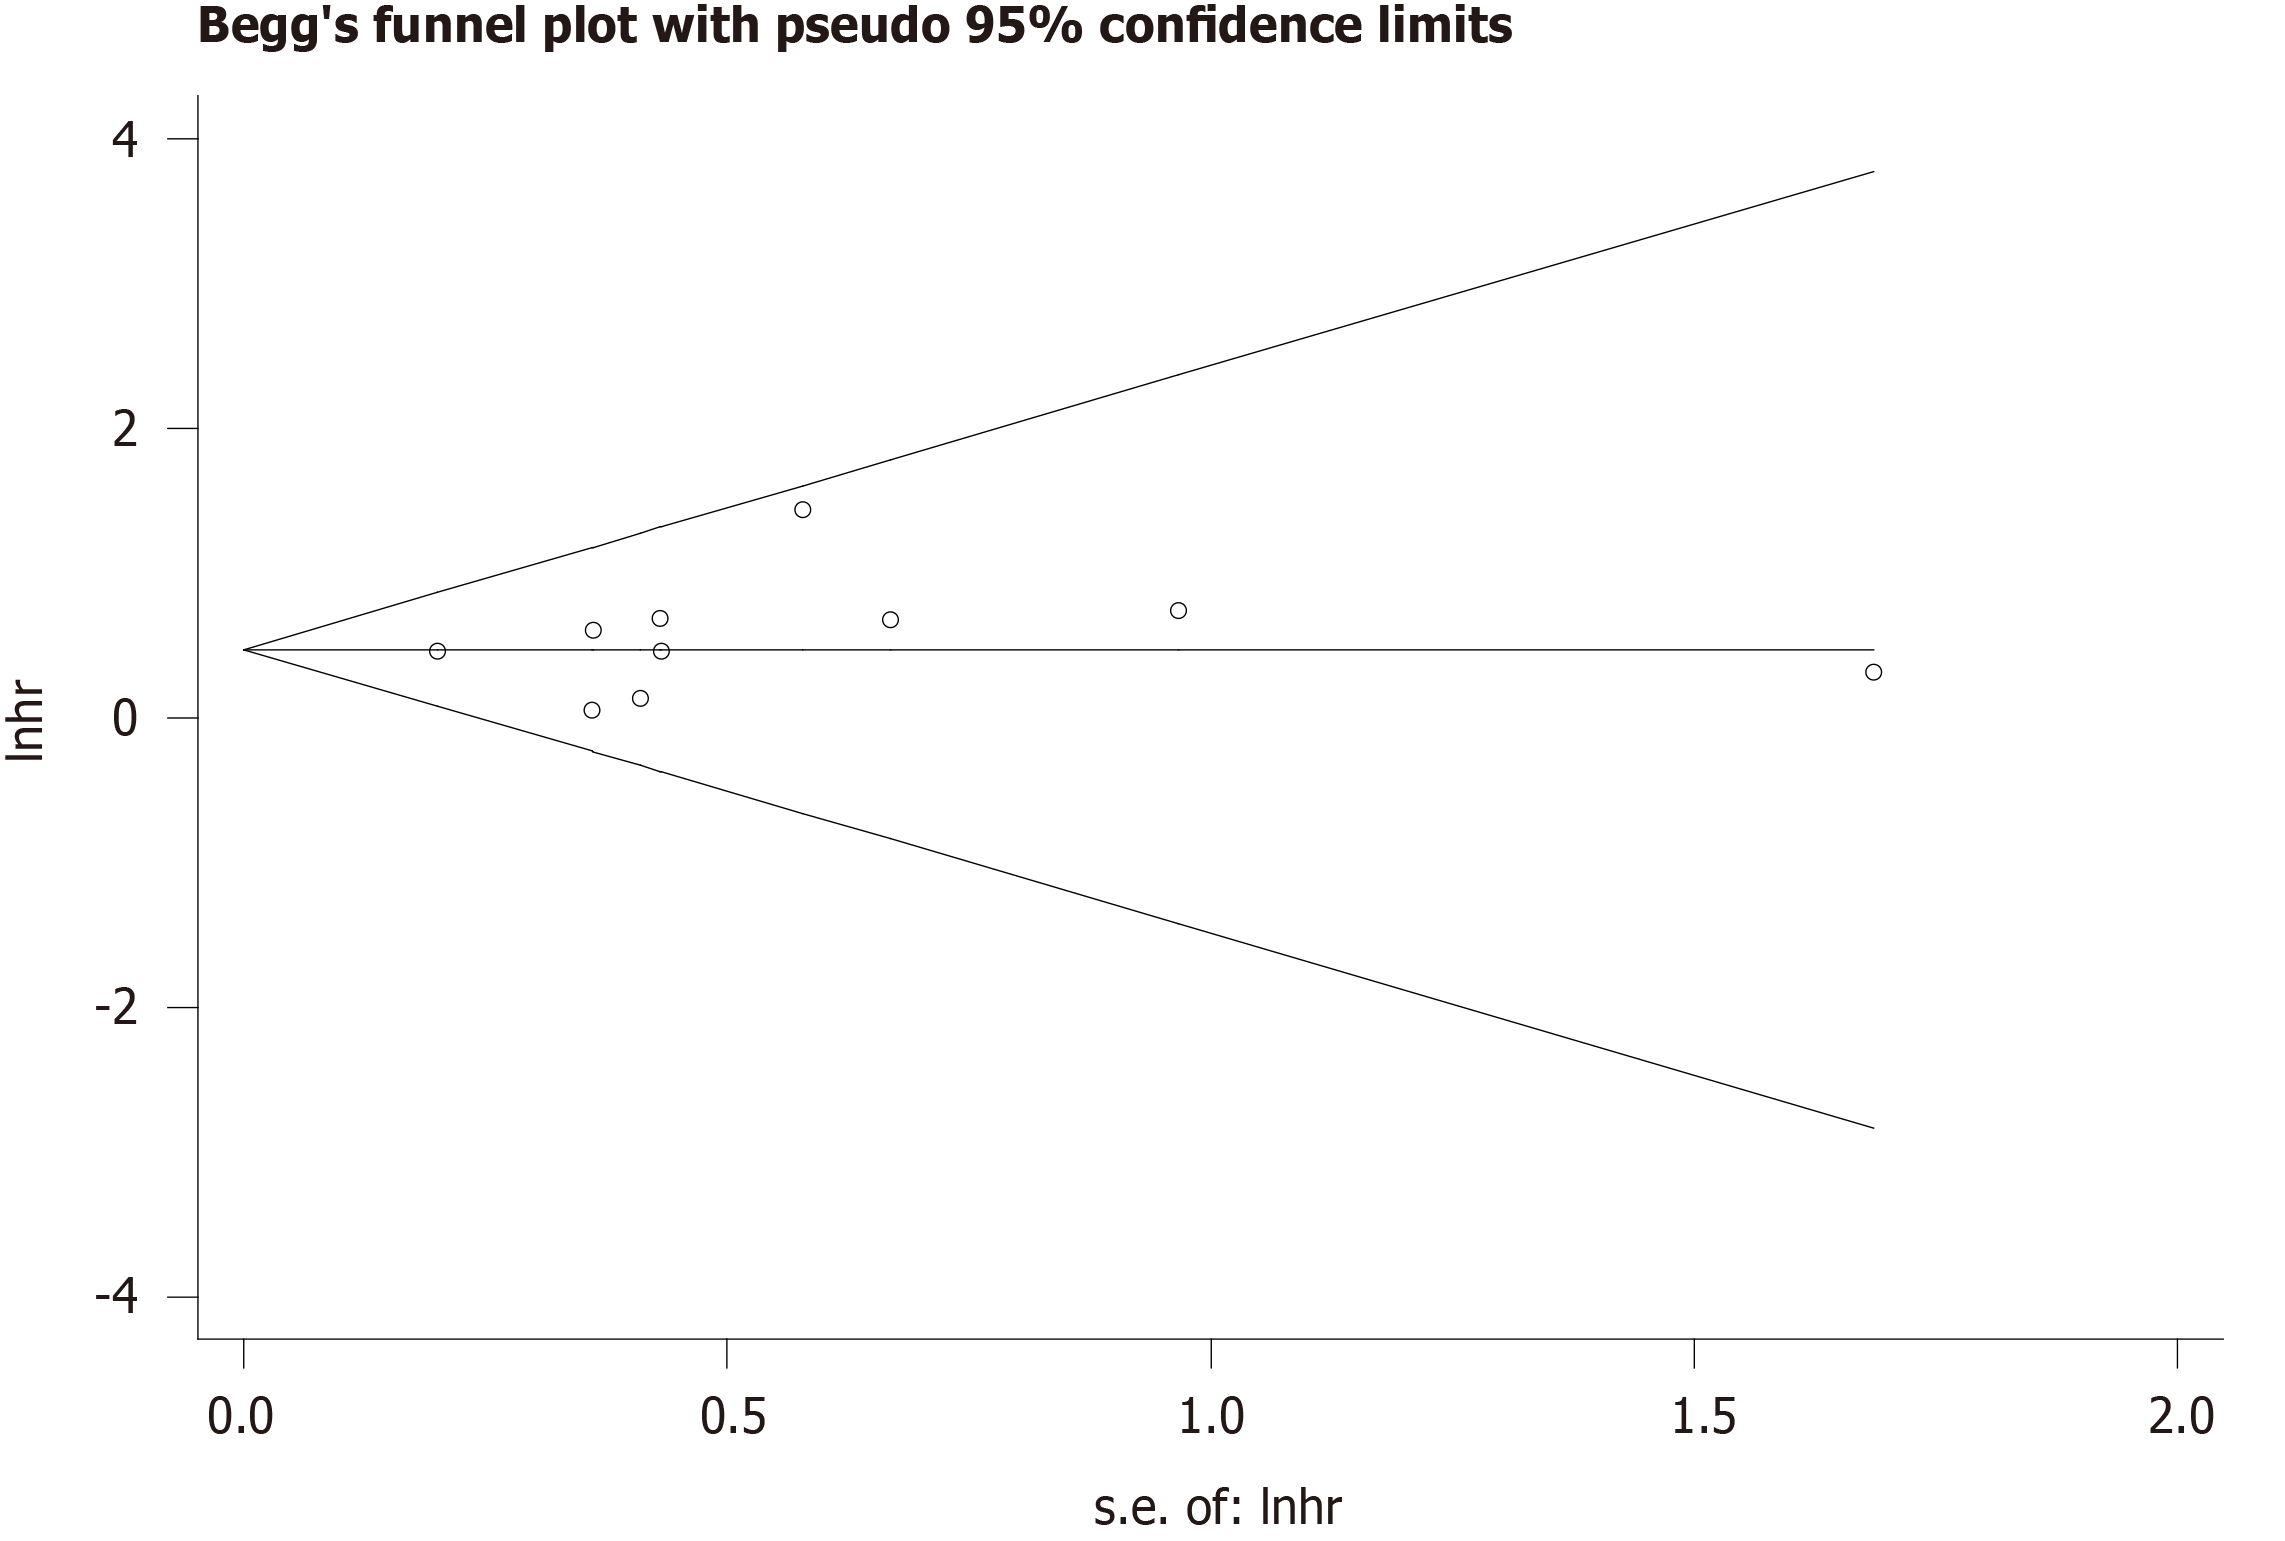
Figure 4 Begg’s funnel plot of association between breast cancer susceptibility gene 1 expression and overall survival.
- Citation: Gao Y, Luo XD, Yang XL, Tu D. Clinical significance of breast cancer susceptibility gene 1 expression in resected non-small cell lung cancer: A meta-analysis . World J Clin Cases 2021; 9(30): 9090-9100
- URL: https://www.wjgnet.com/2307-8960/full/v9/i30/9090.htm
- DOI: https://dx.doi.org/10.12998/wjcc.v9.i30.9090


