Copyright
©The Author(s) 2021.
World J Clin Cases. Oct 26, 2021; 9(30): 9011-9022
Published online Oct 26, 2021. doi: 10.12998/wjcc.v9.i30.9011
Published online Oct 26, 2021. doi: 10.12998/wjcc.v9.i30.9011
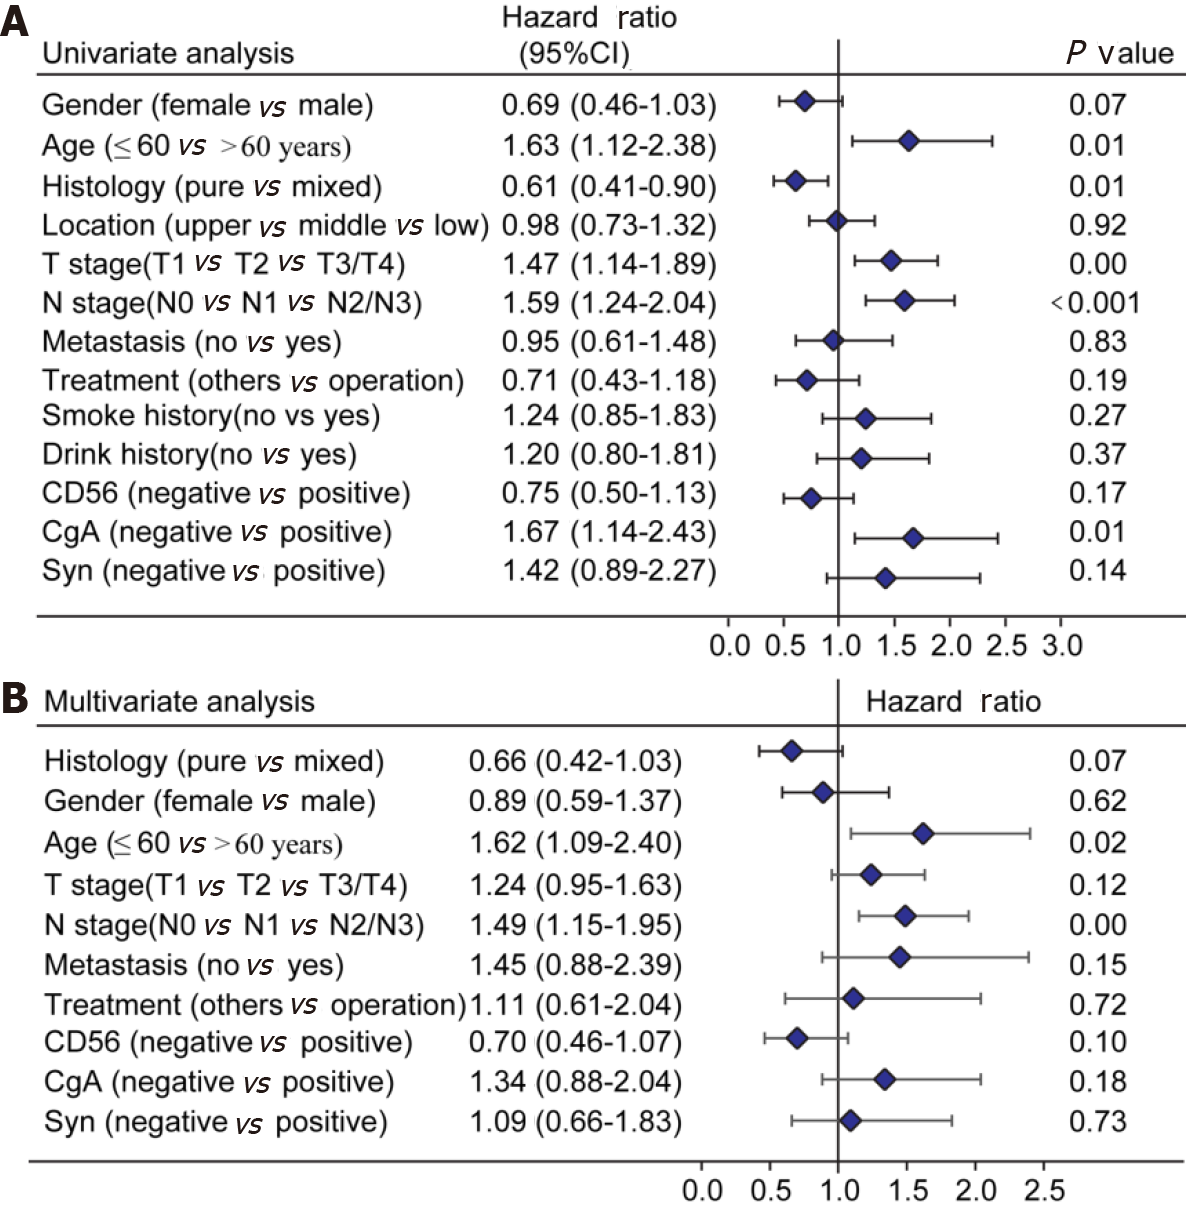
Figure 1 Survival analysis in the primary cohort.
A: Univariate analysis in the primary cohort; B: Multivariate analysis in the primary cohort. T: Tumor invasion depth; N: Number of positive lymph nodes; CD56: Neuronal cell adhesion molecule 56; CgA: Chromogranin A; Syn: Synaptophysin.
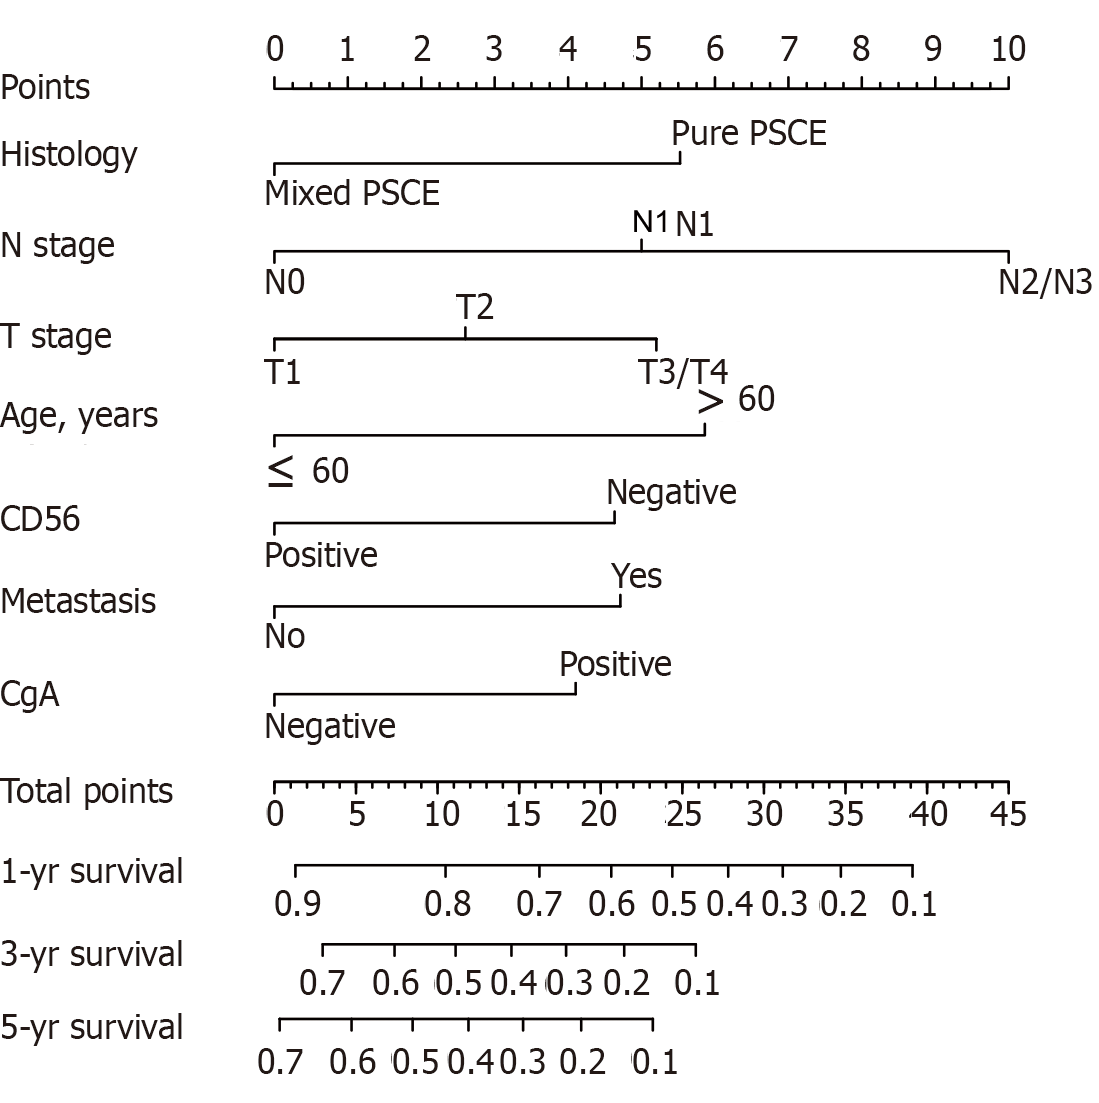
Figure 2 Nomogram model for predicting the 1-, 3-, and 5-year overall survival in primary small cell carcinoma of the esophagus patients.
N: Number of positive lymph nodes; T: Tumor invasion depth; CD56: Neuronal cell adhesion molecule 56; CgA: Chromogranin A.
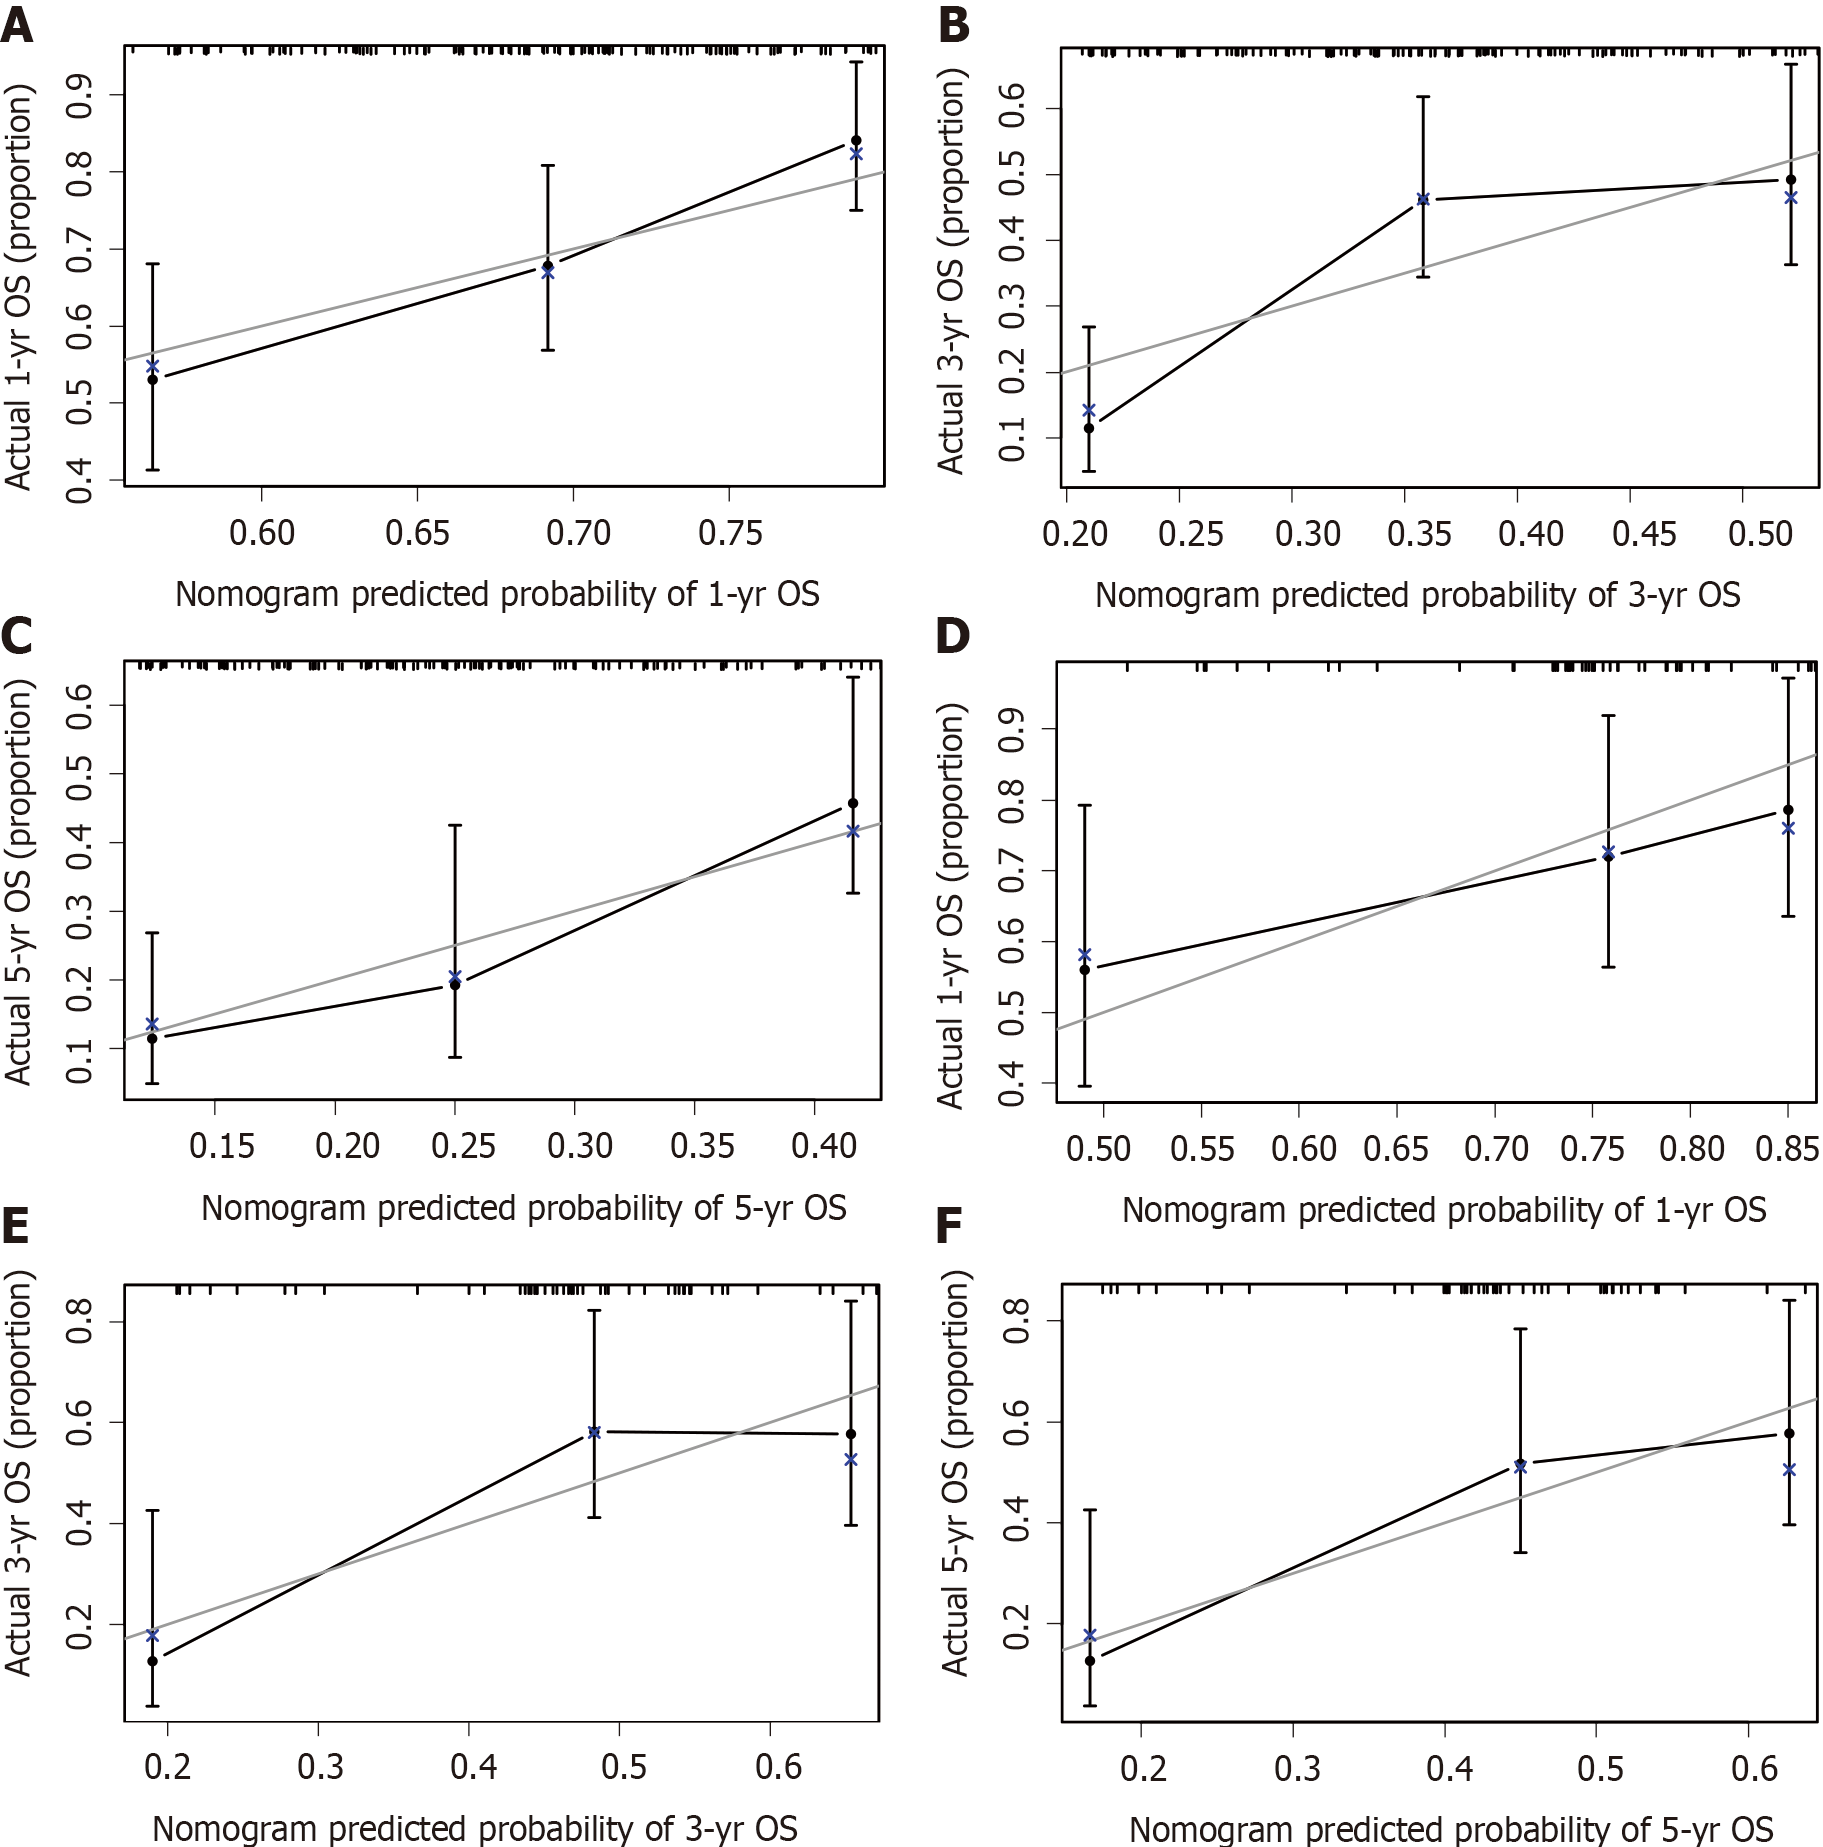
Figure 3 Calibration curves for predicting overall survival at (A) 1 year, (B) 3 years, and (C) 5 years in the primary cohort and at (D) 1 year, (E) 3 years, and (F) 5 years in the validation cohort.
OS: Overall survival.
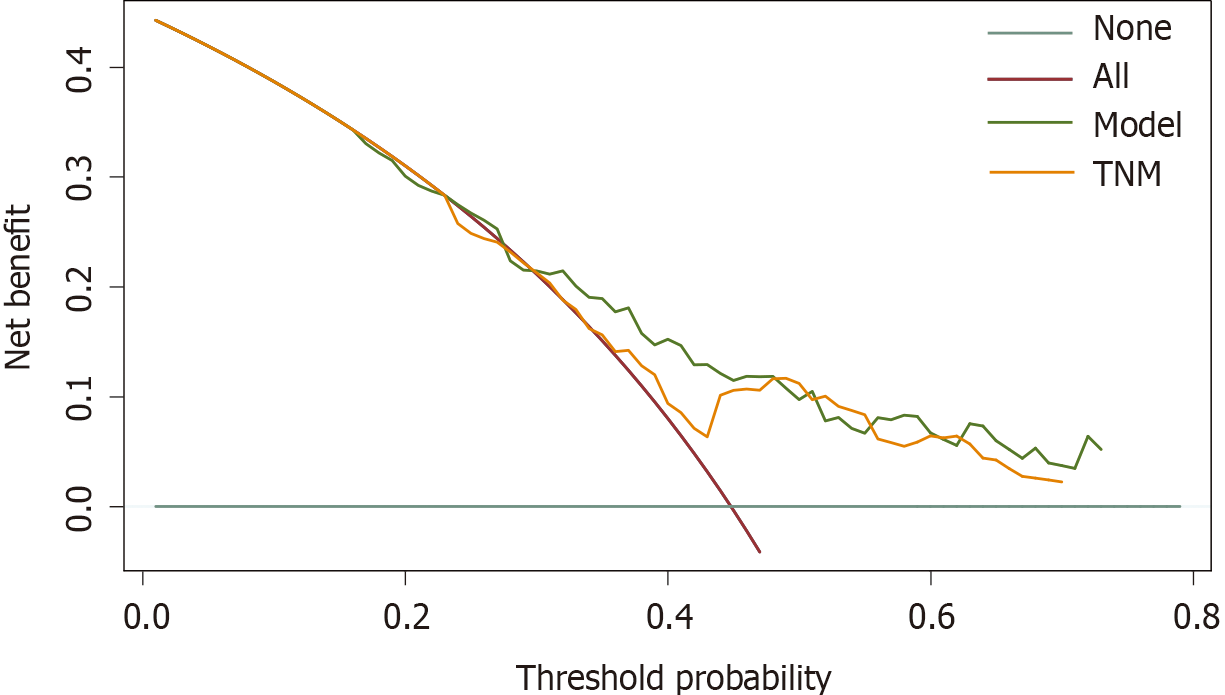
Figure 4 Decision curve analysis for the 18-mo survival predictions in primary small cell carcinoma of the esophagus patients.
TNM: Tumor node metastasis.
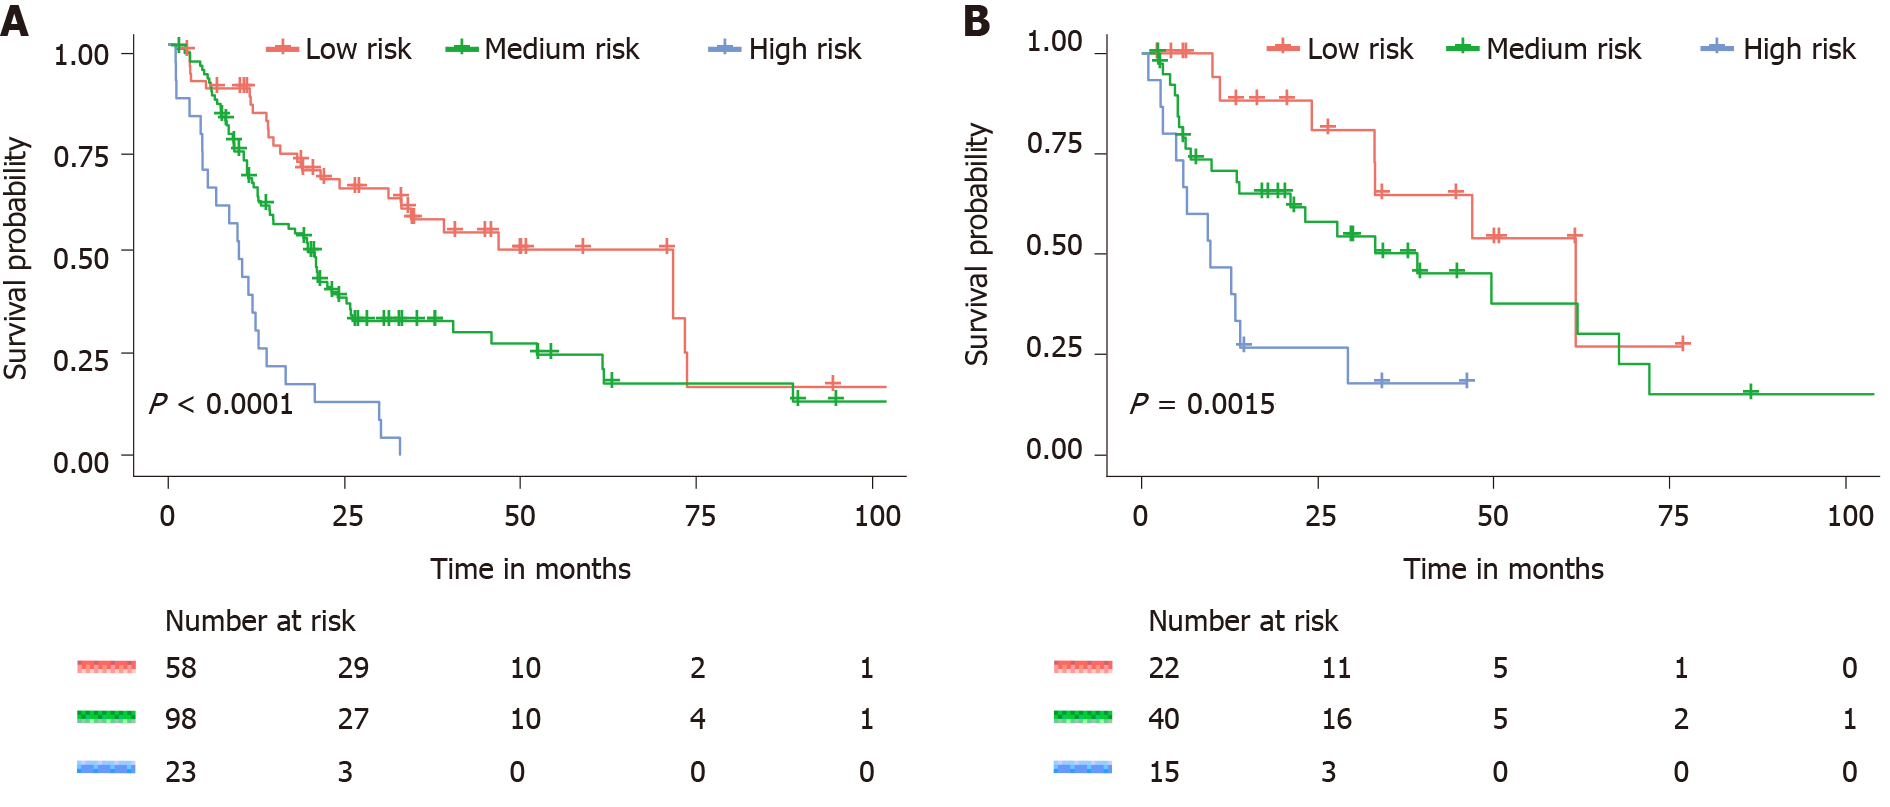
Figure 5 Kaplan–Meier curves for all three groups based on the nomogram prediction.
A: Kaplan–Meier curves for all three groups in the primary cohort. B: Kaplan–Meier curves for all three groups in the validation cohort.
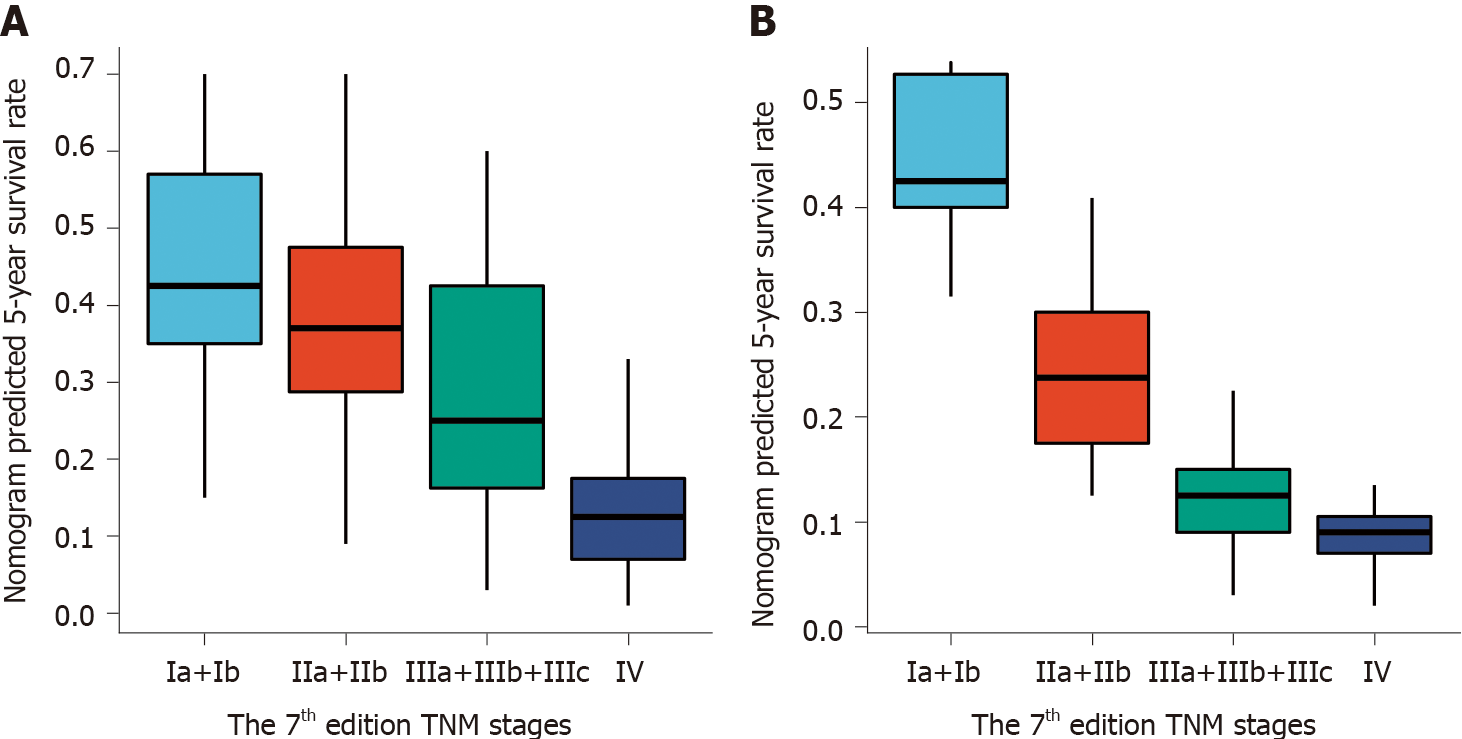
Figure 6 Distribution of the nomogram predicted 5-year survival rate according to 7th edition tumor node metastasis stages.
A: Distribution in the primary cohort; B: Distribution in the validation cohort. TNM: Tumor node metastasis.
- Citation: Zhang DY, Huang GR, Ku JW, Zhao XK, Song X, Xu RH, Han WL, Zhou FY, Wang R, Wei MX, Wang LD. Development and validation of a prognostic nomogram model for Chinese patients with primary small cell carcinoma of the esophagus. World J Clin Cases 2021; 9(30): 9011-9022
- URL: https://www.wjgnet.com/2307-8960/full/v9/i30/9011.htm
- DOI: https://dx.doi.org/10.12998/wjcc.v9.i30.9011


