Copyright
©The Author(s) 2021.
World J Clin Cases. Jan 26, 2021; 9(3): 540-551
Published online Jan 26, 2021. doi: 10.12998/wjcc.v9.i3.540
Published online Jan 26, 2021. doi: 10.12998/wjcc.v9.i3.540
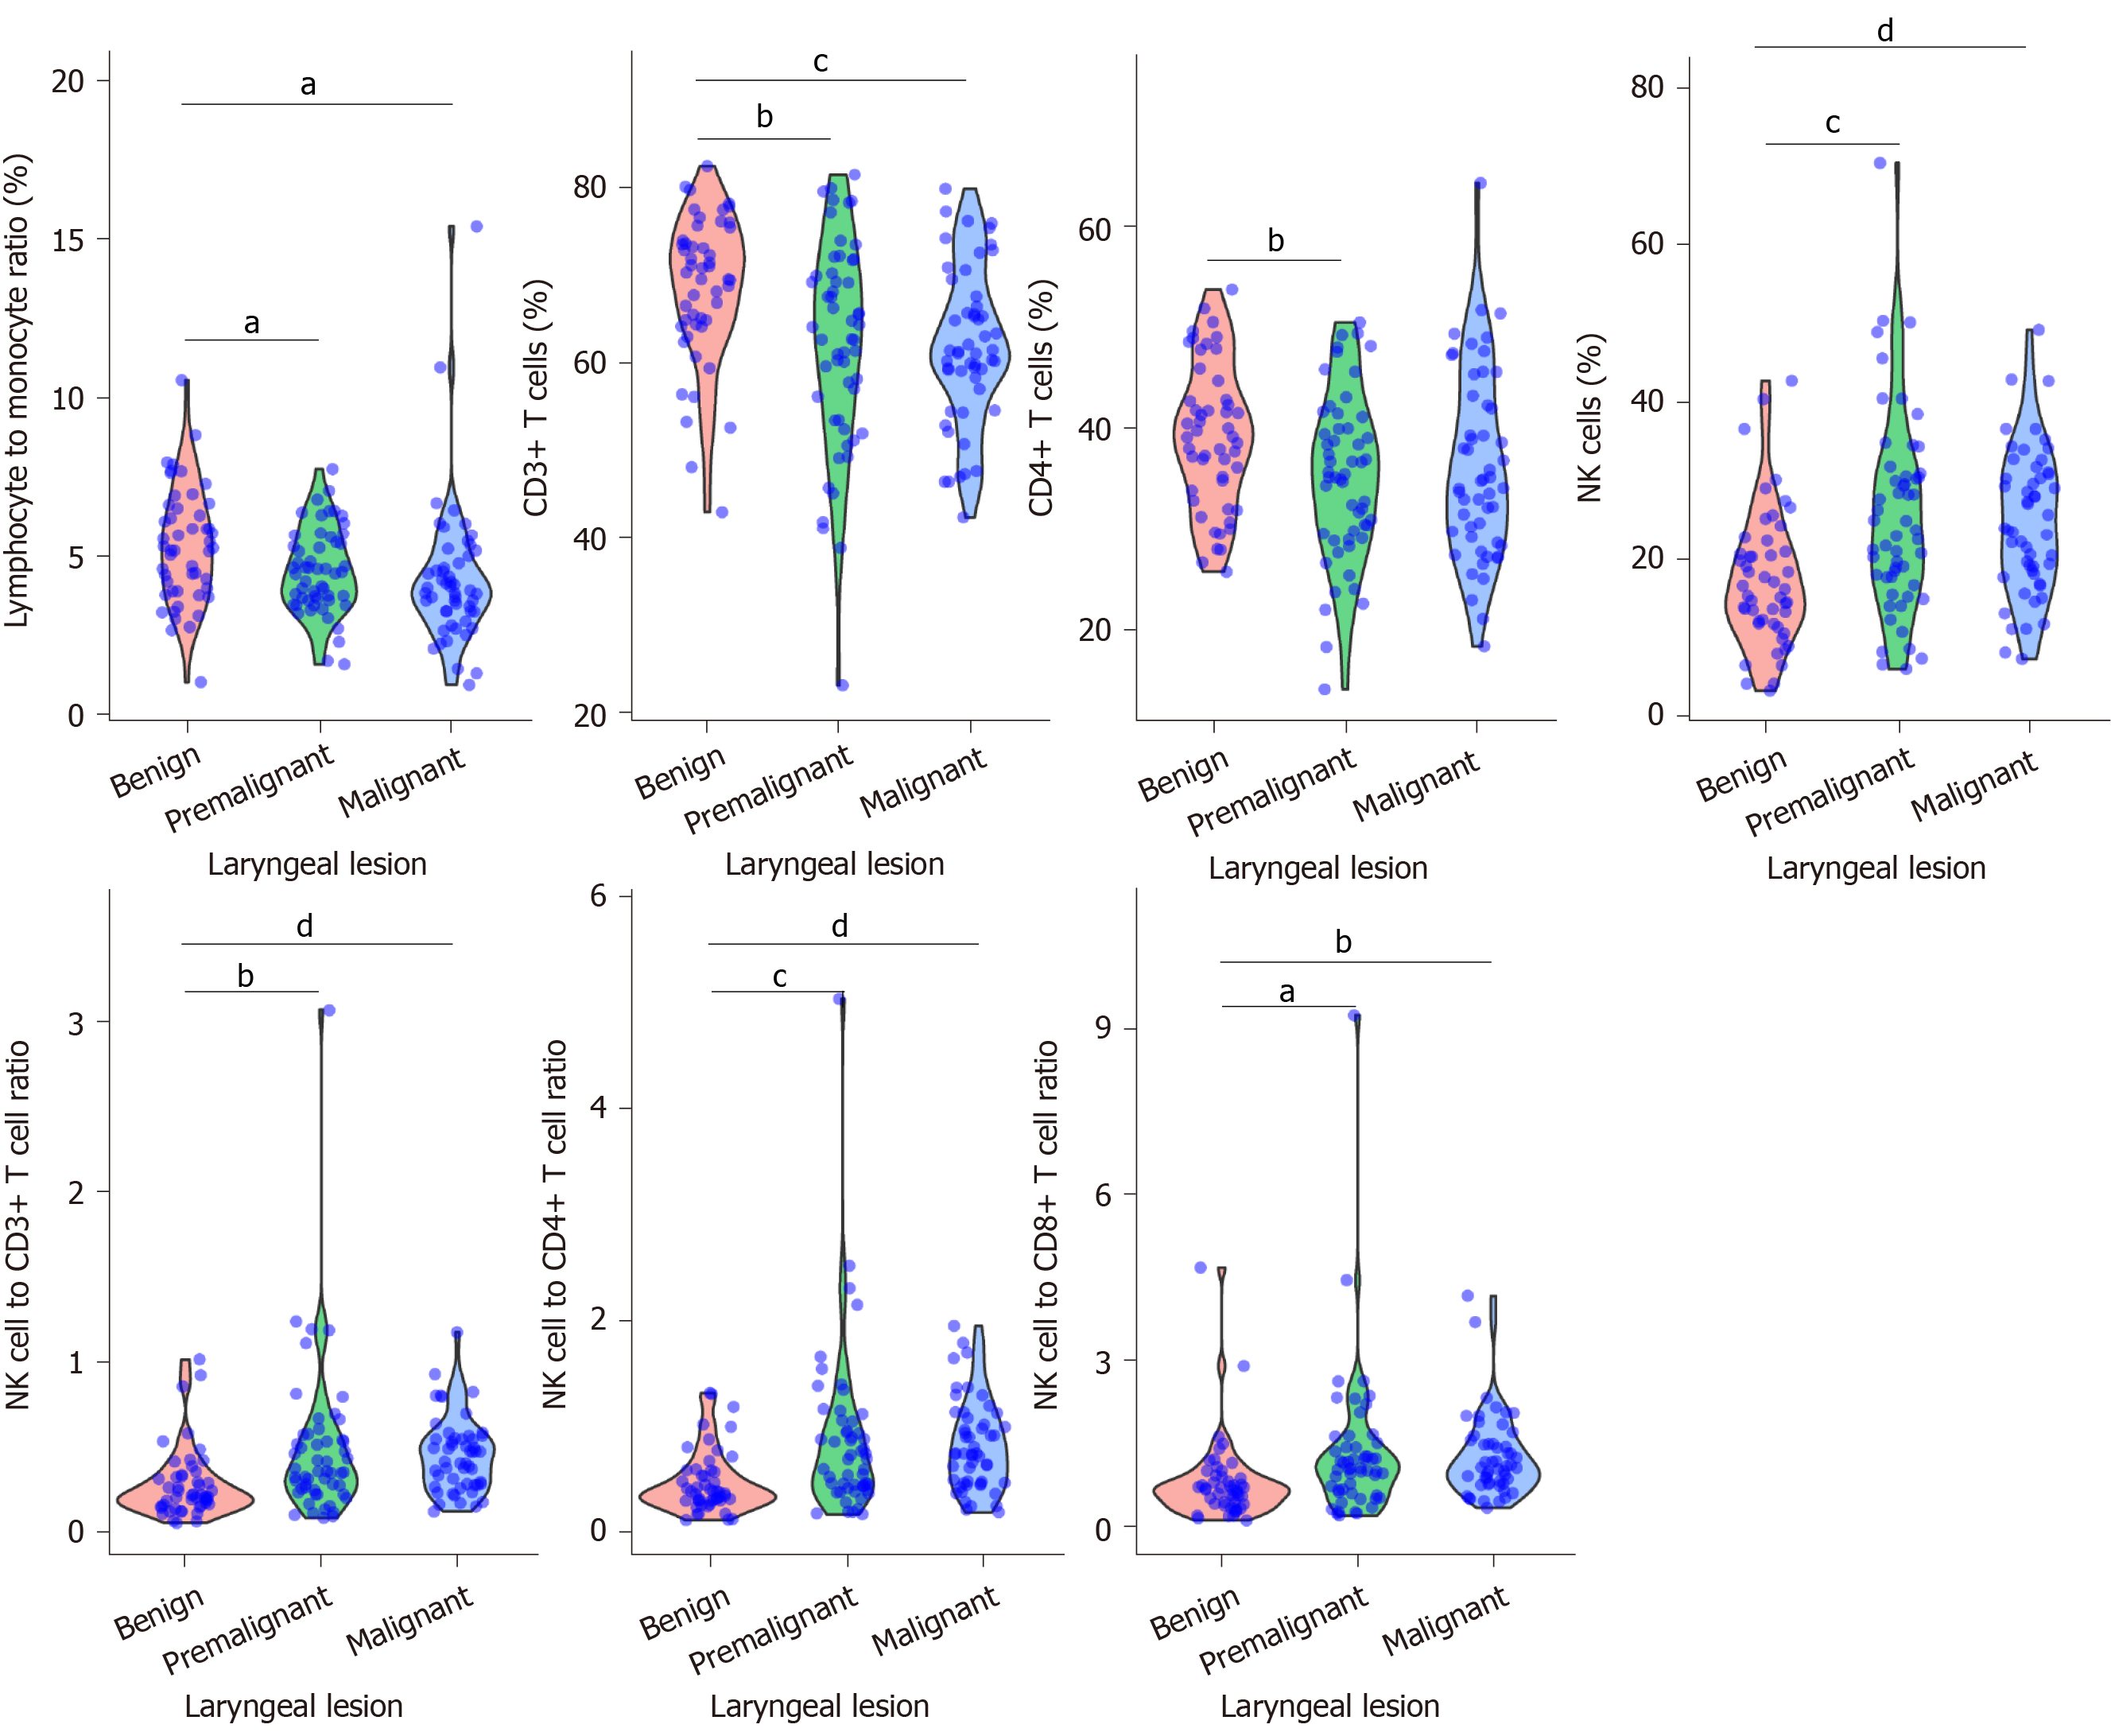
Figure 1 Distribution and level of circulating immune cell parameters shown in violin plot.
The circulating immune cell parameters, including lymphocyte to monocyte ratio, proportions of CD3+ T cells, CD4+ T cells, natural killer (NK) cells, NK cell to CD3+ T cell ratio, NK cell to CD4+ T cell ratio and NK cell to CD8+ T cell ratio, were compared among laryngeal lesions. aP < 0.05; bP < 0.01; cP < 0.001; dP < 0.0001.
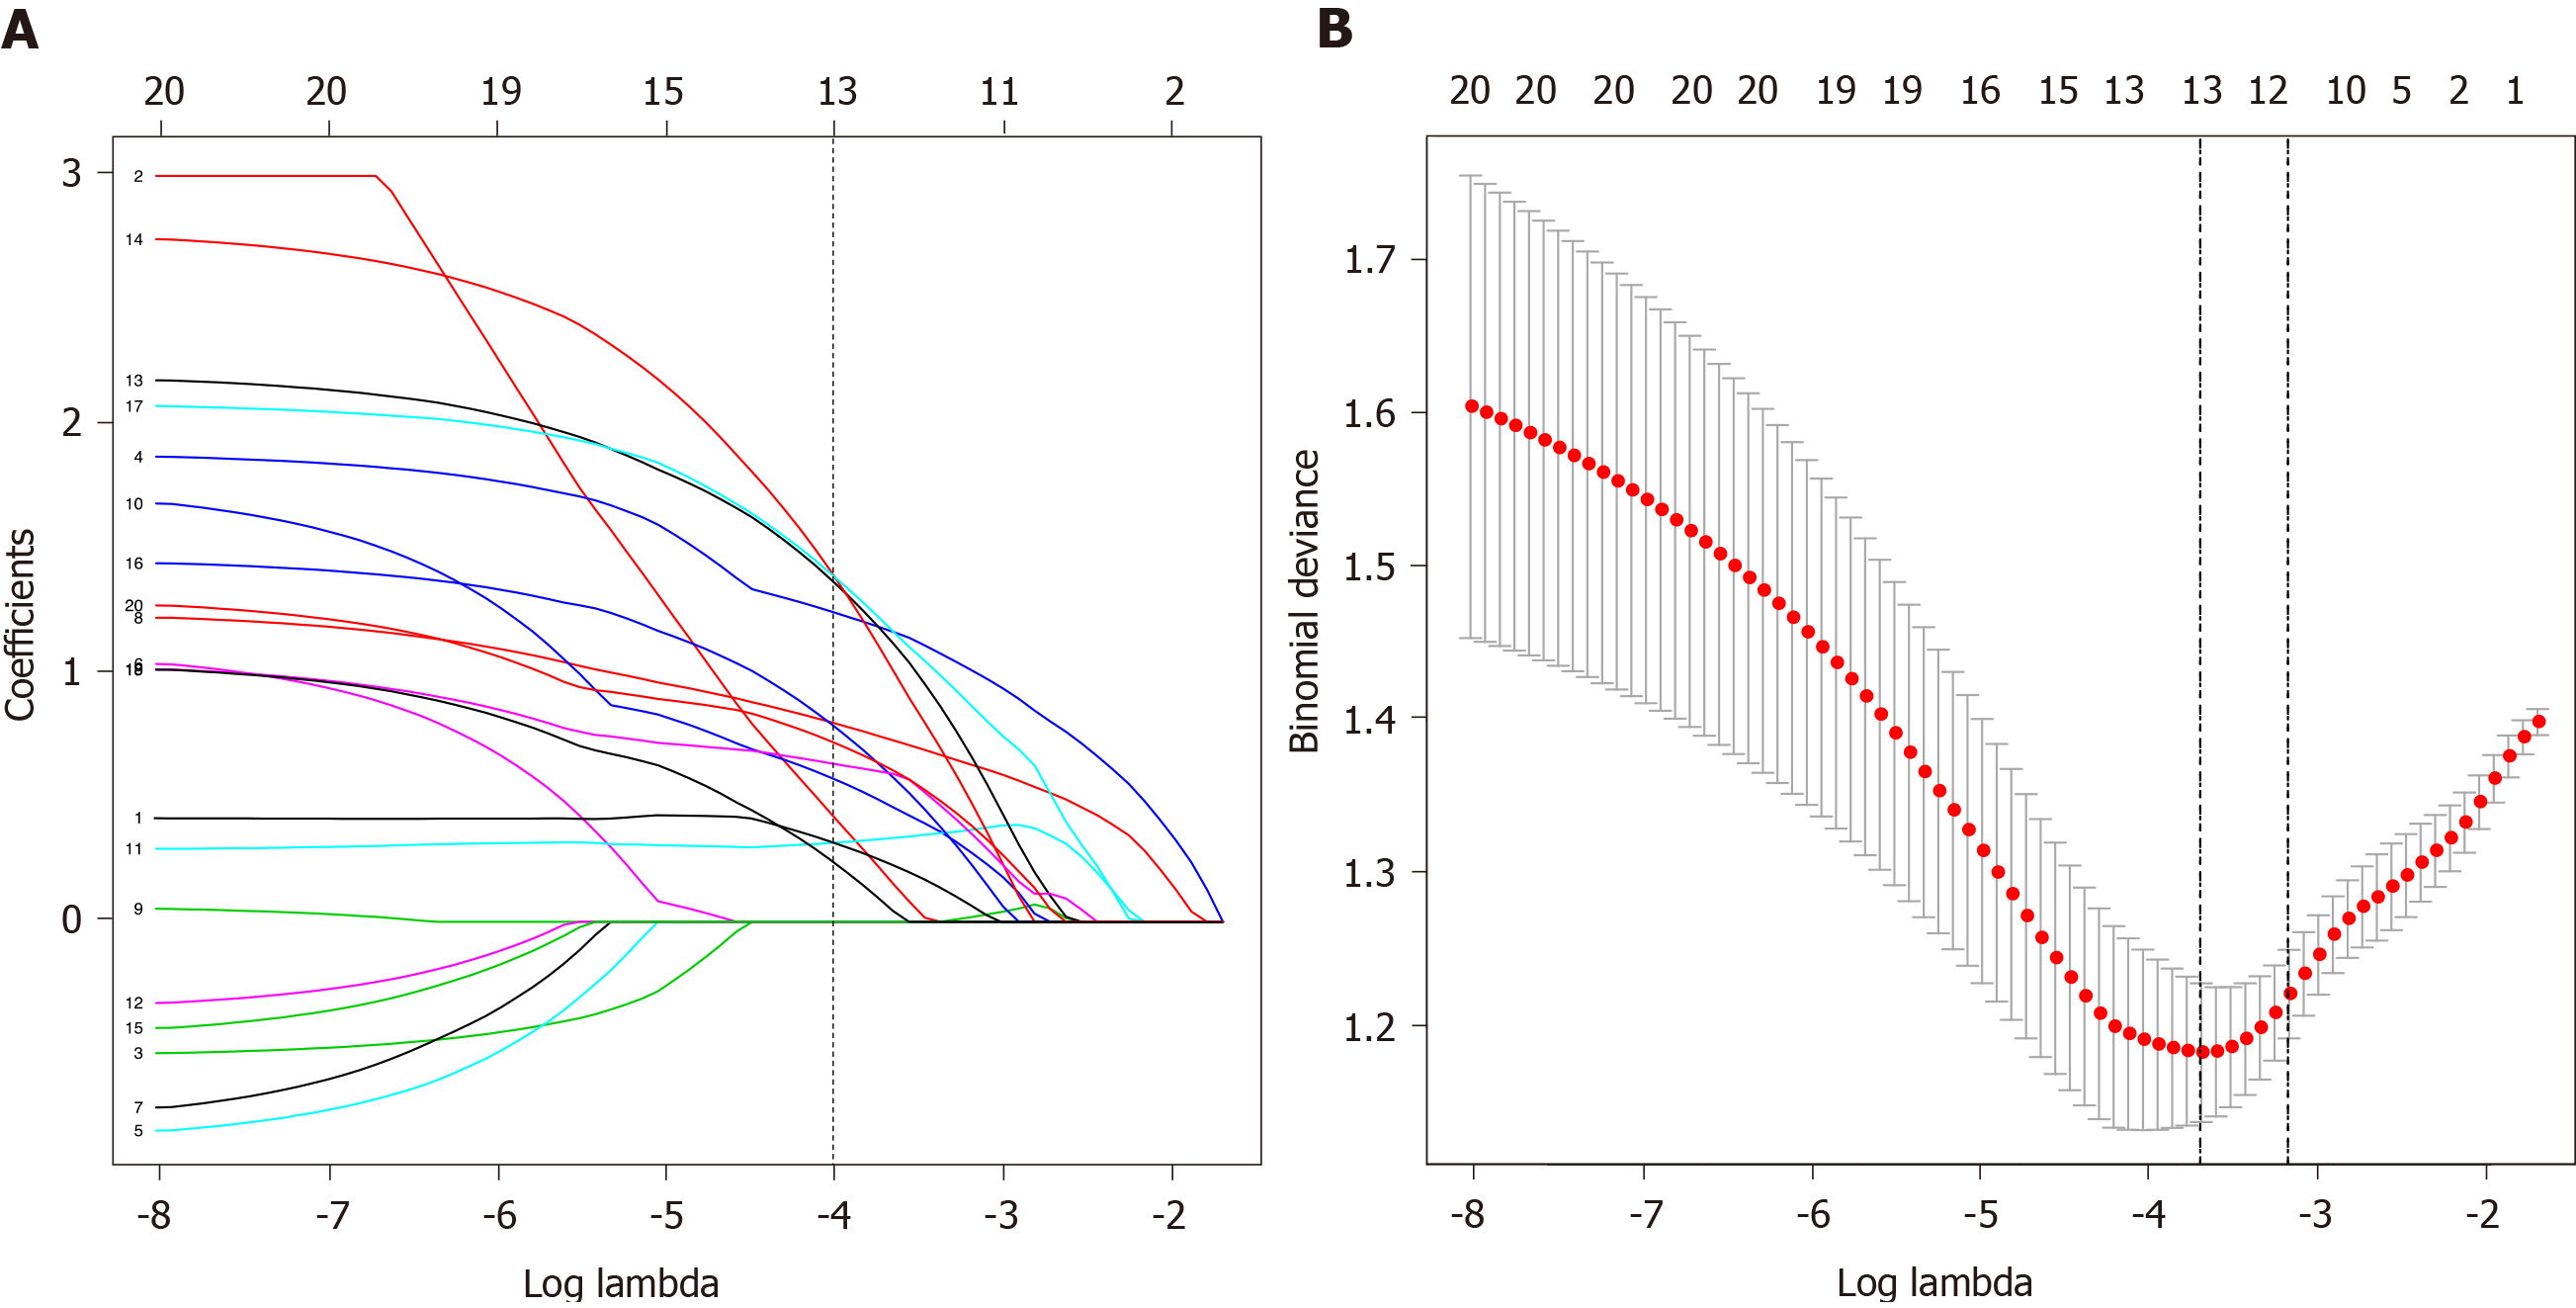
Figure 2 Clinical characteristic and immune feature selection using the least absolute shrinkage and selection operator binary regression model.
A: Least absolute shrinkage and selection operator coefficient profiles of the 20 features. Vertical line was drawn at the value where optimal lambda resulted in 13 features with nonzero coefficients; B: Feature selection in the least absolute shrinkage and selection operator method via minimum criteria. Dotted vertical lines were drawn at the optimal values by using the minimum criteria.
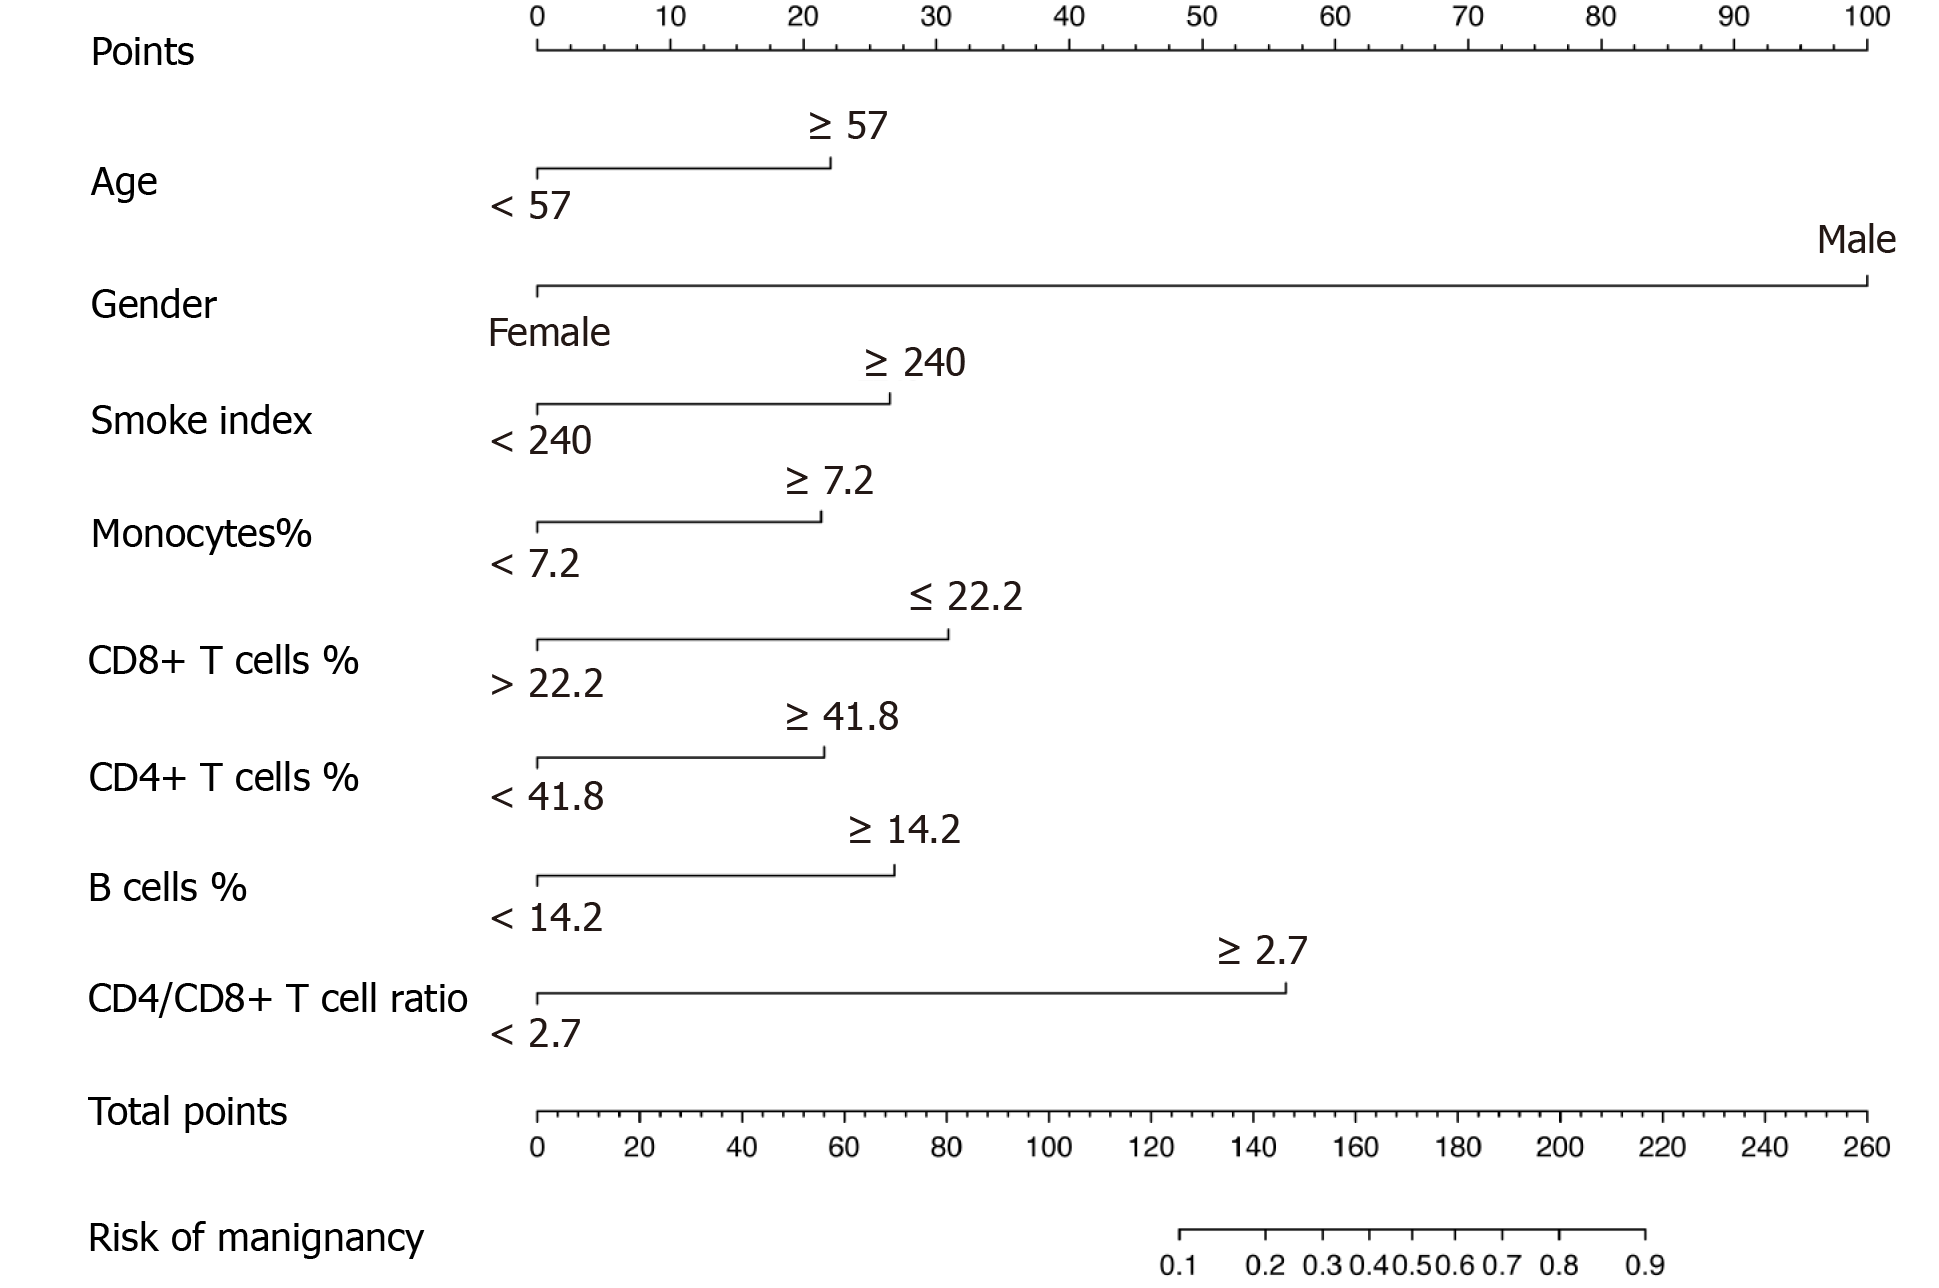
Figure 3 Development of the nomogram for malignancy prediction of laryngeal neoplasm.
The nomogram incorporated the predictors including gender, age, smoke index, proportion of monocytes, CD8+ T cells, CD4+ T cells and B cells, and CD4/CD8+ T cell ratio.
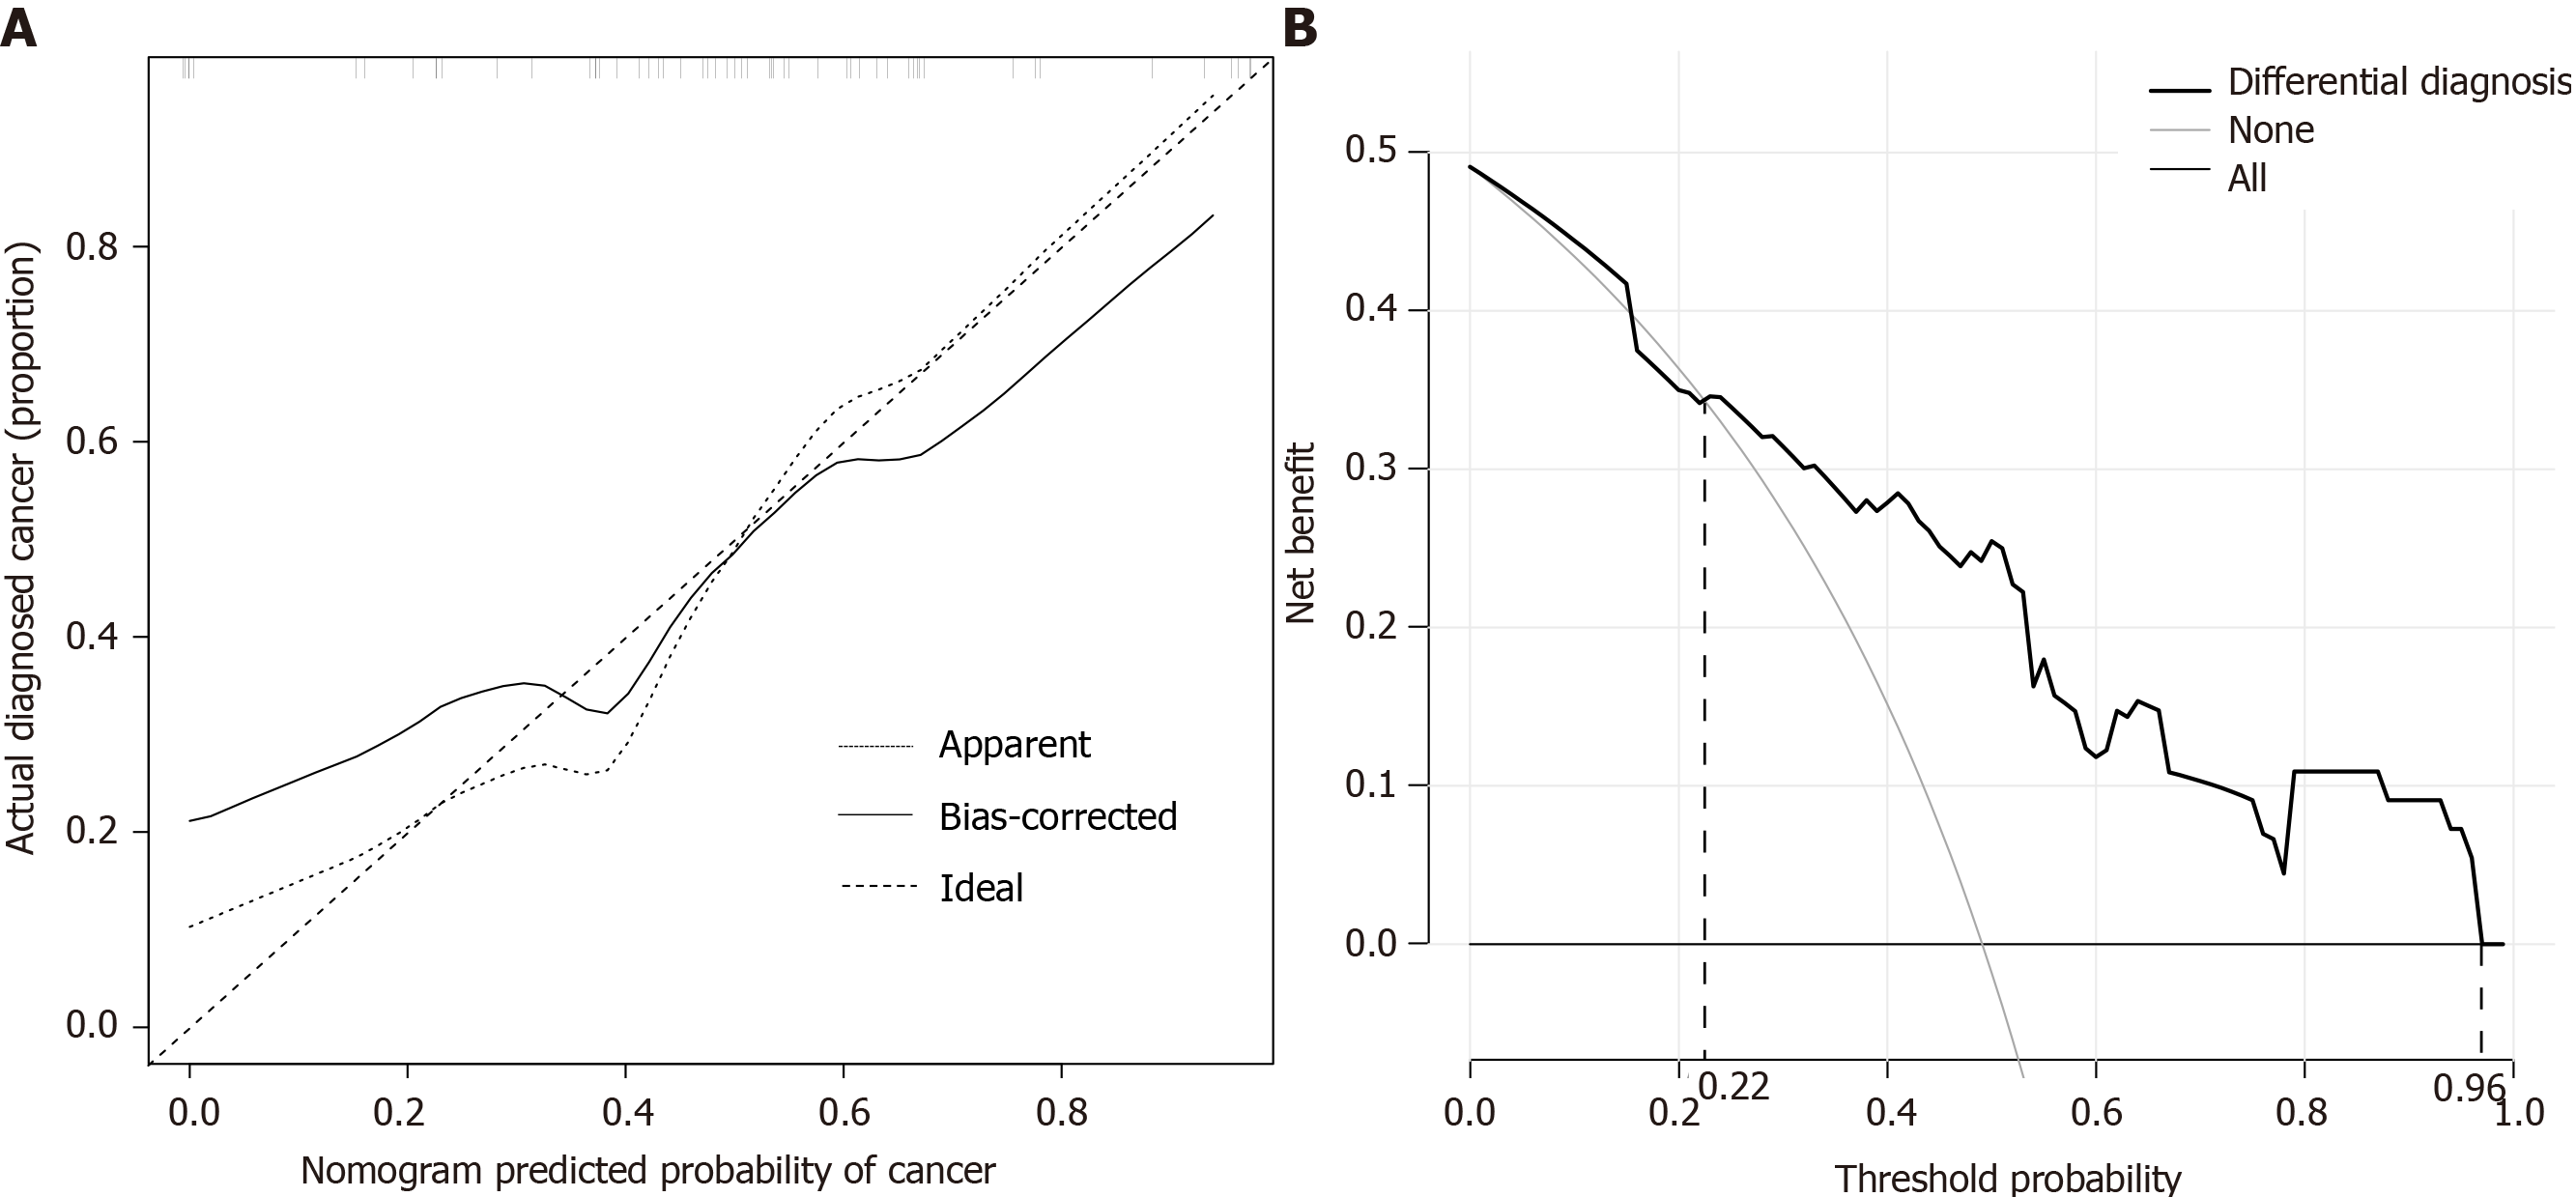
Figure 4 Validation of nomogram and assessment of clinical utility.
A: Calibration curve of the nomogram in the validation cohort. The x-axis represents the predicted risk of cancer. The y-axis represents the actual diagnosis of cancer. The diagonal dotted line represents a perfect prediction by an ideal model. The solid line represents the performance of the nomogram, of which a closer fit to the diagonal dotted line represents a perfect prediction; B: Decision curve analysis for the nomogram in the validation cohort. The y-axis measures the net benefit. The gray line represents the assumption that all patients are laryngeal cancer. The thin solid line represents the assumption that no patients are laryngeal cancer. The thick solid line represents the nomogram.
- Citation: Chen M, Fang Y, Yang Y, He PJ, Cheng L, Wu HT. Circulating immune parameters-based nomogram for predicting malignancy in laryngeal neoplasm. World J Clin Cases 2021; 9(3): 540-551
- URL: https://www.wjgnet.com/2307-8960/full/v9/i3/540.htm
- DOI: https://dx.doi.org/10.12998/wjcc.v9.i3.540


