Copyright
©The Author(s) 2021.
World J Clin Cases. Sep 16, 2021; 9(26): 7833-7839
Published online Sep 16, 2021. doi: 10.12998/wjcc.v9.i26.7833
Published online Sep 16, 2021. doi: 10.12998/wjcc.v9.i26.7833
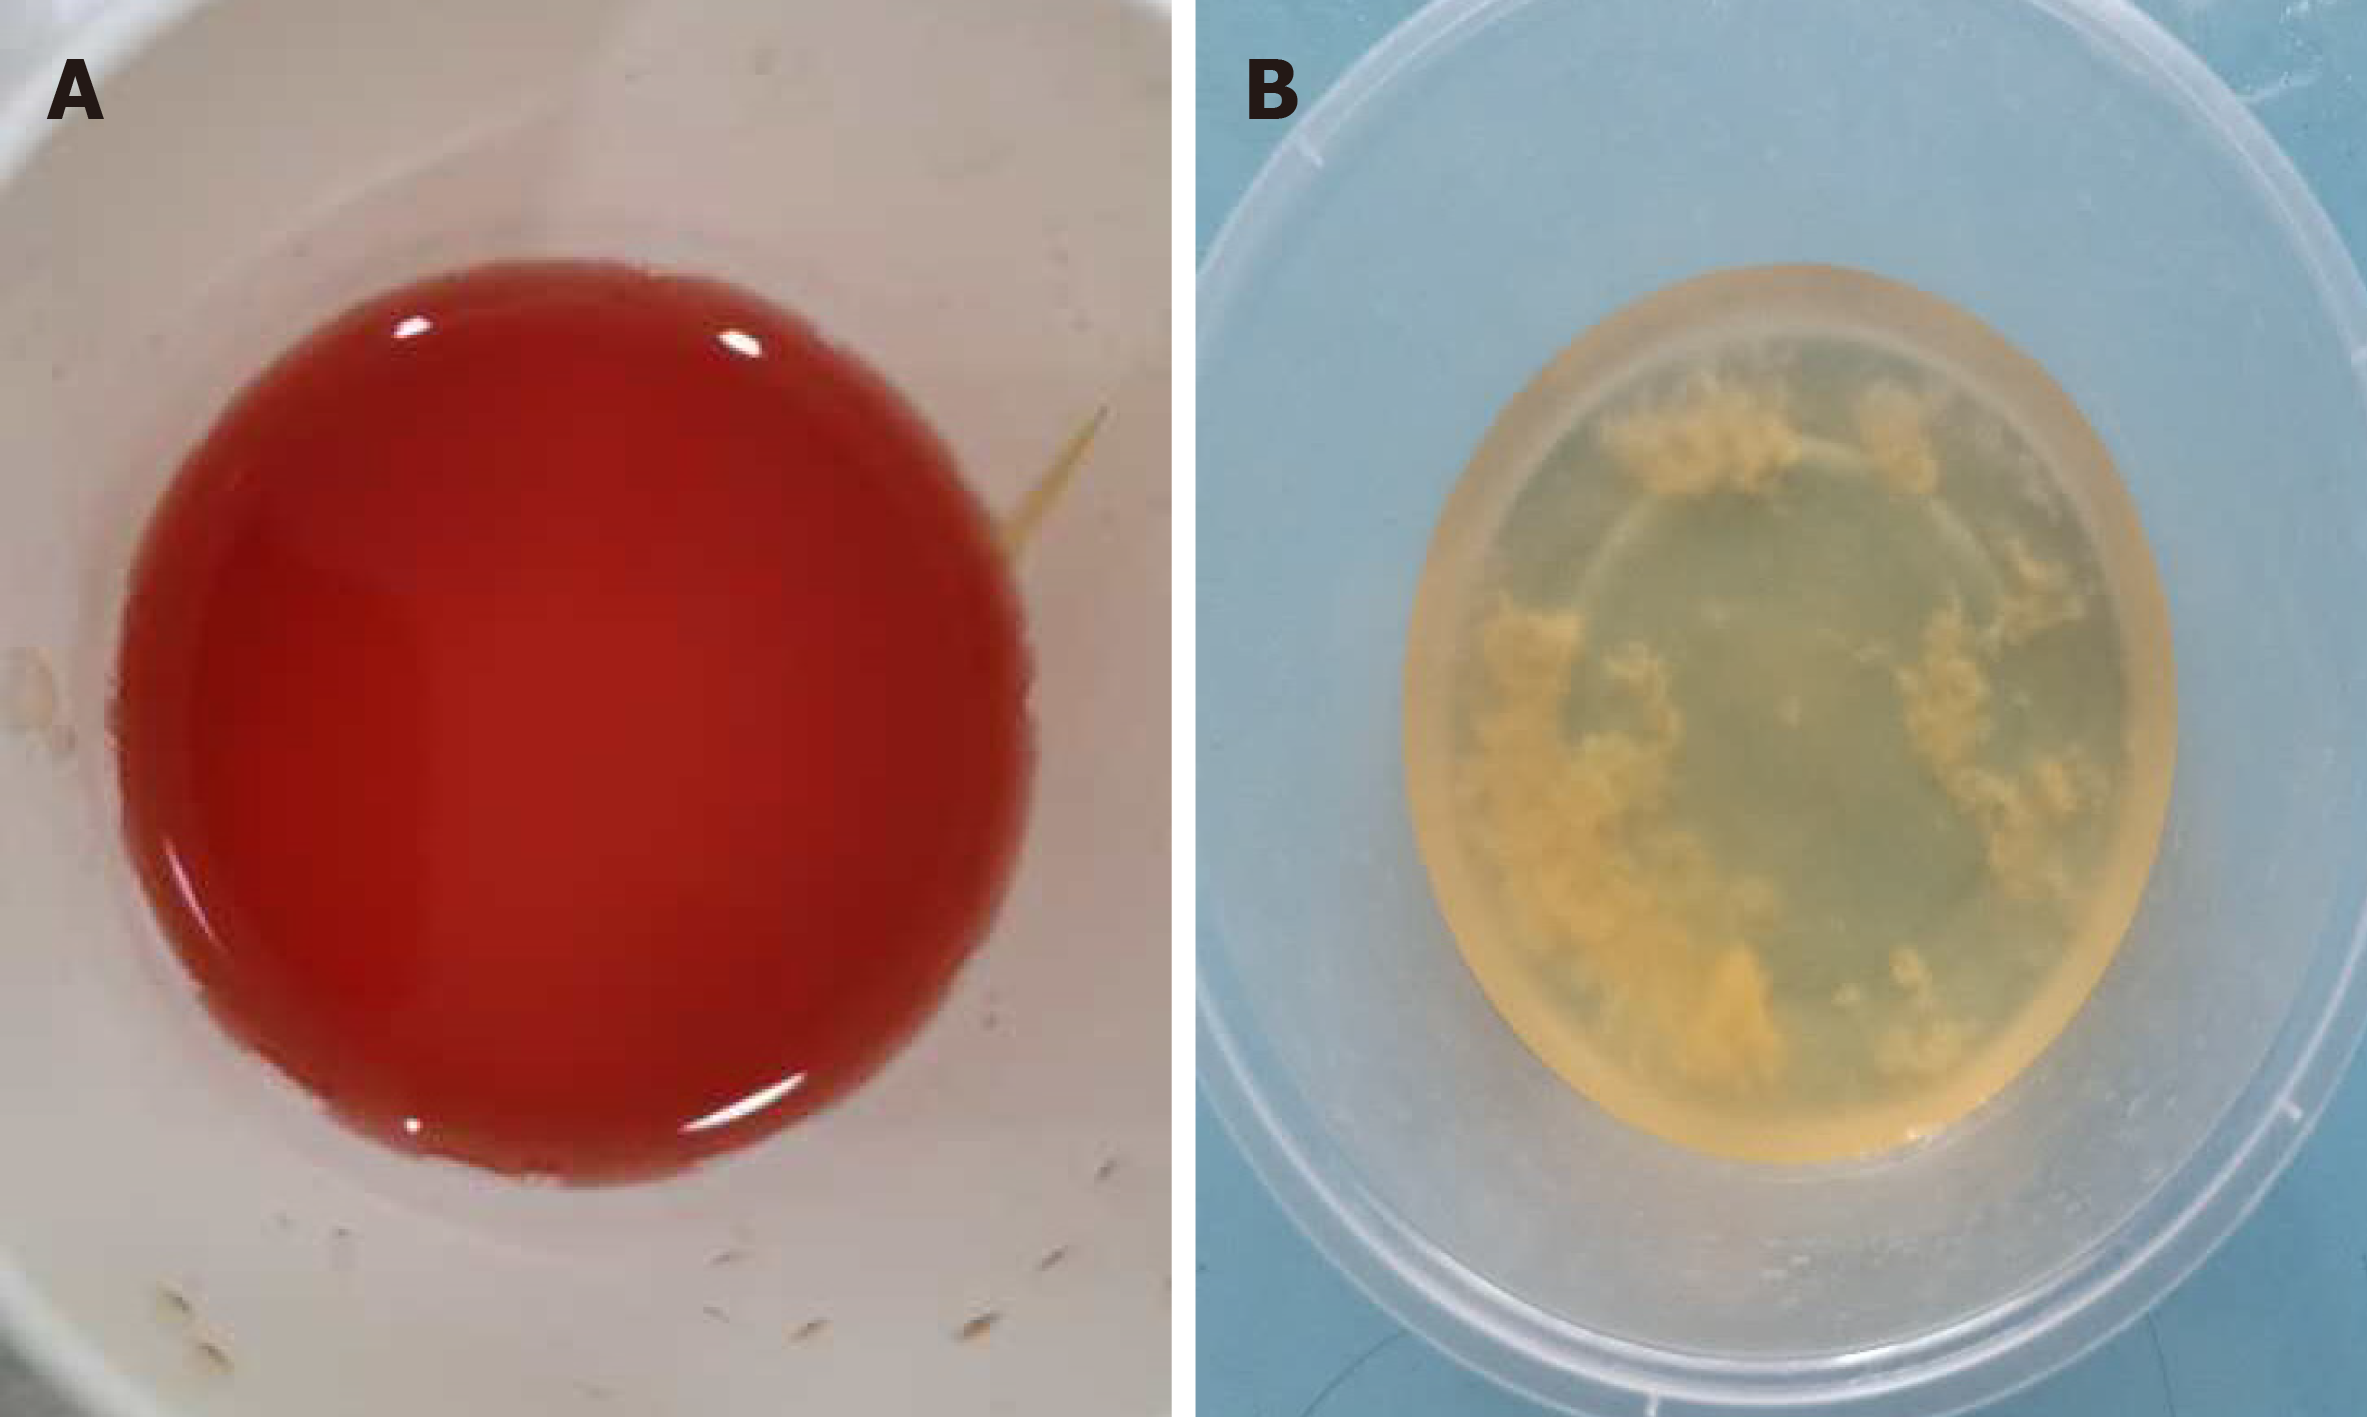
Figure 1 The patient’s urine.
A: Image at the time of admission to the hospital; B: Image after just completing carbon ion radiotherapy.
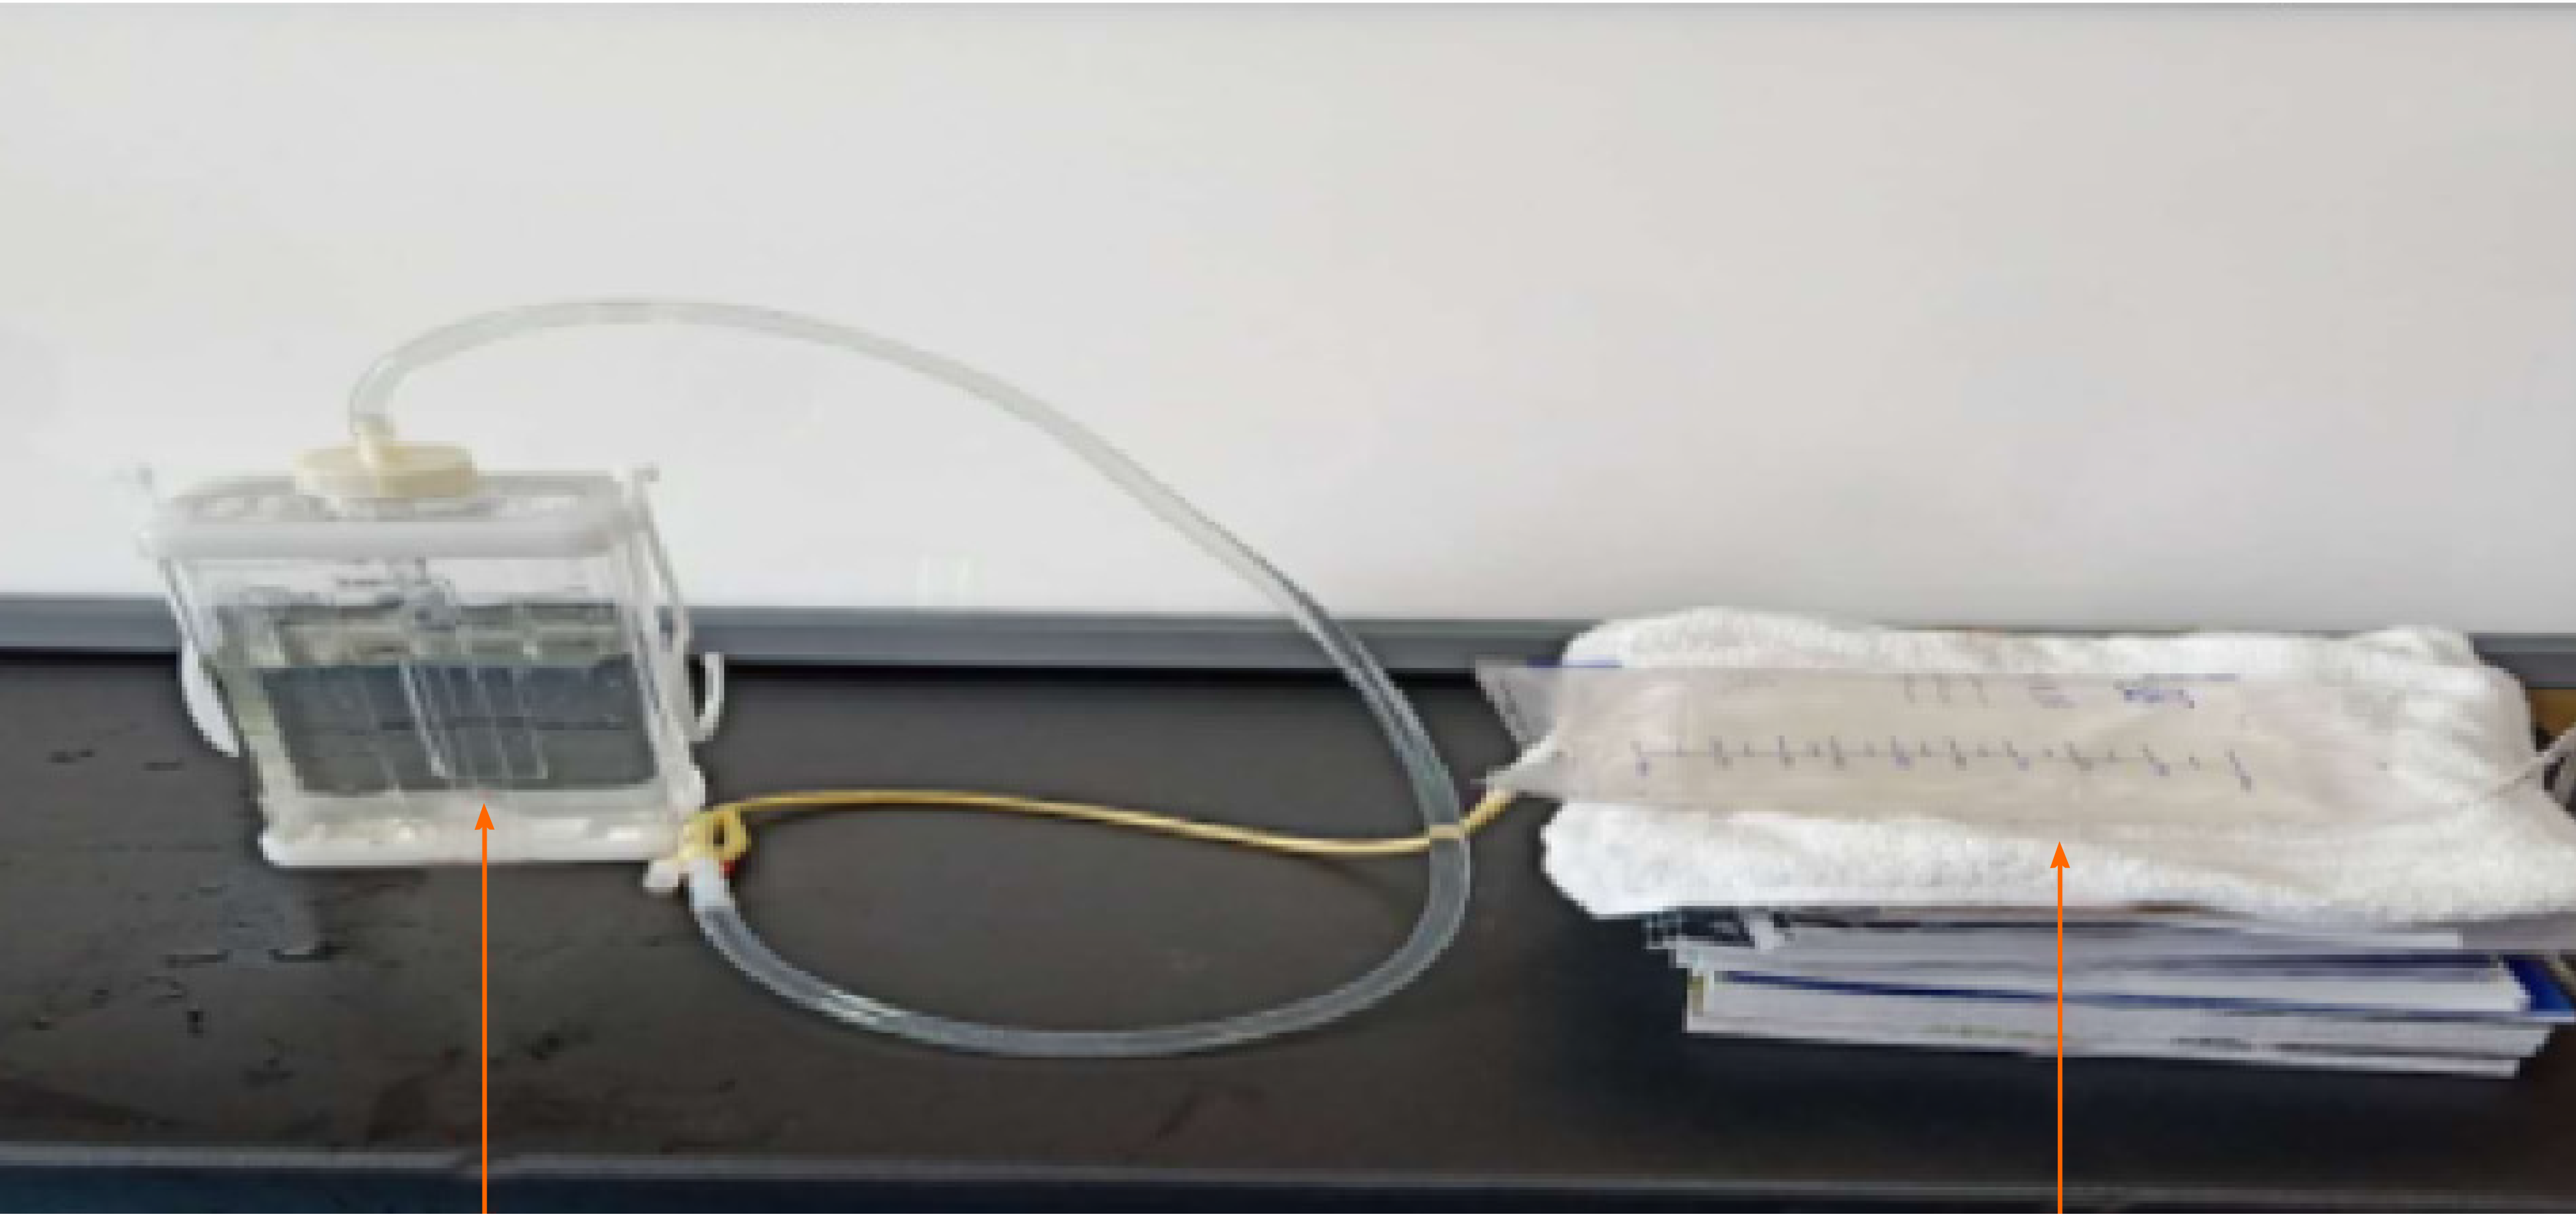
Figure 2 Schematic diagram of “galloping scheme”, the orange arrow (left-the closed thoracic, right-simulation of the bladder).
Figure 3 Double lumen latex balloon foley catheter.
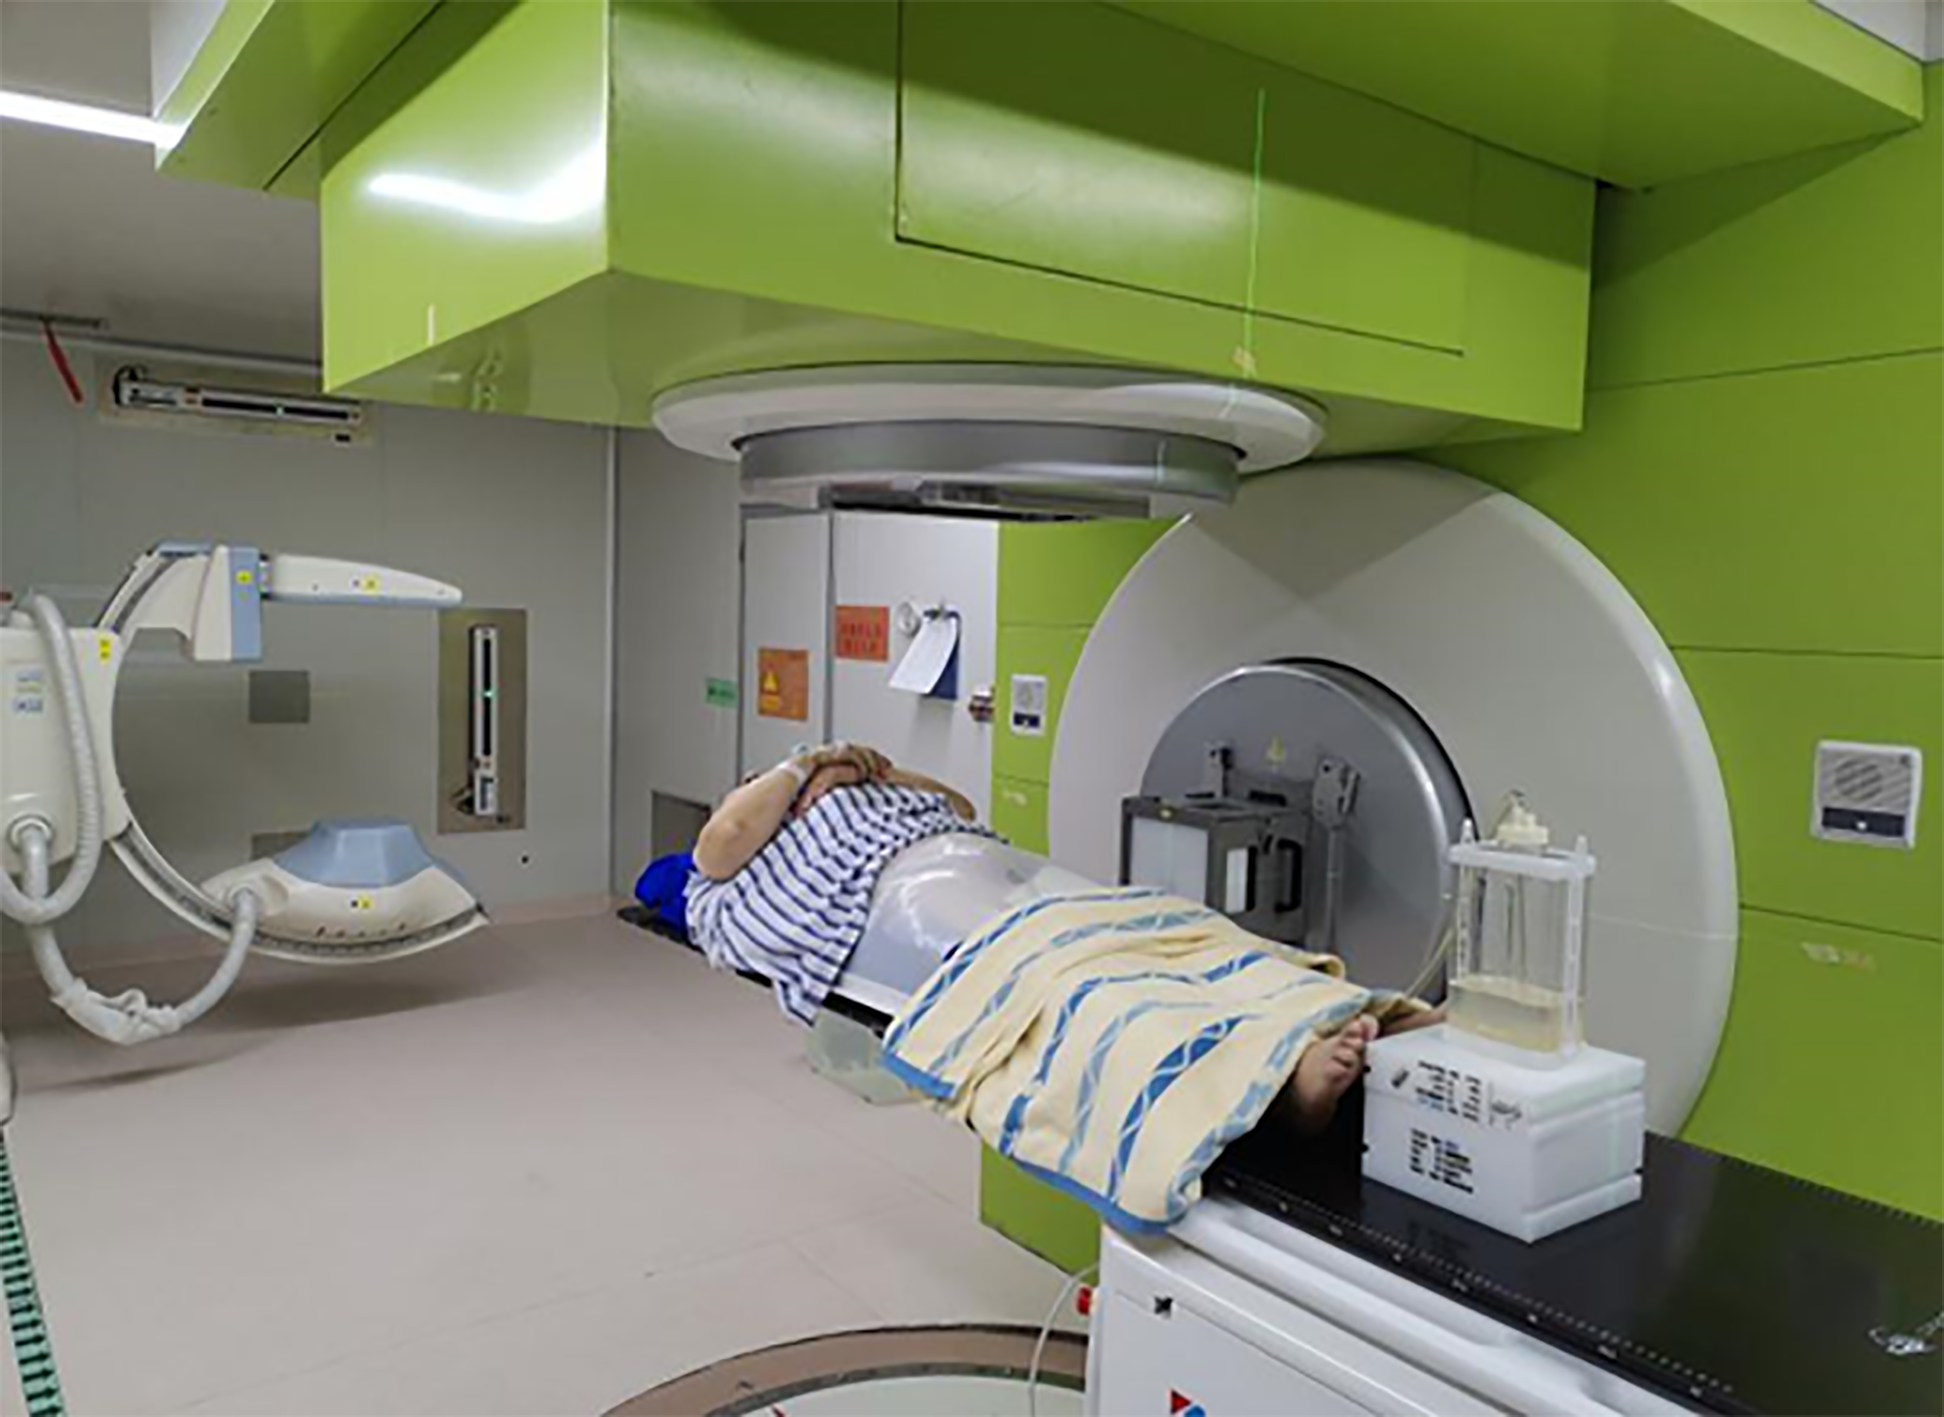
Figure 4 Image of patient during computed tomography immobilization with “galloping scheme”.
Figure 5 Computed tomography images.
A: Pre-carbon ion radiotherapy (CIRT, tumor shown as red circle); B: After CIRT; C: Three months after CIRT.
- Citation: Zhang YS, Li XJ, Zhang YH, Hu TC, Chen WZ, Pan X, Chai HY, Wang X, Yang YL. Carbon ion radiotherapy for bladder cancer: A case report. World J Clin Cases 2021; 9(26): 7833-7839
- URL: https://www.wjgnet.com/2307-8960/full/v9/i26/7833.htm
- DOI: https://dx.doi.org/10.12998/wjcc.v9.i26.7833


