Copyright
©The Author(s) 2021.
World J Clin Cases. Sep 6, 2021; 9(25): 7365-7371
Published online Sep 6, 2021. doi: 10.12998/wjcc.v9.i25.7365
Published online Sep 6, 2021. doi: 10.12998/wjcc.v9.i25.7365
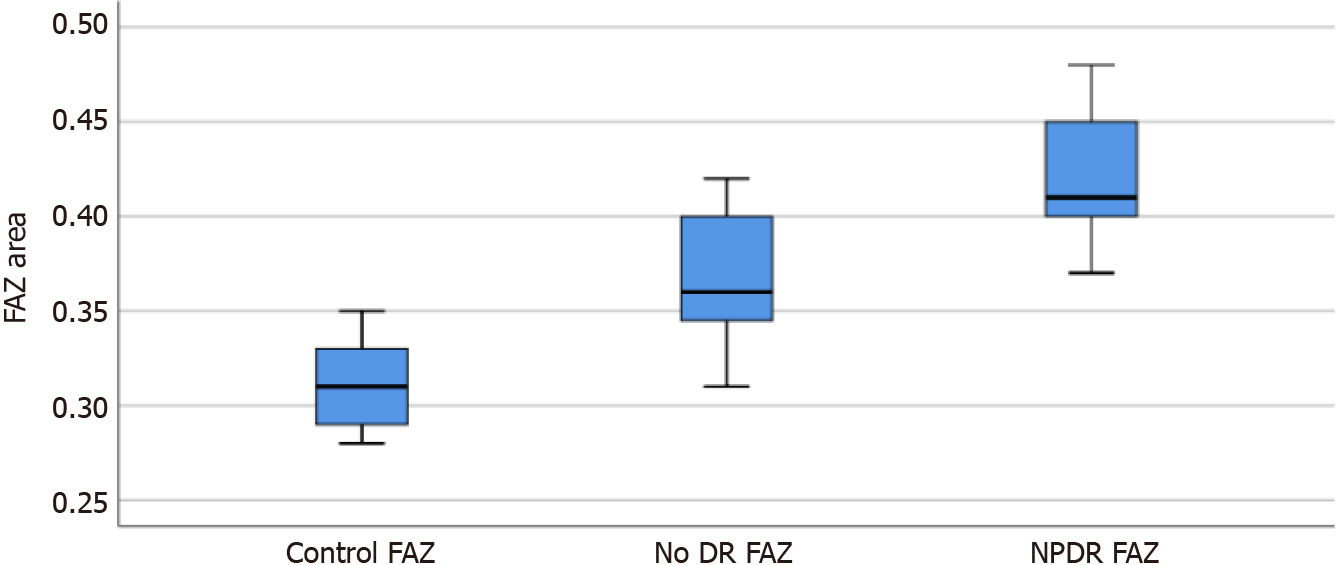
Figure 1 Foveal avascular zone area changes with diabetic retinopathy progress.
FAZ: Foveal avascular zone; DR: Diabetic retinopathy; NPDR: Non proliferative diabetic retinopathy.
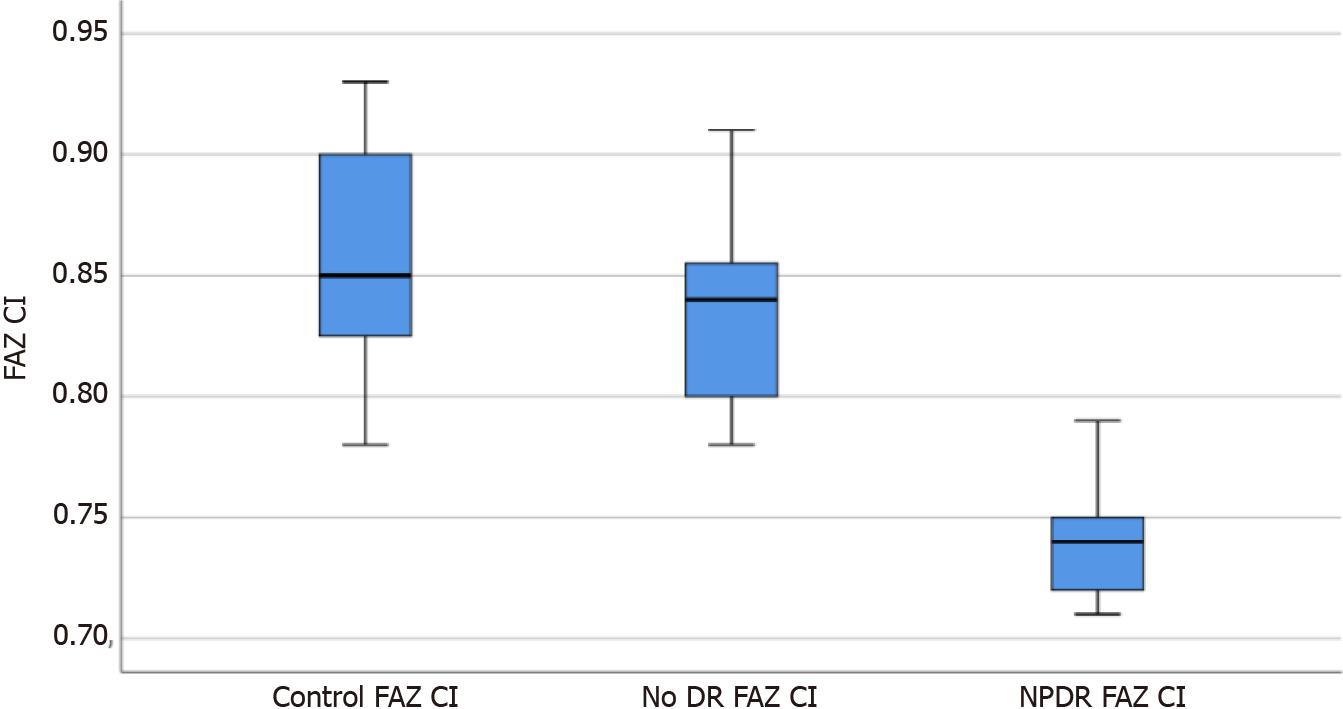
Figure 2 Foveal avascular zone circularity index changes with diabetic retinopathy progress.
FAZ: Foveal avascular zone; DR: Diabetic retinopathy; NPDR: Non proliferative diabetic retinopathy; CI: Circularity index.
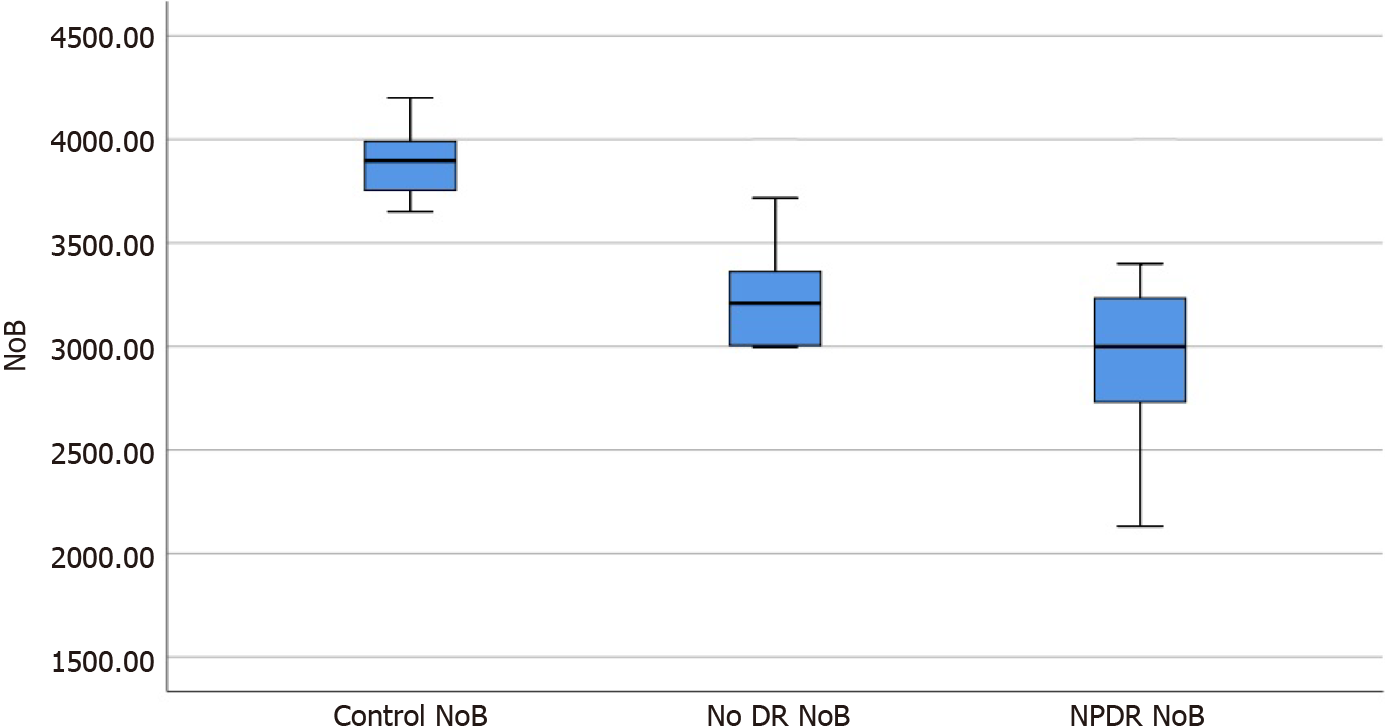
Figure 3 Number of branches in the area changes with diabetic retinopathy progress.
DR: Diabetic retinopathy; NPDR: Non proliferative diabetic retinopathy; NoB: Number of branches in the area.
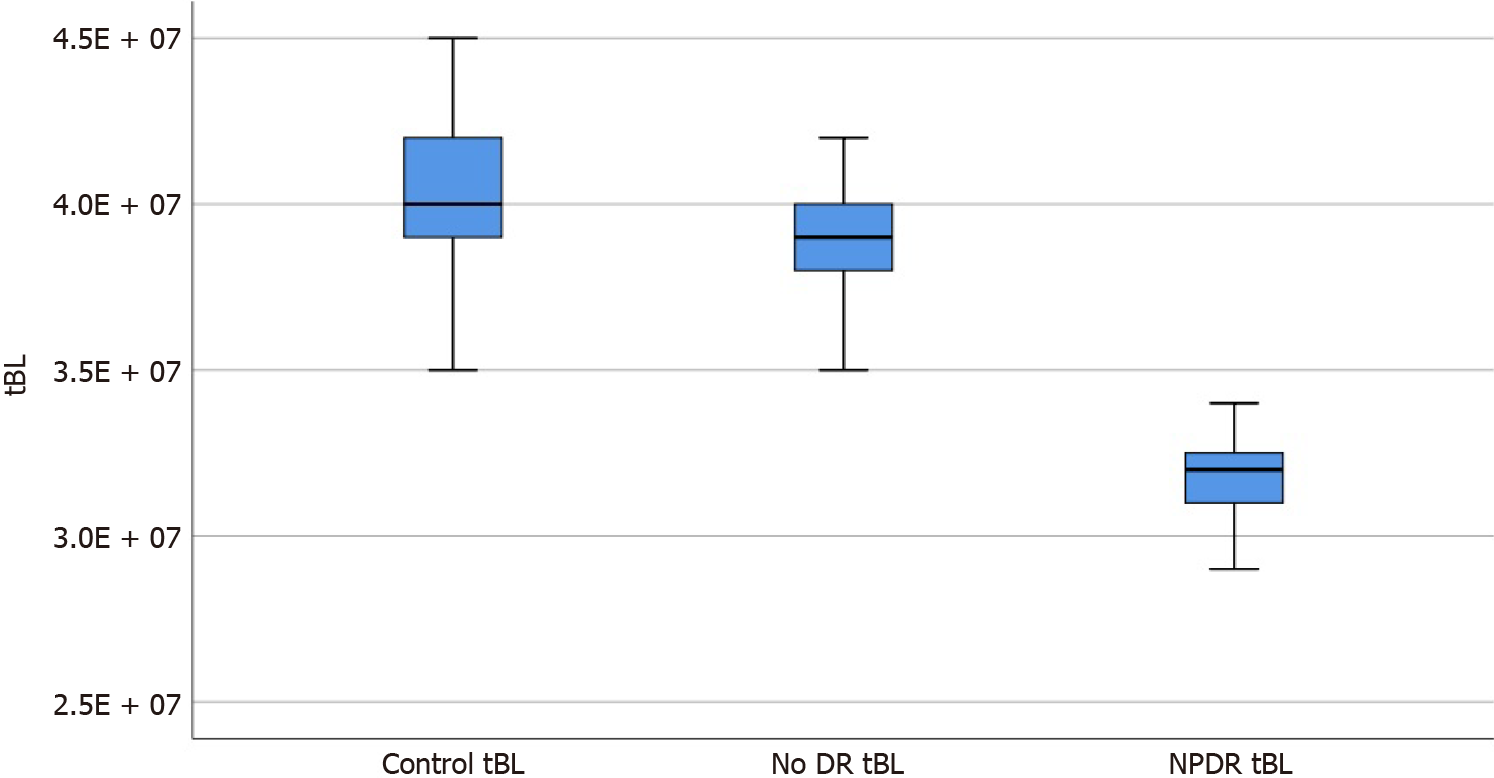
Figure 4 Total of the single branches’ length in the area changes with diabetic retinopathy progress.
DR: Diabetic retinopathy; NPDR: Non proliferative diabetic retinopathy; tBL: Total of the single branches’ length in the area.
- Citation: Shi Y, Lin PY, Ruan YM, Lin CF, Hua SS, Li B. Quantitative analysis of early diabetic retinopathy based on optical coherence tomography angiography biological image. World J Clin Cases 2021; 9(25): 7365-7371
- URL: https://www.wjgnet.com/2307-8960/full/v9/i25/7365.htm
- DOI: https://dx.doi.org/10.12998/wjcc.v9.i25.7365


