Copyright
©The Author(s) 2021.
World J Clin Cases. Aug 26, 2021; 9(24): 6987-6998
Published online Aug 26, 2021. doi: 10.12998/wjcc.v9.i24.6987
Published online Aug 26, 2021. doi: 10.12998/wjcc.v9.i24.6987
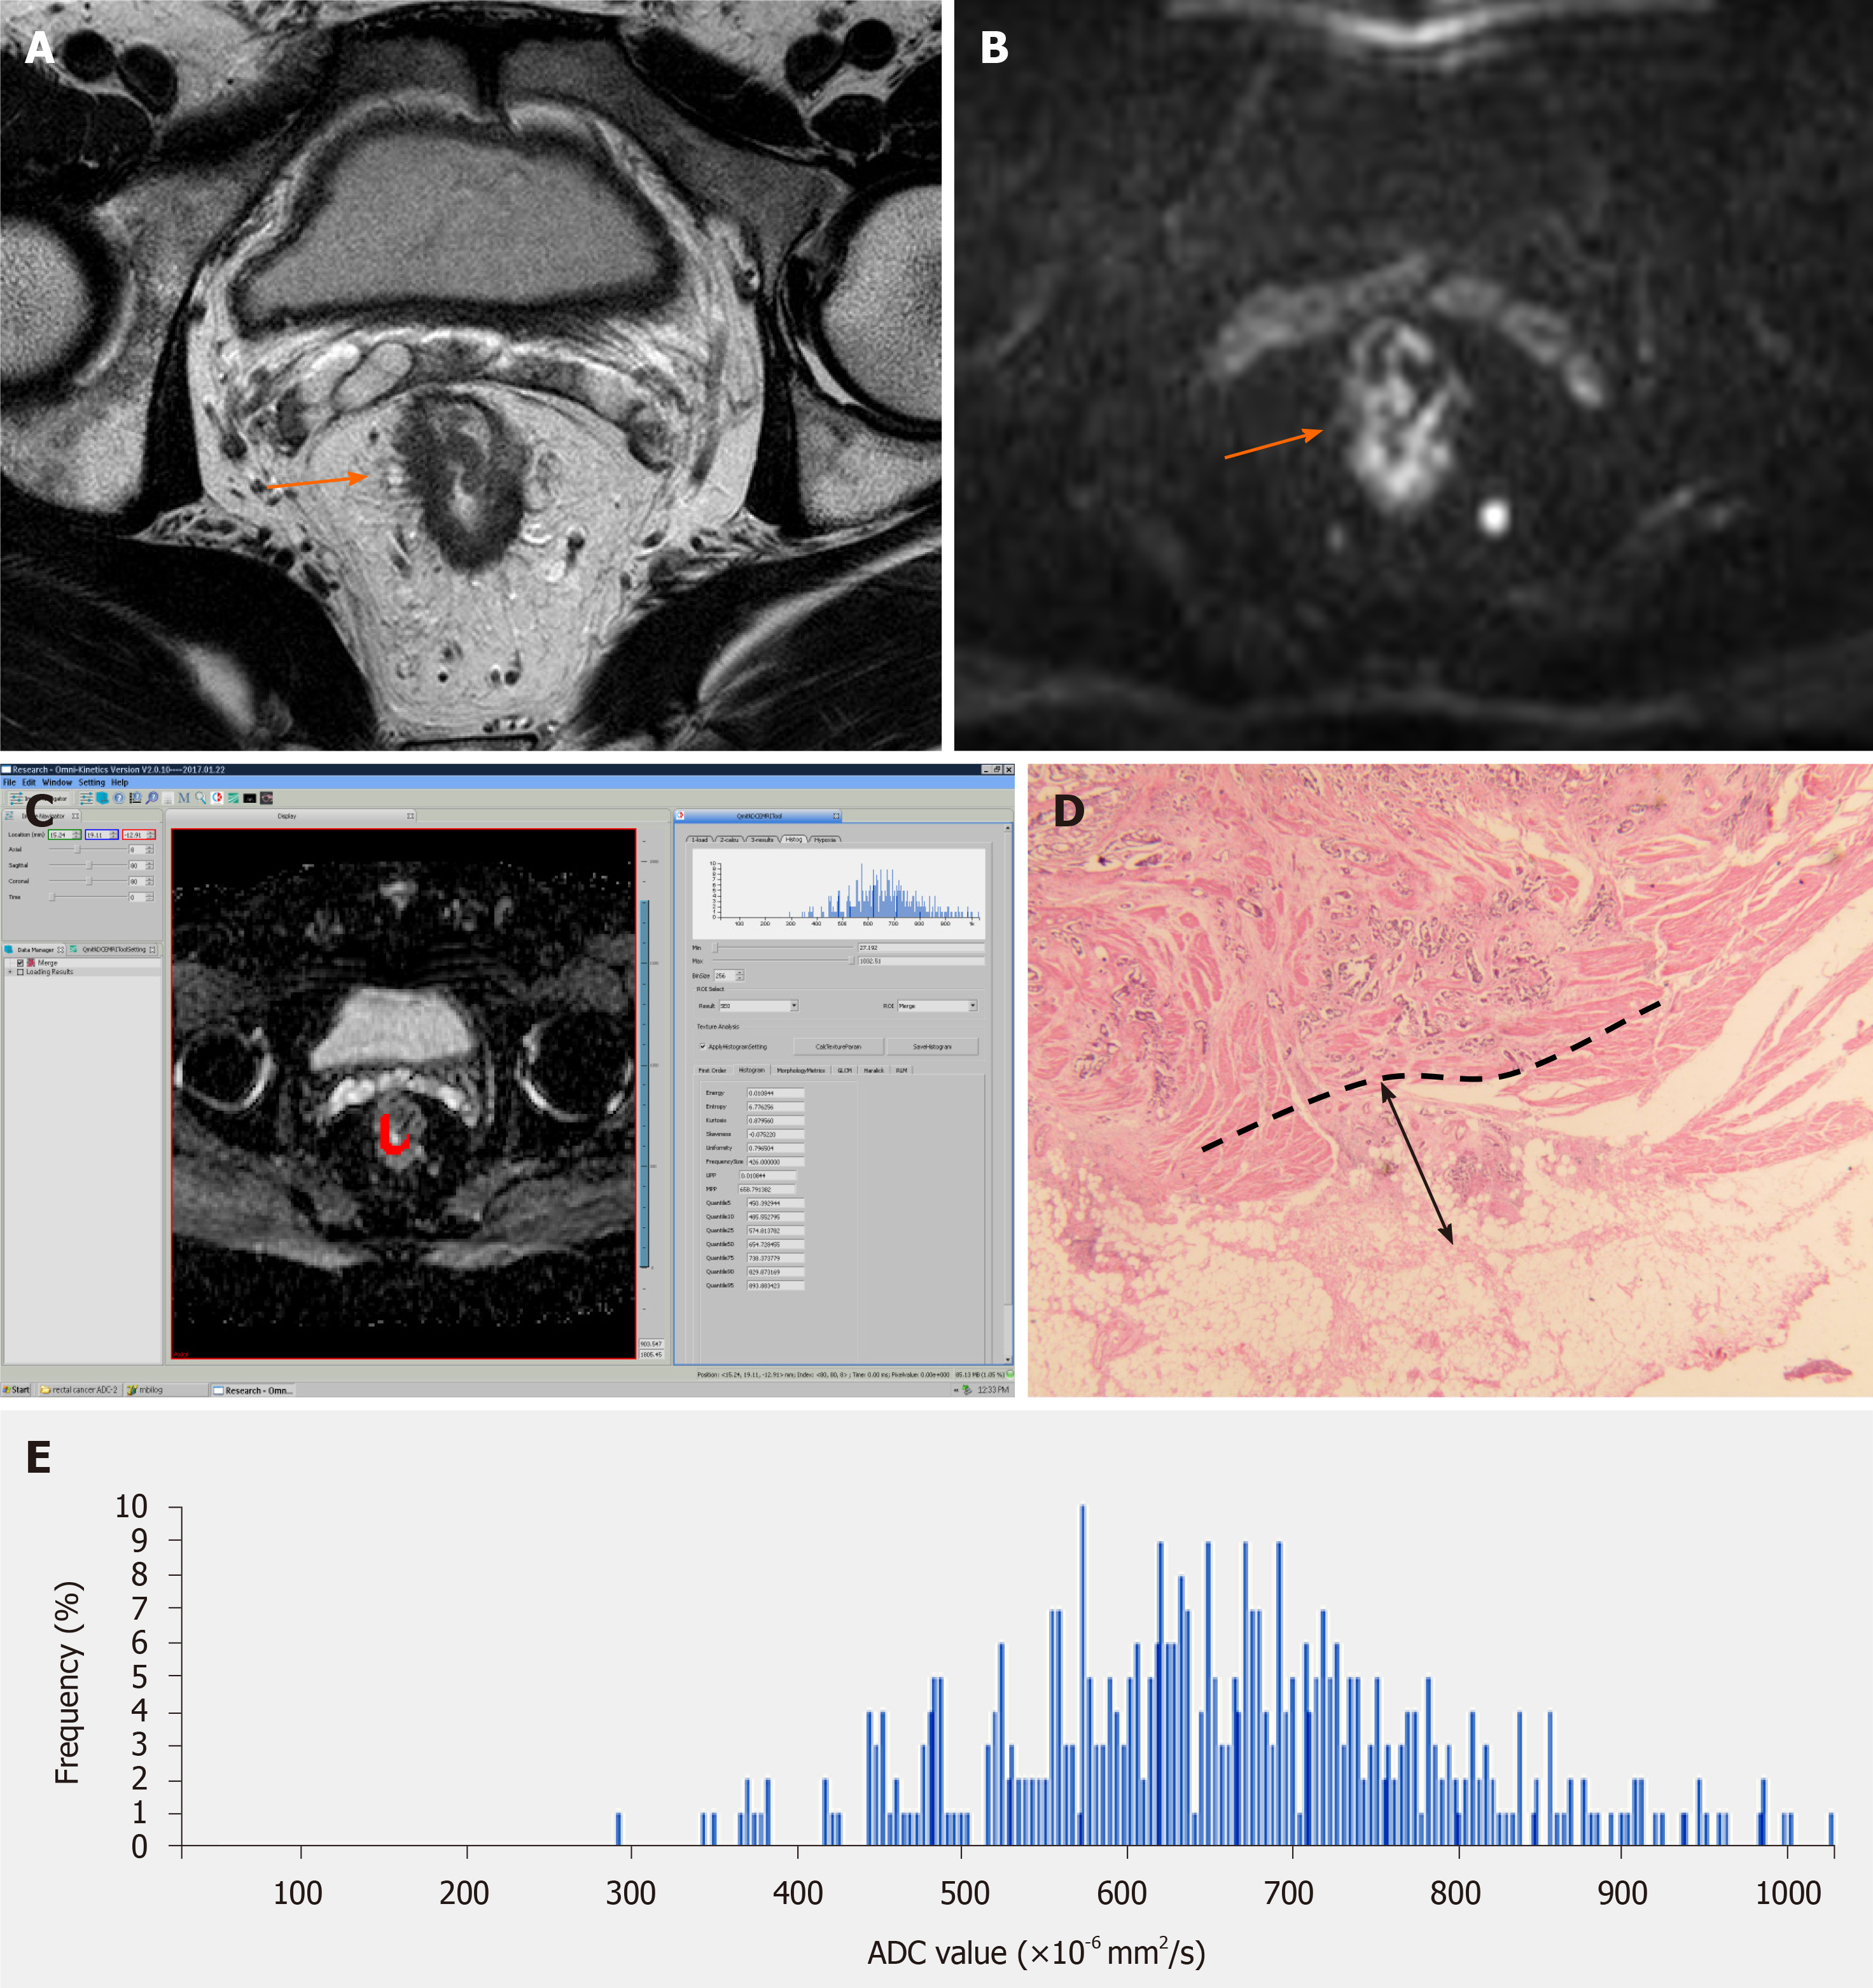
Figure 1 T3a stage rectal adenocarcinoma.
A: Axial high-resolution T2WI showing that the rectal mass had destroyed the muscularis propria and spread into the mesorectum (orange arrow); B: Diffusion-weighted imaging showing an area of high signal intensity with irregular rectal wall margin (orange arrow); C: Regions of interest were manually drawn, slice by slice, covering the whole lesion (red area) on the apparent diffusion coefficient (ADC) map; D: Photomicrograph (hematoxylin & eosin staining, magnification × 200) showing that the extramural depth of tumor invasion was 2.5 mm; E: The histogram obtained from the whole lesion on ADC maps provided first-order texture features. ADC: Apparent diffusion coefficient.
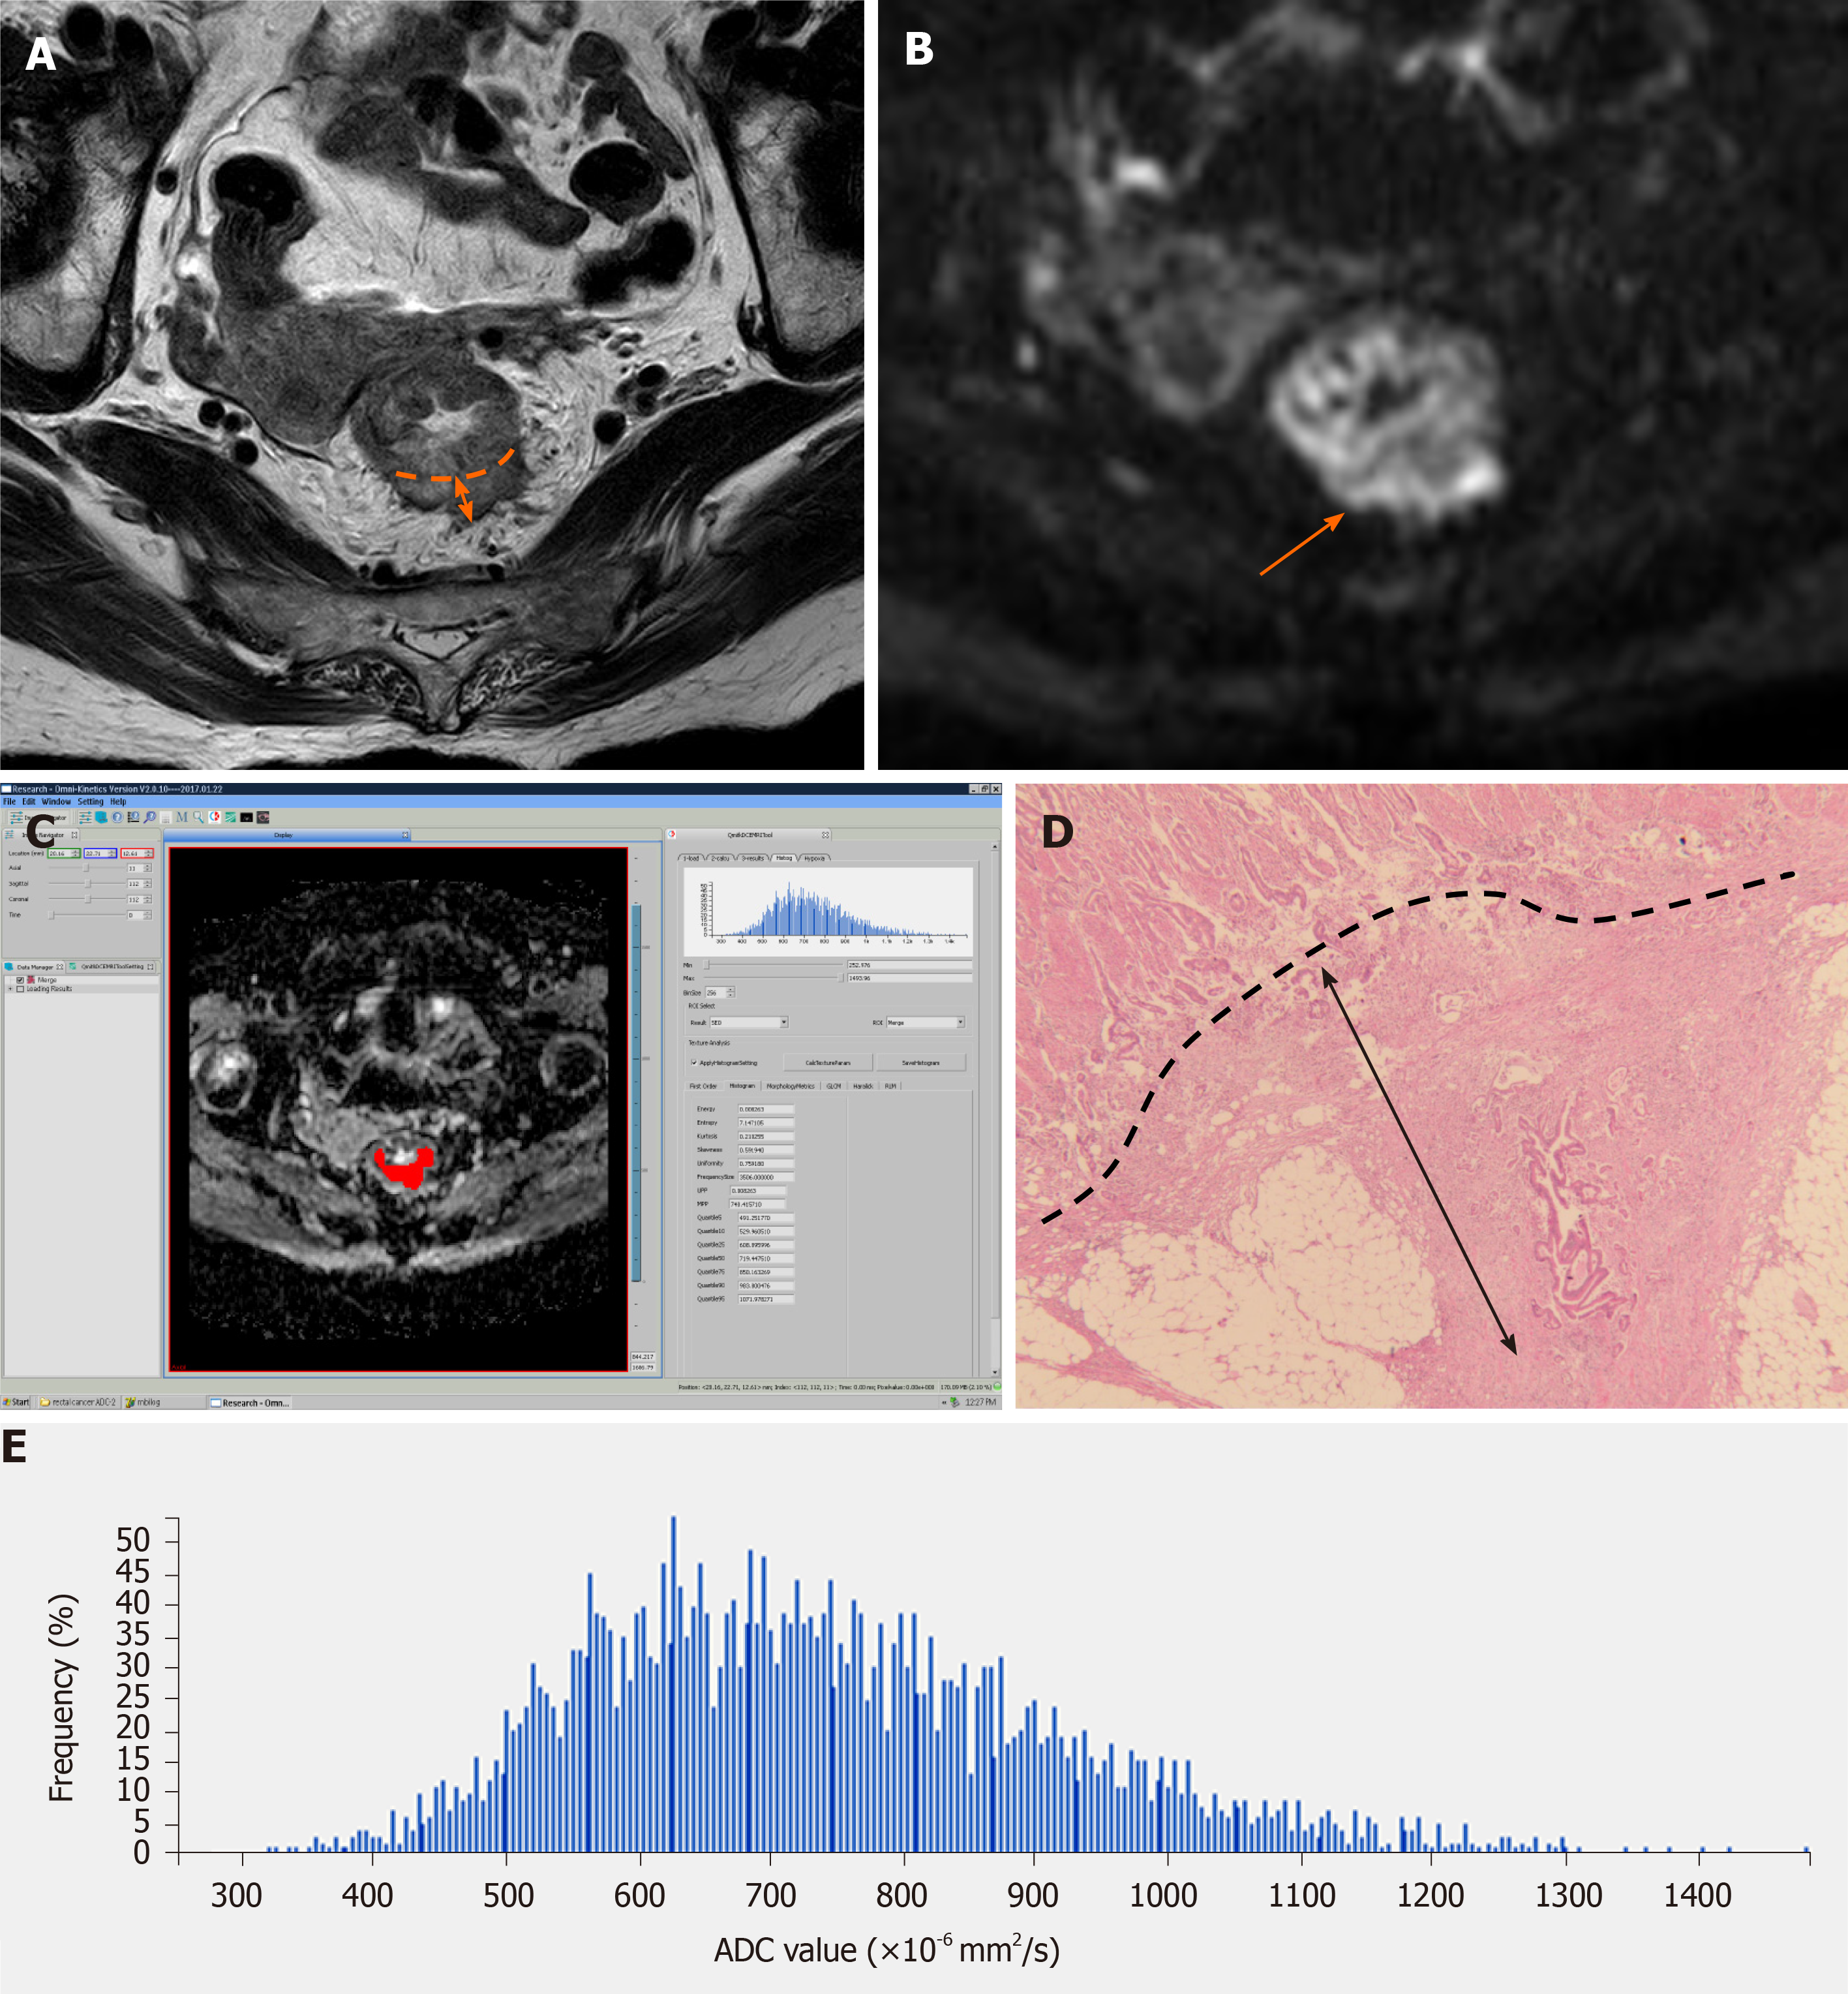
Figure 2 T3b stage rectal adenocarcinoma.
A: Axial high-resolution T2WI showing that the muscularis propria at the 4-6 o’clock direction was destroyed. An imaginary line (dash line) connecting two breakpoints of the muscularis propria layer is shown. The tumor had spread into the mesorectum (orange double arrow); B: Diffusion-weighted imaging showing an area of high signal intensity where the tumor invaded the muscularis propria, and the 4-6 o'clock direction of the tumor was the main invasion direction (orange arrow); C: Regions of interest were manually drawn, slice by slice, covering the whole lesion (red area) on the apparent diffusion coefficient (ADC) map; D: Photomicrograph (hematoxylin & eosin staining, magnification ×200) showing that the extramural depth of tumor invasion was 7 mm; E: The histogram obtained from the whole lesion on ADC maps provided first-order texture features. ADC: Apparent diffusion coefficient.
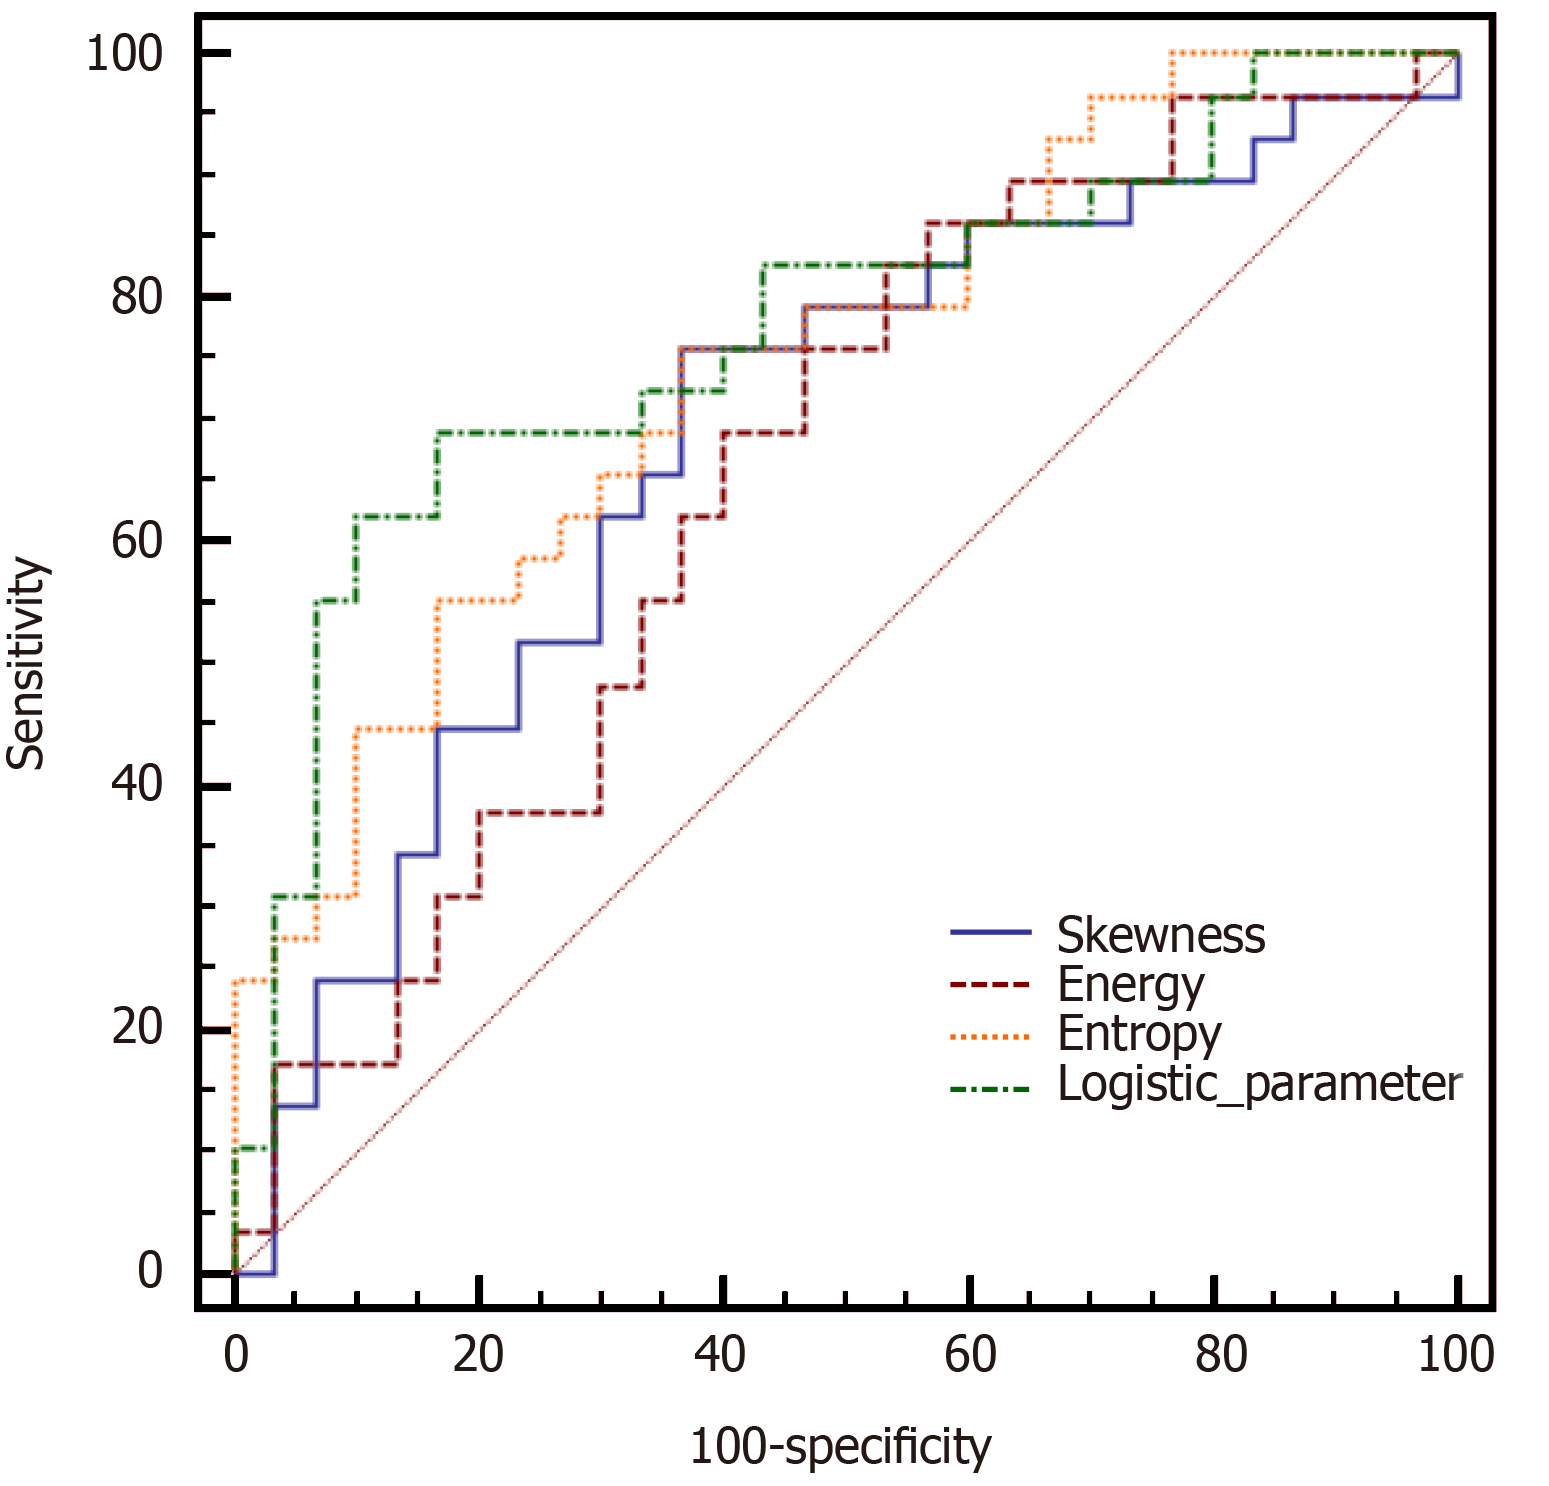
Figure 3 Receiver operating characteristic curves of four important texture features for calculating the areas under the curves in differentiating pT3a rectal adenocarcinomas from pT3b-c tumors.
- Citation: Lu ZH, Xia KJ, Jiang H, Jiang JL, Wu M. Textural differences based on apparent diffusion coefficient maps for discriminating pT3 subclasses of rectal adenocarcinoma. World J Clin Cases 2021; 9(24): 6987-6998
- URL: https://www.wjgnet.com/2307-8960/full/v9/i24/6987.htm
- DOI: https://dx.doi.org/10.12998/wjcc.v9.i24.6987


