Copyright
©The Author(s) 2021.
World J Clin Cases. Aug 16, 2021; 9(23): 6846-6857
Published online Aug 16, 2021. doi: 10.12998/wjcc.v9.i23.6846
Published online Aug 16, 2021. doi: 10.12998/wjcc.v9.i23.6846
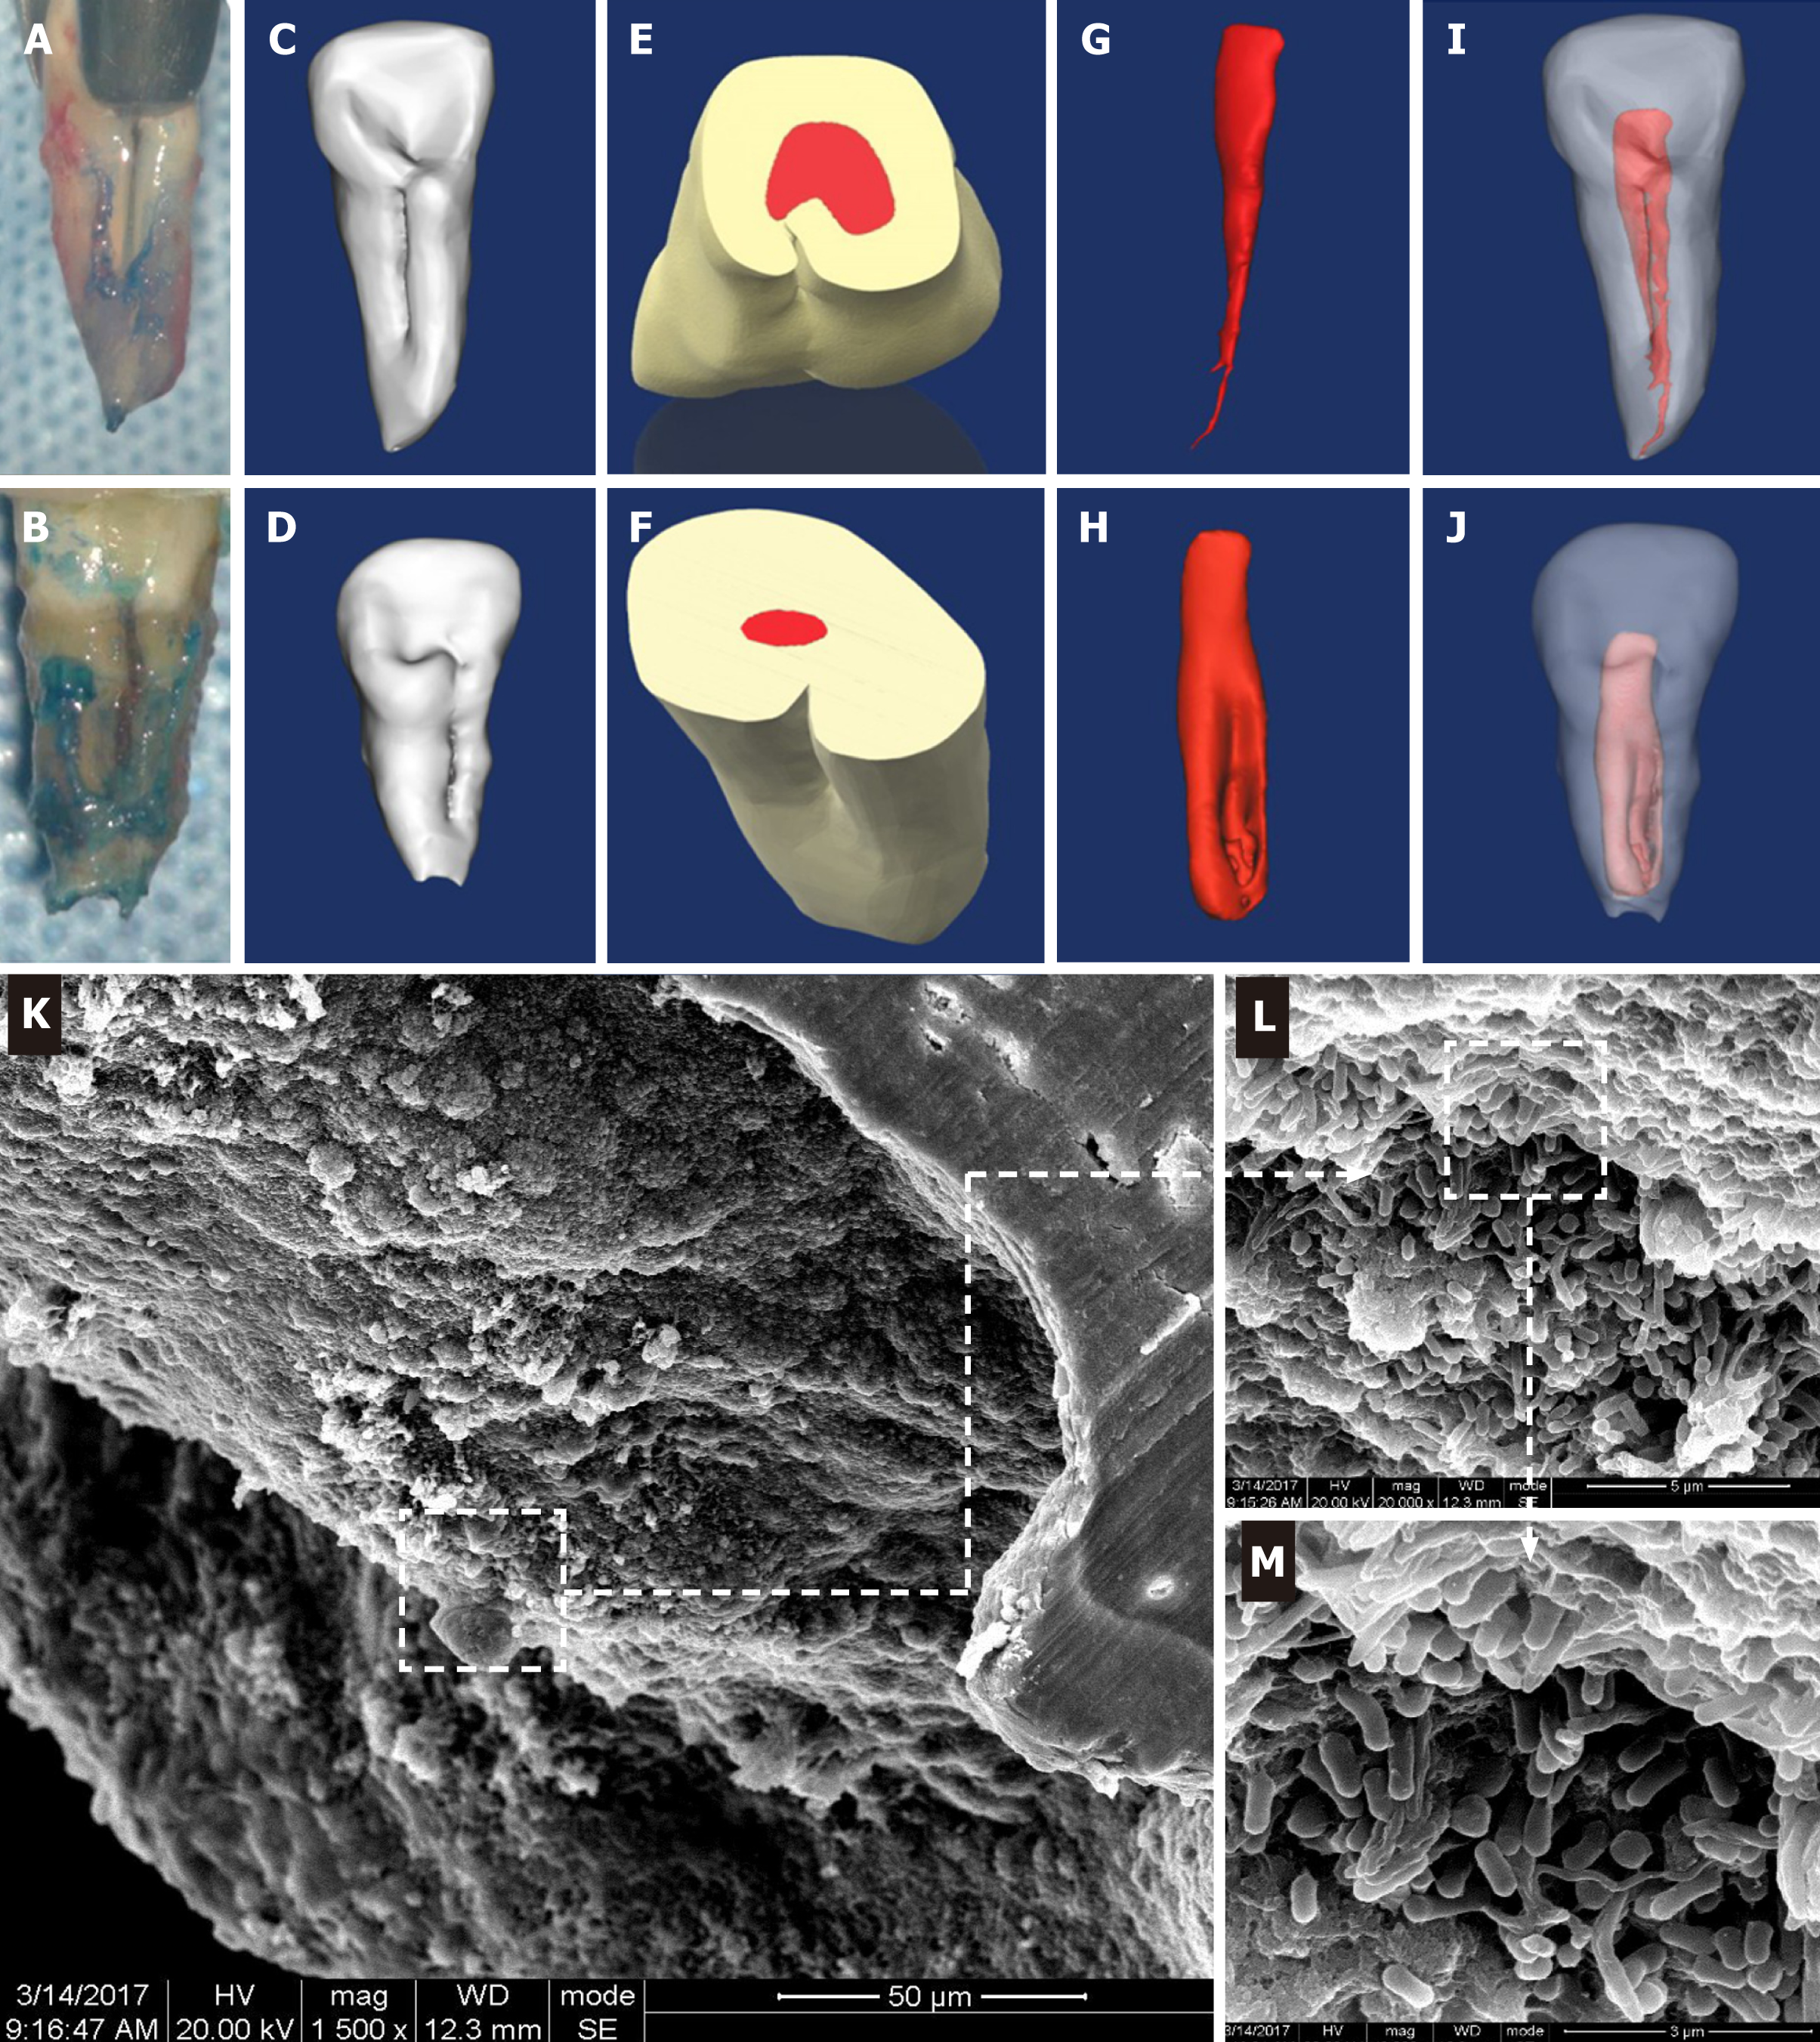
Figure 1 Three-dimensional reconstruction of the teeth with palatal radicular groove and representative scanning electron microscope images for resected root apex.
A and B: Intraoperative awareness of palatal groove during intentional replantation; C and D: Lingual view of the three-dimensional reconstruction models of type I and type II palatal grooves; E-J: Shapes of the pulp cavity associated with type I and II palatal grooves and their spatial and configurational relationship with the root; K-M: Gradually magnified scanning electron microscope photograph series of the biofilm covering the root apex of tooth with palatal radicular groove associated infection (K: × 1500; L: × 20000; M: × 40000).
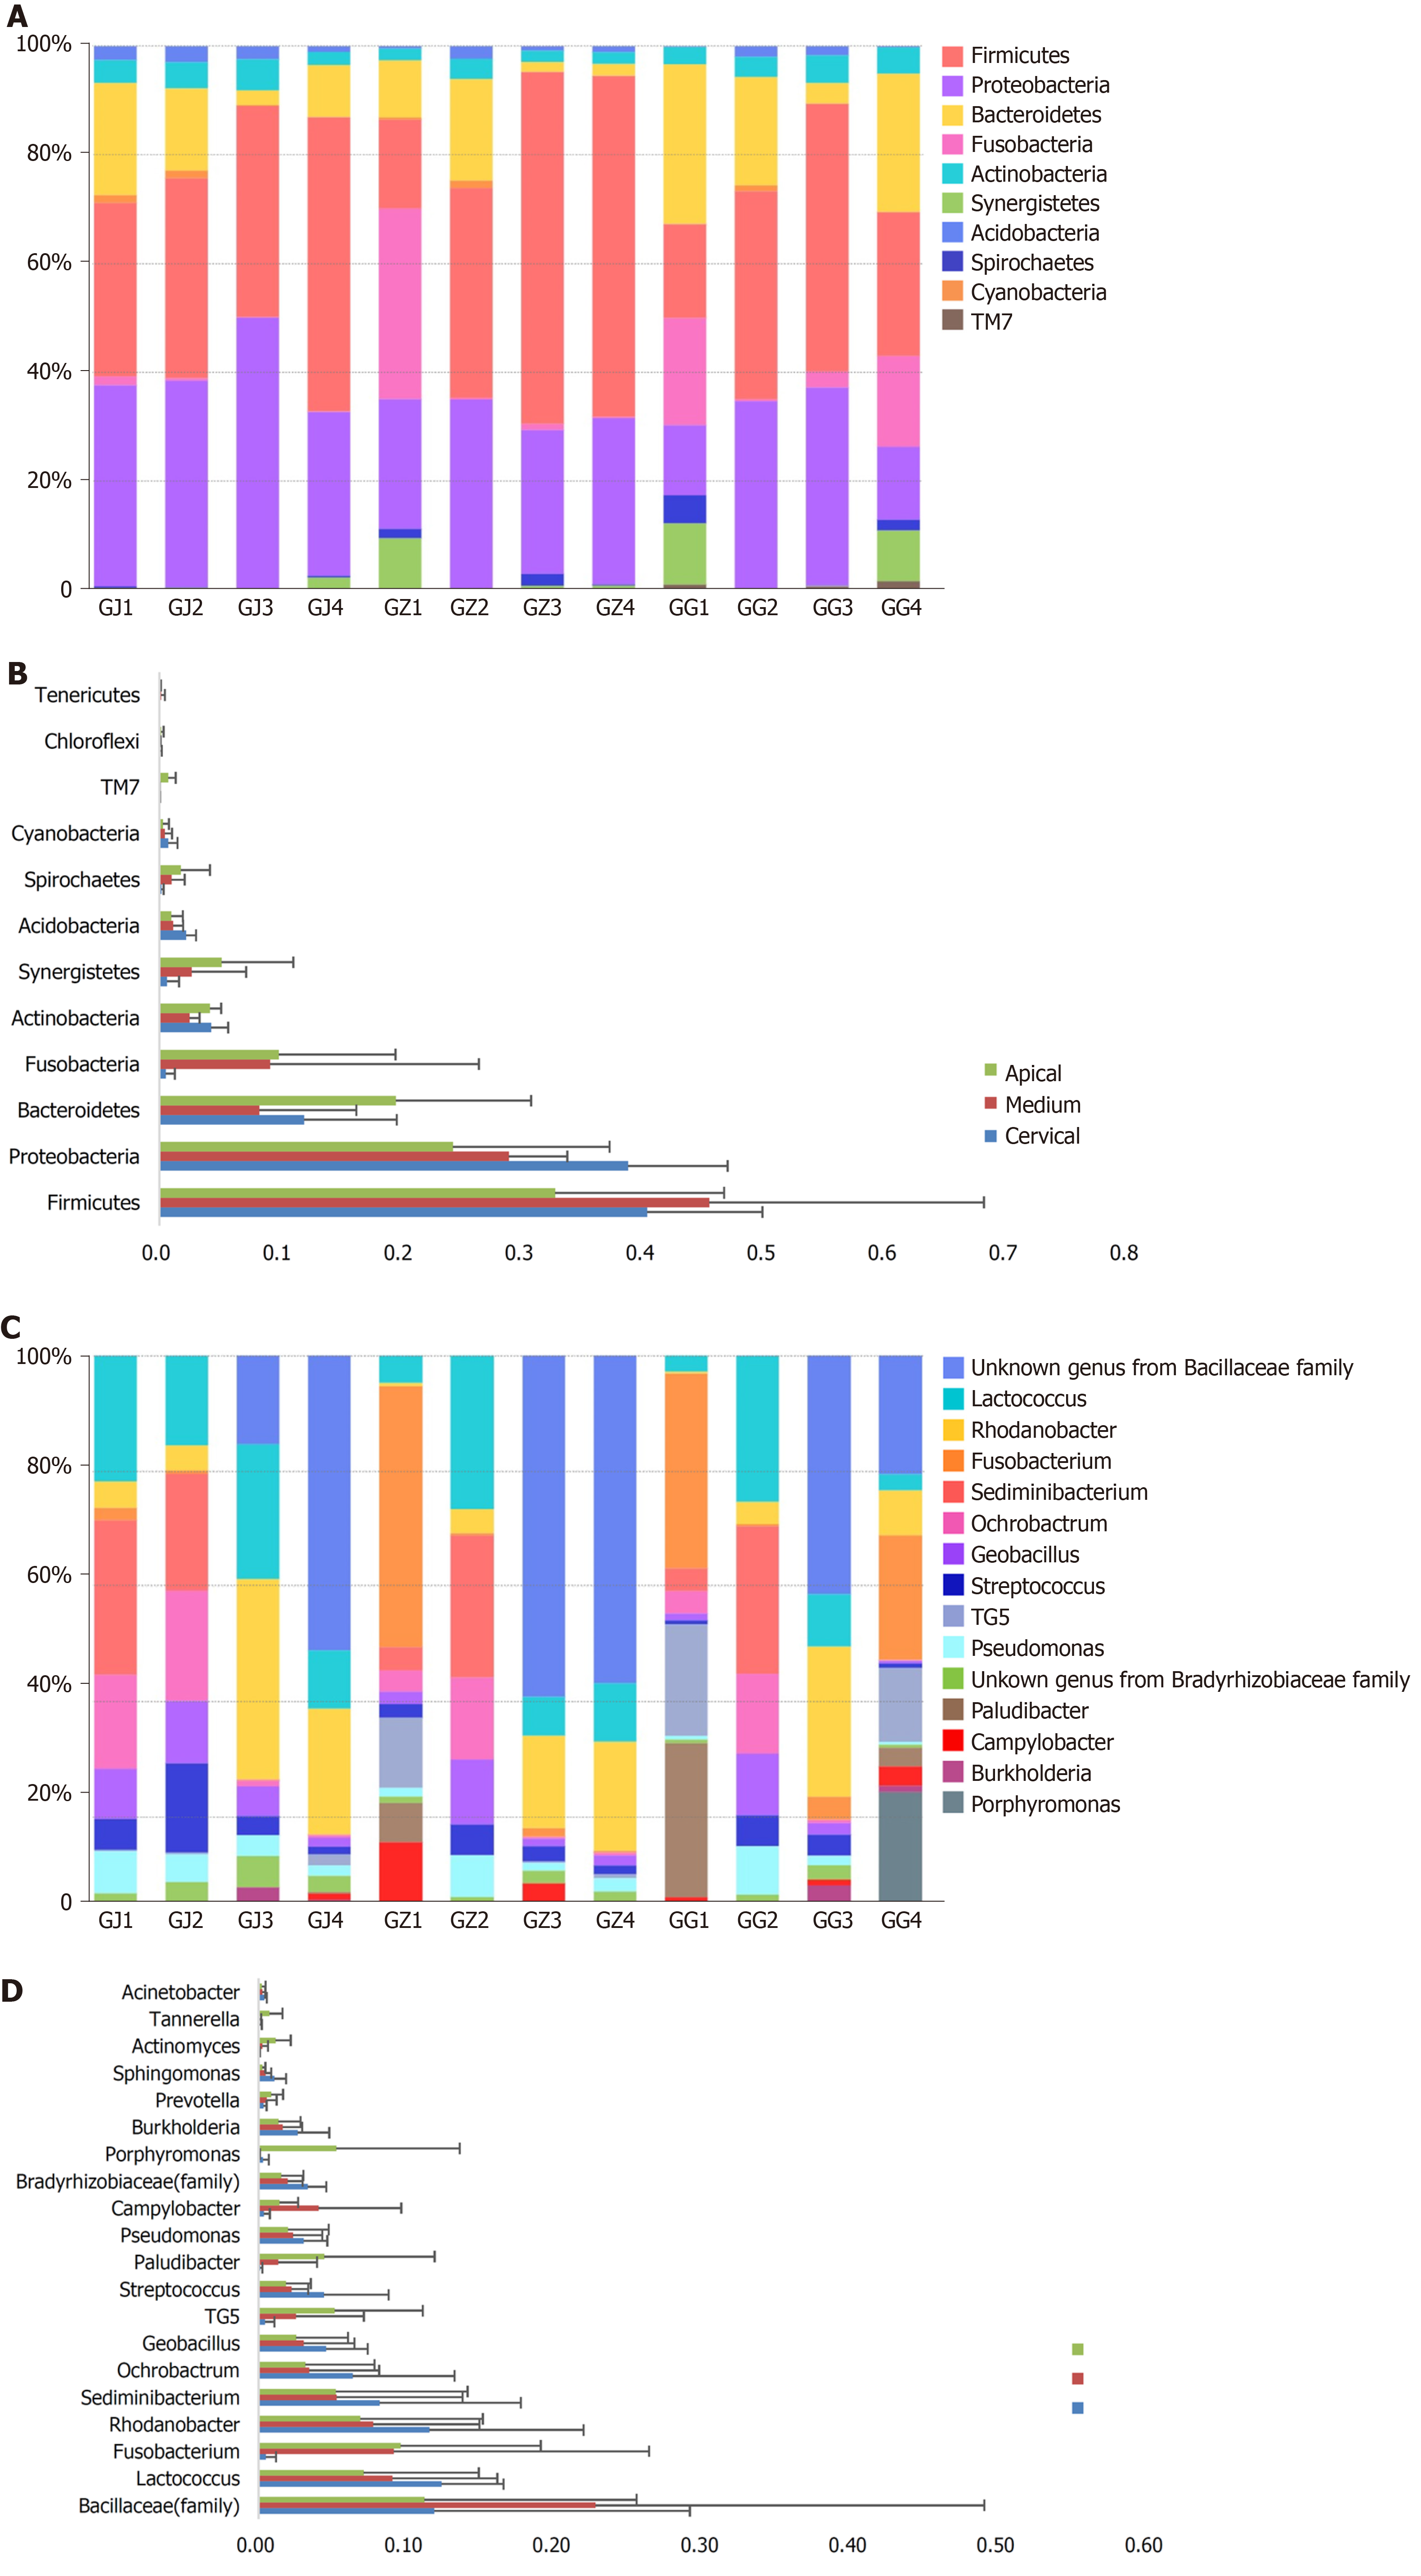
Figure 2 Distribution and abundance of phyla and genera.
A and B: Distribution and abundance of phyla (relative abundances > 0.2%) in the microbiota derived from various sections of palatal grooves accompanied with endodontic-periodontal diseases; C and D: Distribution and abundance of genera (relative abundances > 1.5%) in the microbiota derived from various sections of palatal grooves accompanied with endodontic-periodontal diseases. GG: Cervical samples; GJ: Apical samples; GZ: Middle samples.
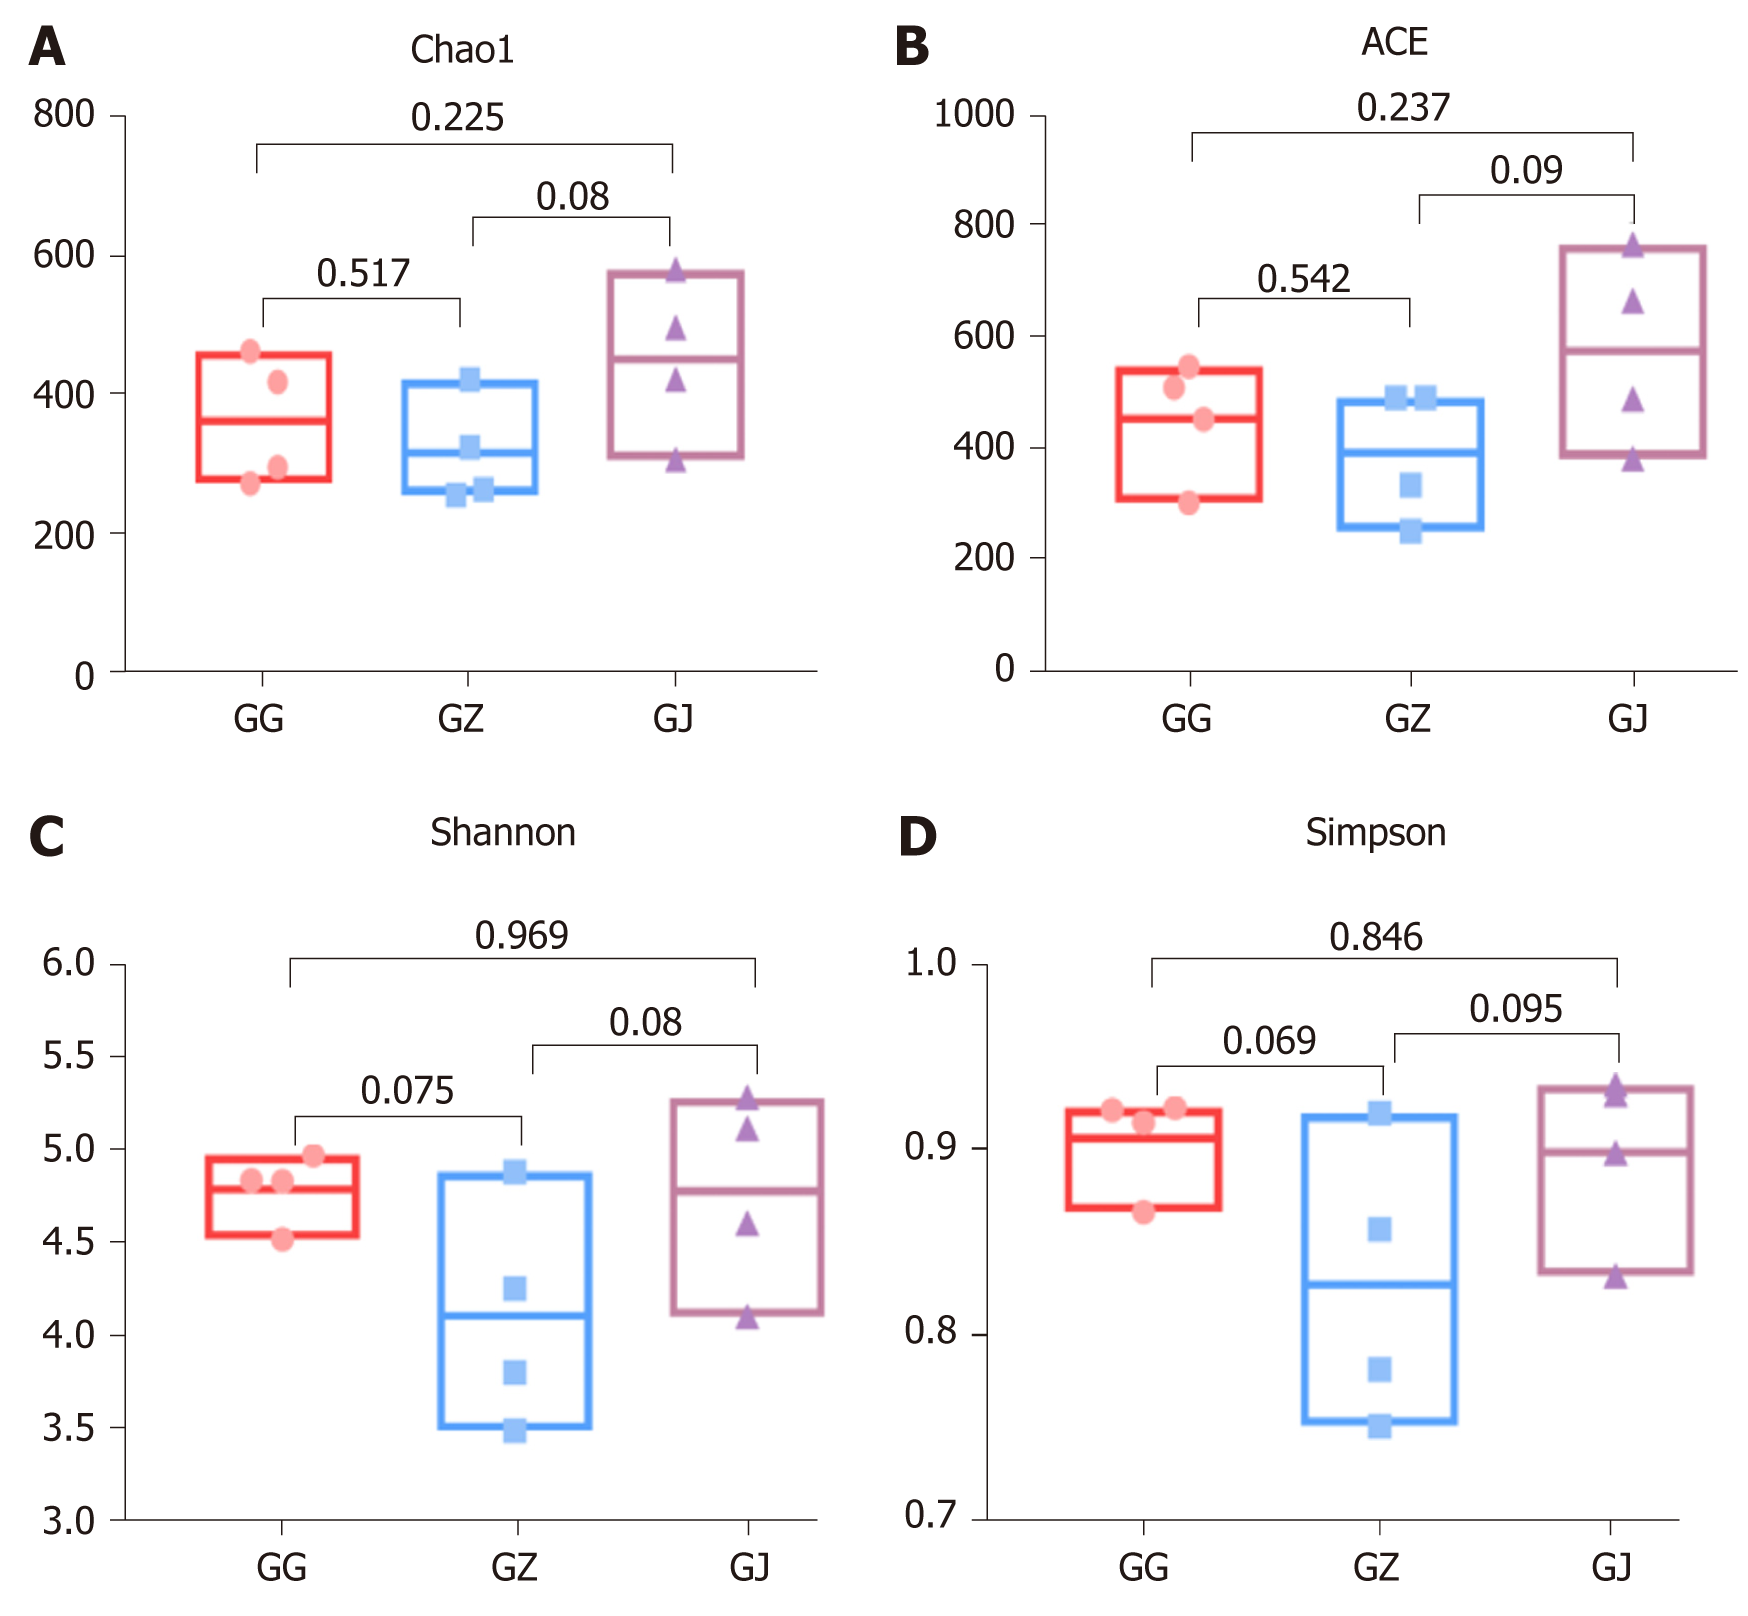
Figure 3 Alpha diversity analyses of bacterial communities in various sections of palatal grooves diagnosed with endodontic-periodontal infections.
A: The Chao1 richness estimator; B: The angiotensin converting enzyme richness estimator; C: The Shannon diversity index; D: The Simpson diversity index. Boxes and dots represent the values generated from each group. Line in the middle of the column indicates the average value of each part. P values were shown above the connection lines, and no significant differences were detected among groups. ACE: Angiotensin converting enzyme; GG: Cervical samples; GJ: Apical samples; GZ: Middle samples.
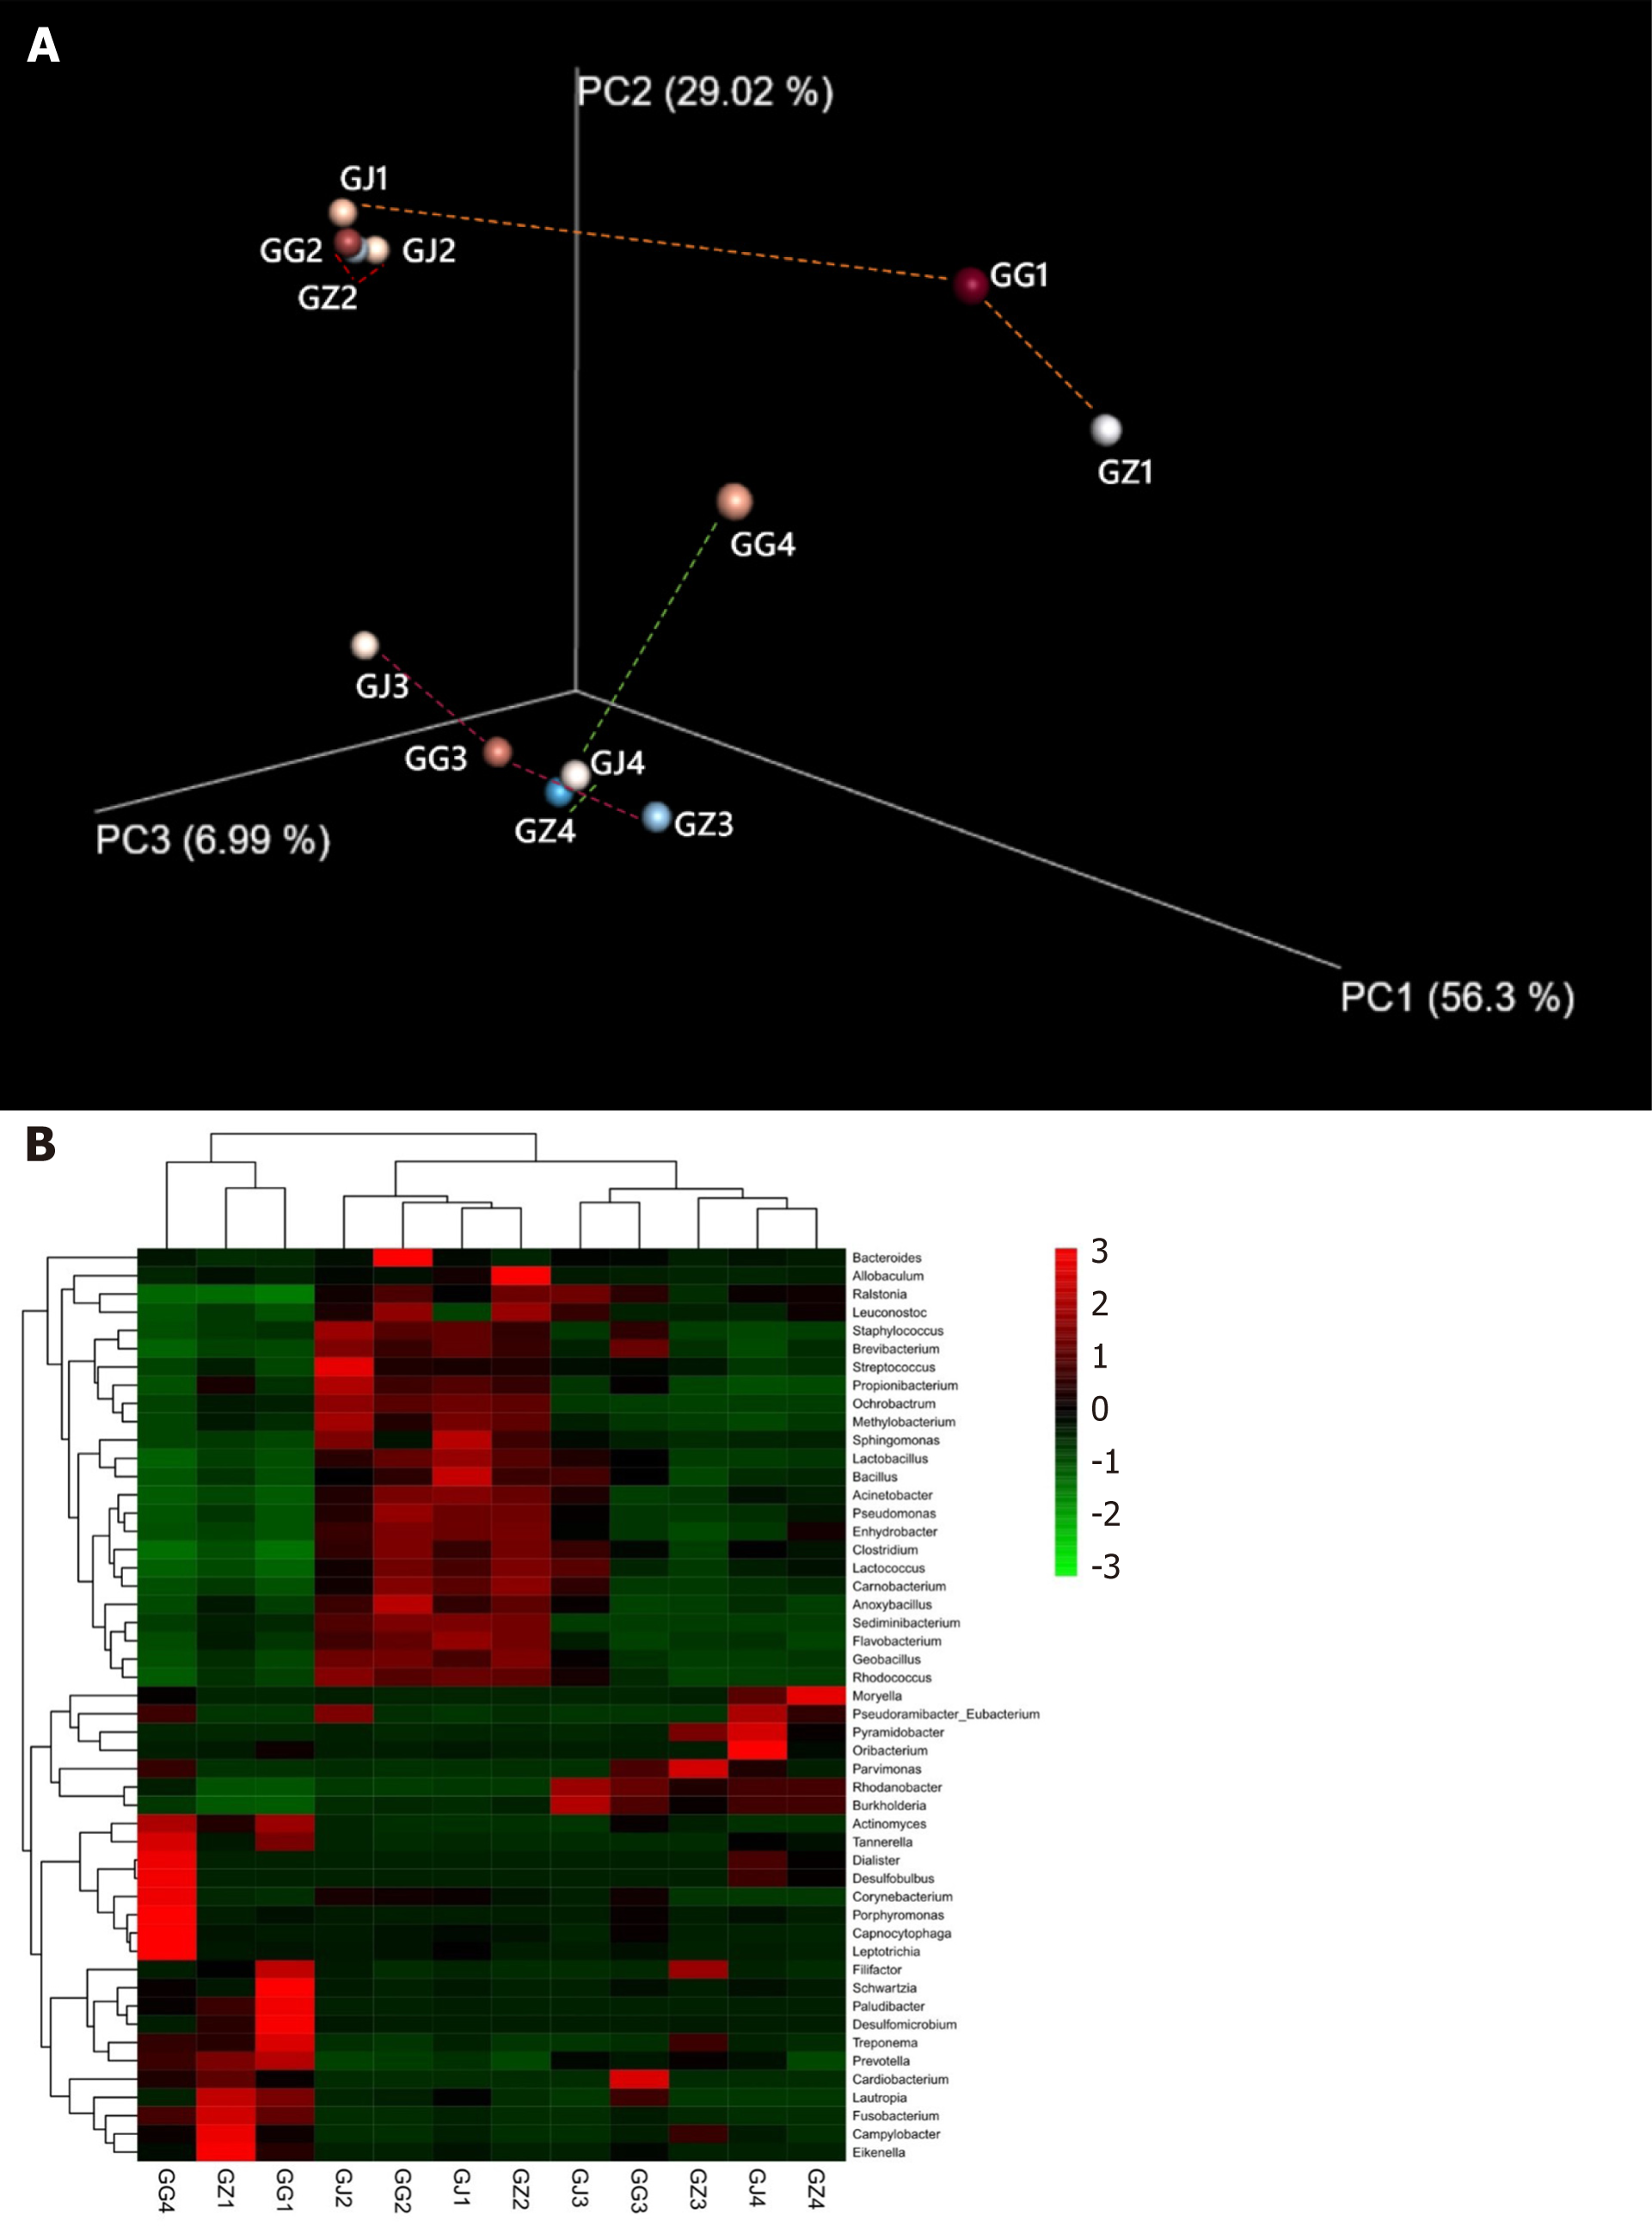
Figure 4 Bacterial community structures.
A: Principal coordinates analysis plot of the phylogenetic distances (Weighted UniFrac) among the segments from 4 infected roots with palatal grooves. Principal coordinates PC1, PC2, and PC3 explained 56.30%, 29.02%, and 6.99% of the overall variance among the samples, respectively. Segments (GJ, GZ, and GG) from the same root (labeled with the same number) are connected with dashed lines. Segment groups differ in their phylogenetic relatedness from being very adjacent or similar (root 2 and 3) to very distant or phylogenetically different (GJ1 and GG4 from root 1 and 4, respectively); B: Cluster and comparison of the samples at the genus level using a gradient heat map (microbiota with the top 50 abundance). GJ: Apical samples; GZ: Middle samples; GG: Cervical samples.
- Citation: Tan XL, Chen X, Fu YJ, Ye L, Zhang L, Huang DM. Diverse microbiota in palatal radicular groove analyzed by Illumina sequencing: Four case reports. World J Clin Cases 2021; 9(23): 6846-6857
- URL: https://www.wjgnet.com/2307-8960/full/v9/i23/6846.htm
- DOI: https://dx.doi.org/10.12998/wjcc.v9.i23.6846


