Copyright
©The Author(s) 2021.
World J Clin Cases. Aug 6, 2021; 9(22): 6566-6574
Published online Aug 6, 2021. doi: 10.12998/wjcc.v9.i22.6566
Published online Aug 6, 2021. doi: 10.12998/wjcc.v9.i22.6566
Figure 1 Imaging before treatment.
A: Axial T2-weighted image shows heterogeneous intensity in the midbrain, and the midbrain aqueduct was compressed; B: Contrast-enhanced magnetic resonance imaging showing a significantly enhanced 1.9 cm × 1.8 cm-sized mass in the left midbrain; C: The lesion had high density on computed tomography; D: Fluorodeoxyglucose positron emission tomography showing that the lesion had increased glucose uptake (arrow). The maximum standardized uptake volume was 7.48.
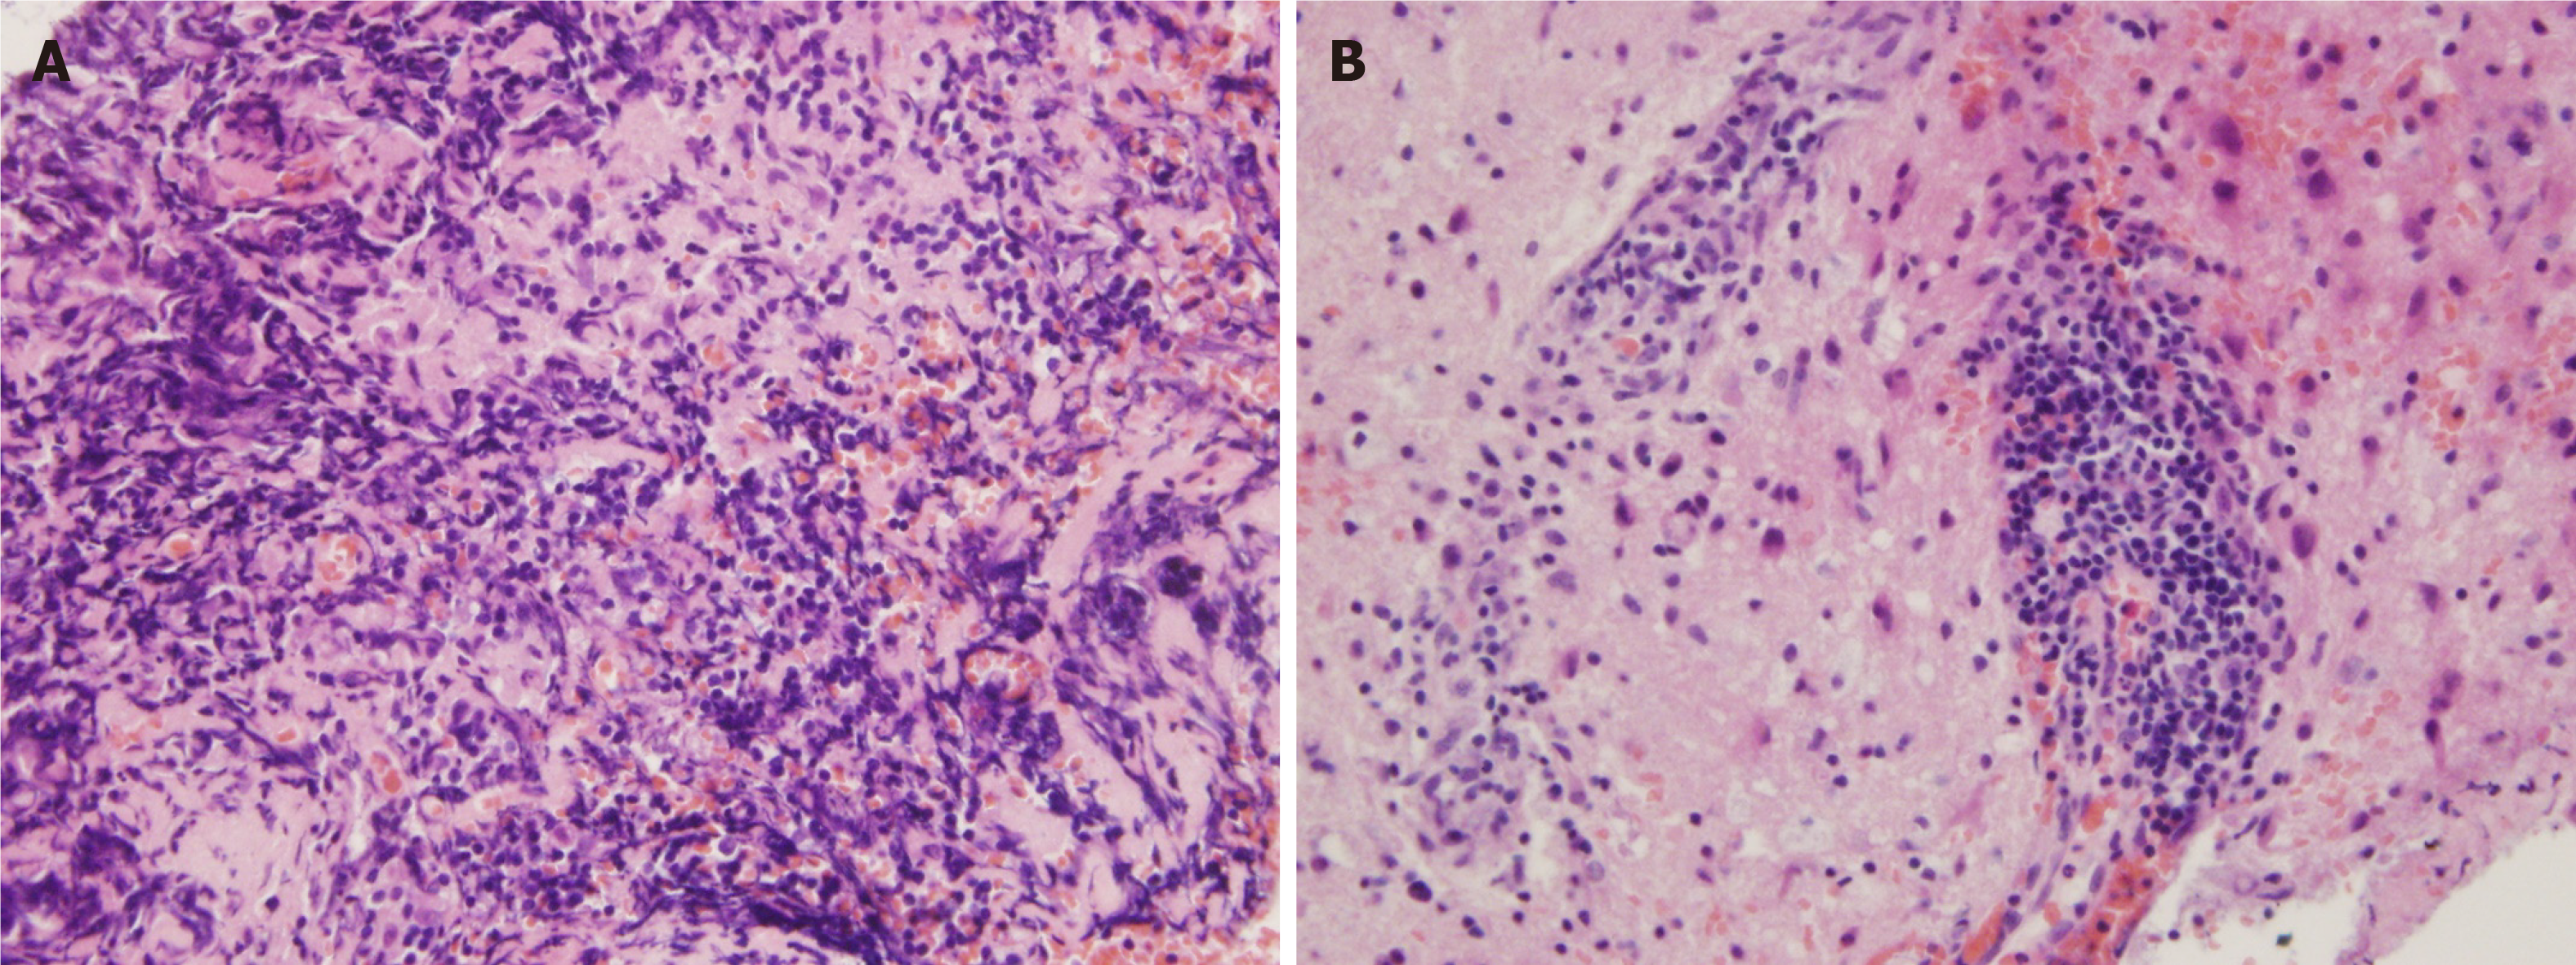
Figure 2 Histologic features.
A biopsy showed perivascular infiltrates of small-sized lymphocytes. A: Hematoxylin and eosin staining, 20 ×; B: Hematoxylin and eosin staining, 40 ×.
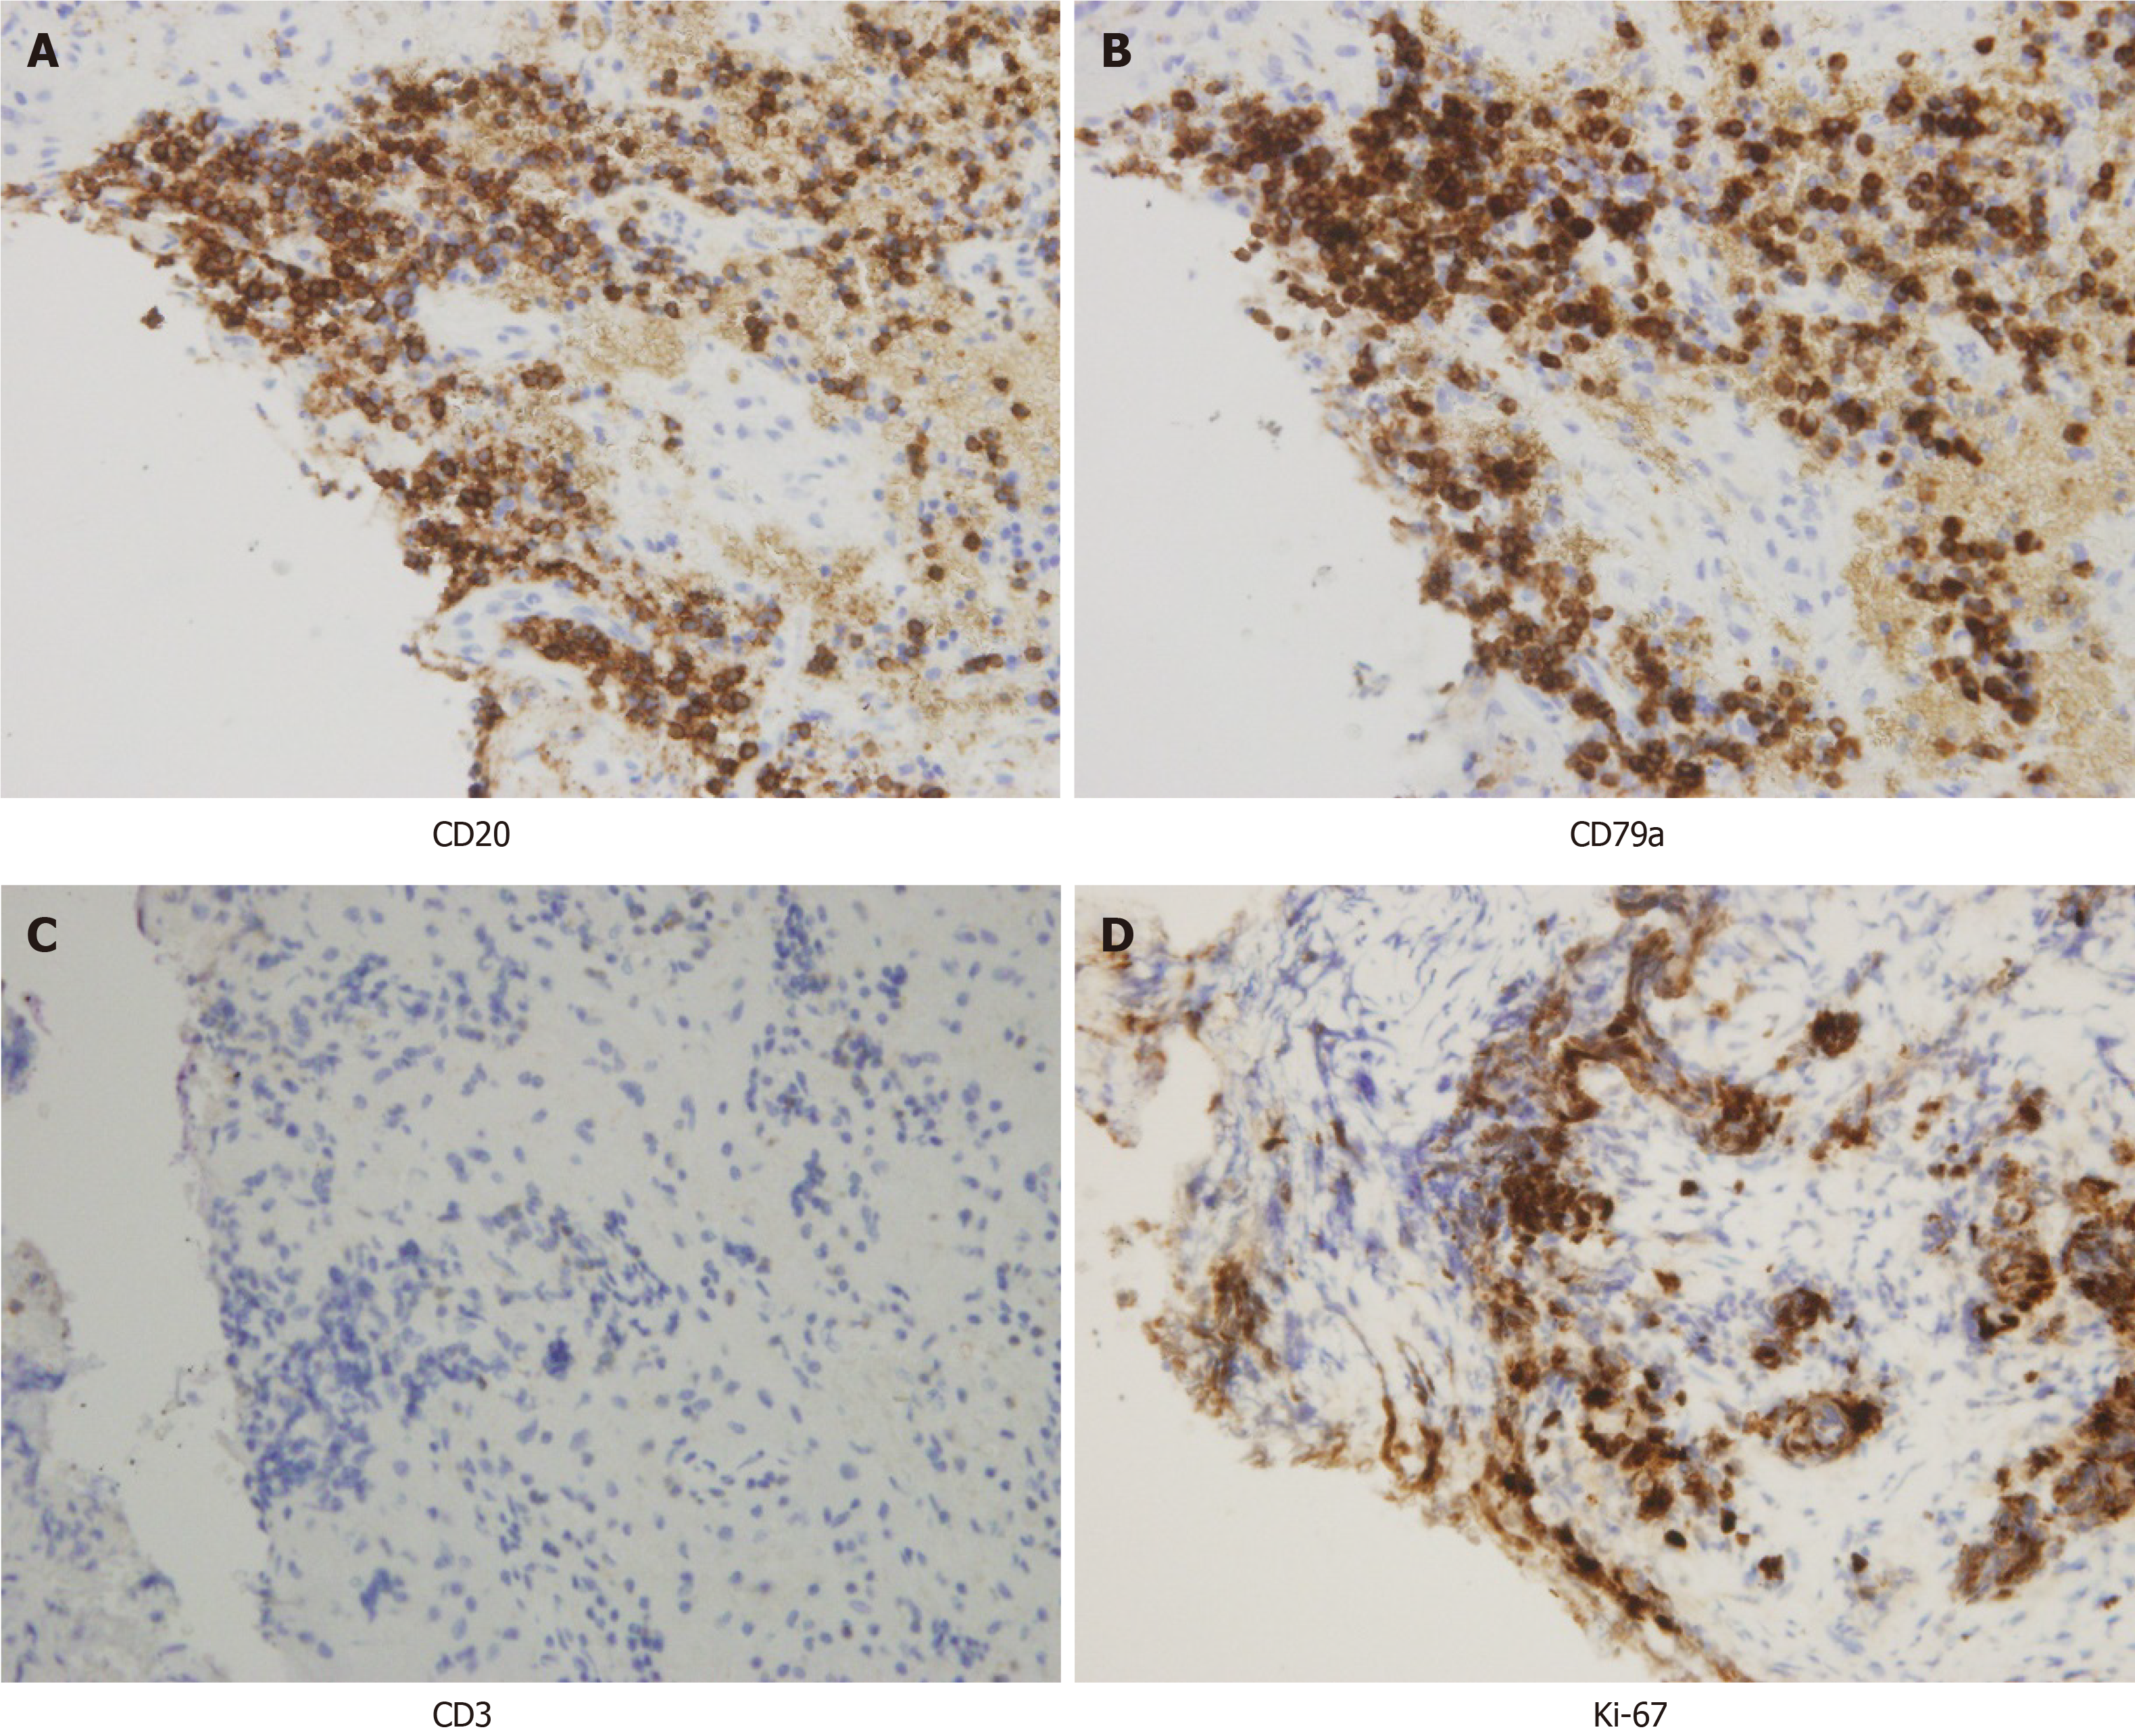
Figure 3 Immunohistochemical features.
The tumor cells were positive for B-lymphocyte marker CD20/CD79a and negative for T-lymphocyte marker CD3. 10%-20% of the cells were positive for Ki-67. A: CD20; B: CD79a; C: CD3; D: Ki-67.
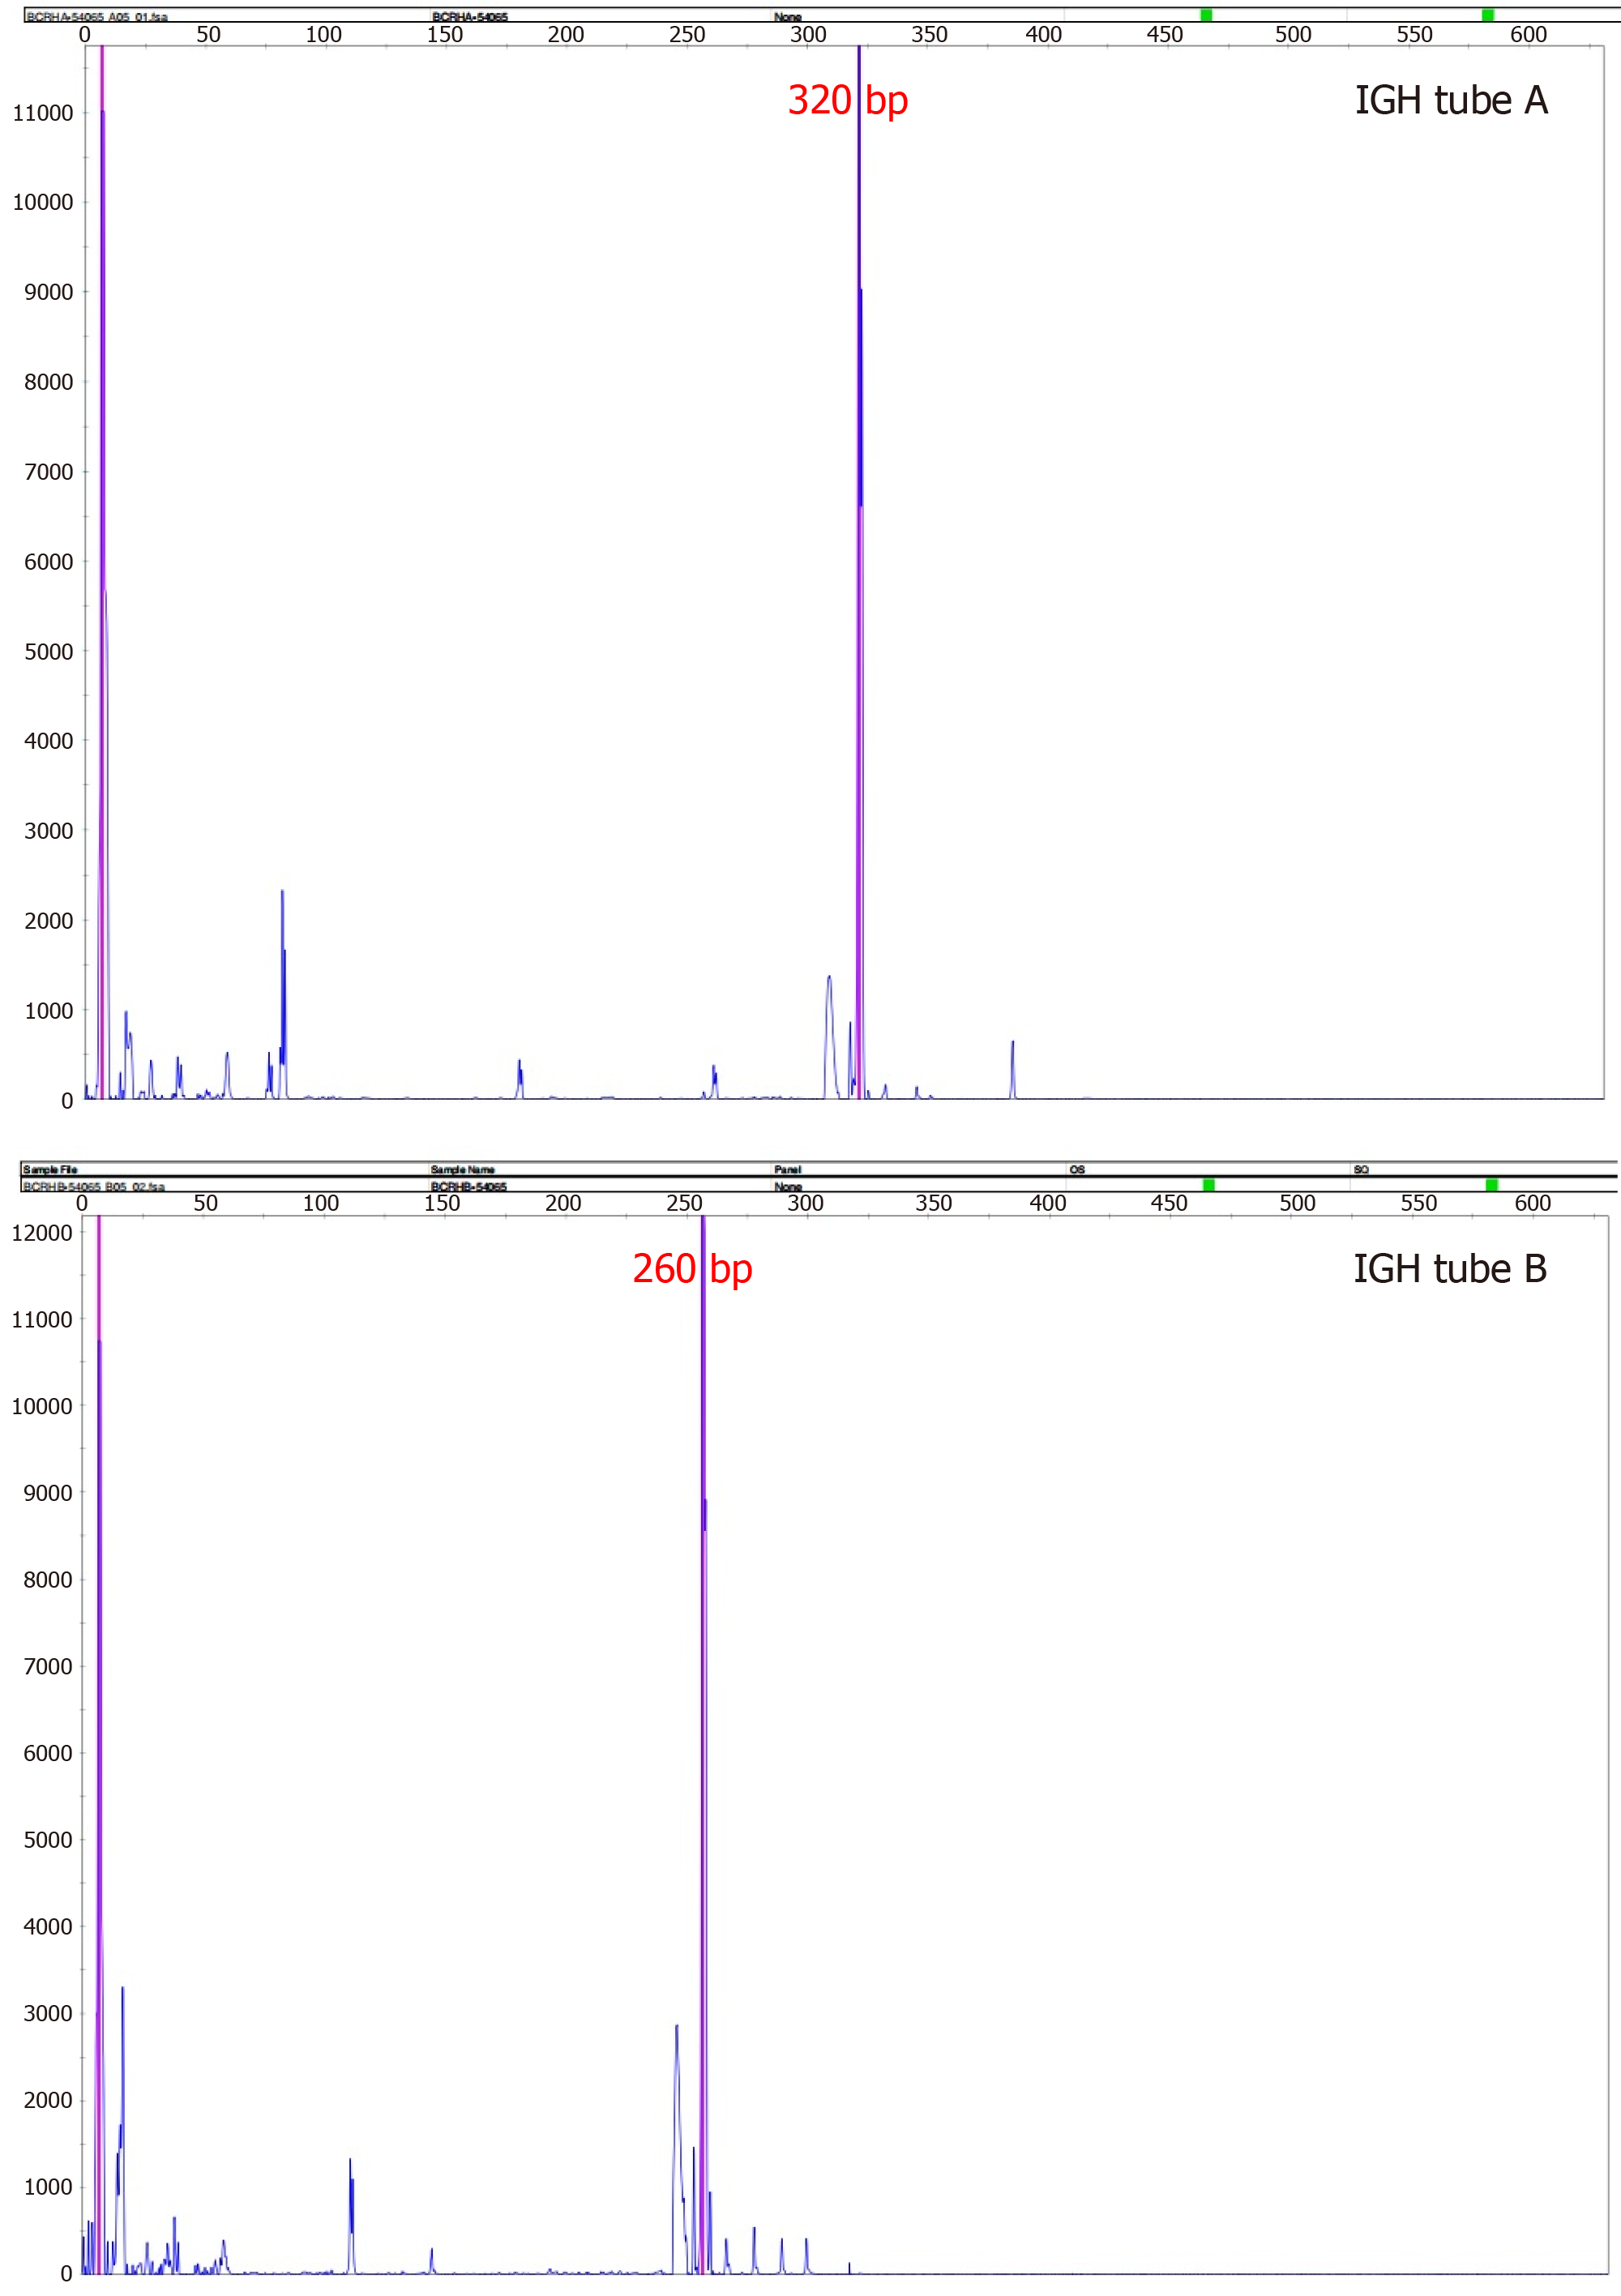
Figure 4 IdentiClone IGH+IGK B-cell clonality polymerase chain reaction test.
The detection of clonal immunoglobulin heavy chain gene rearrangement was positive.
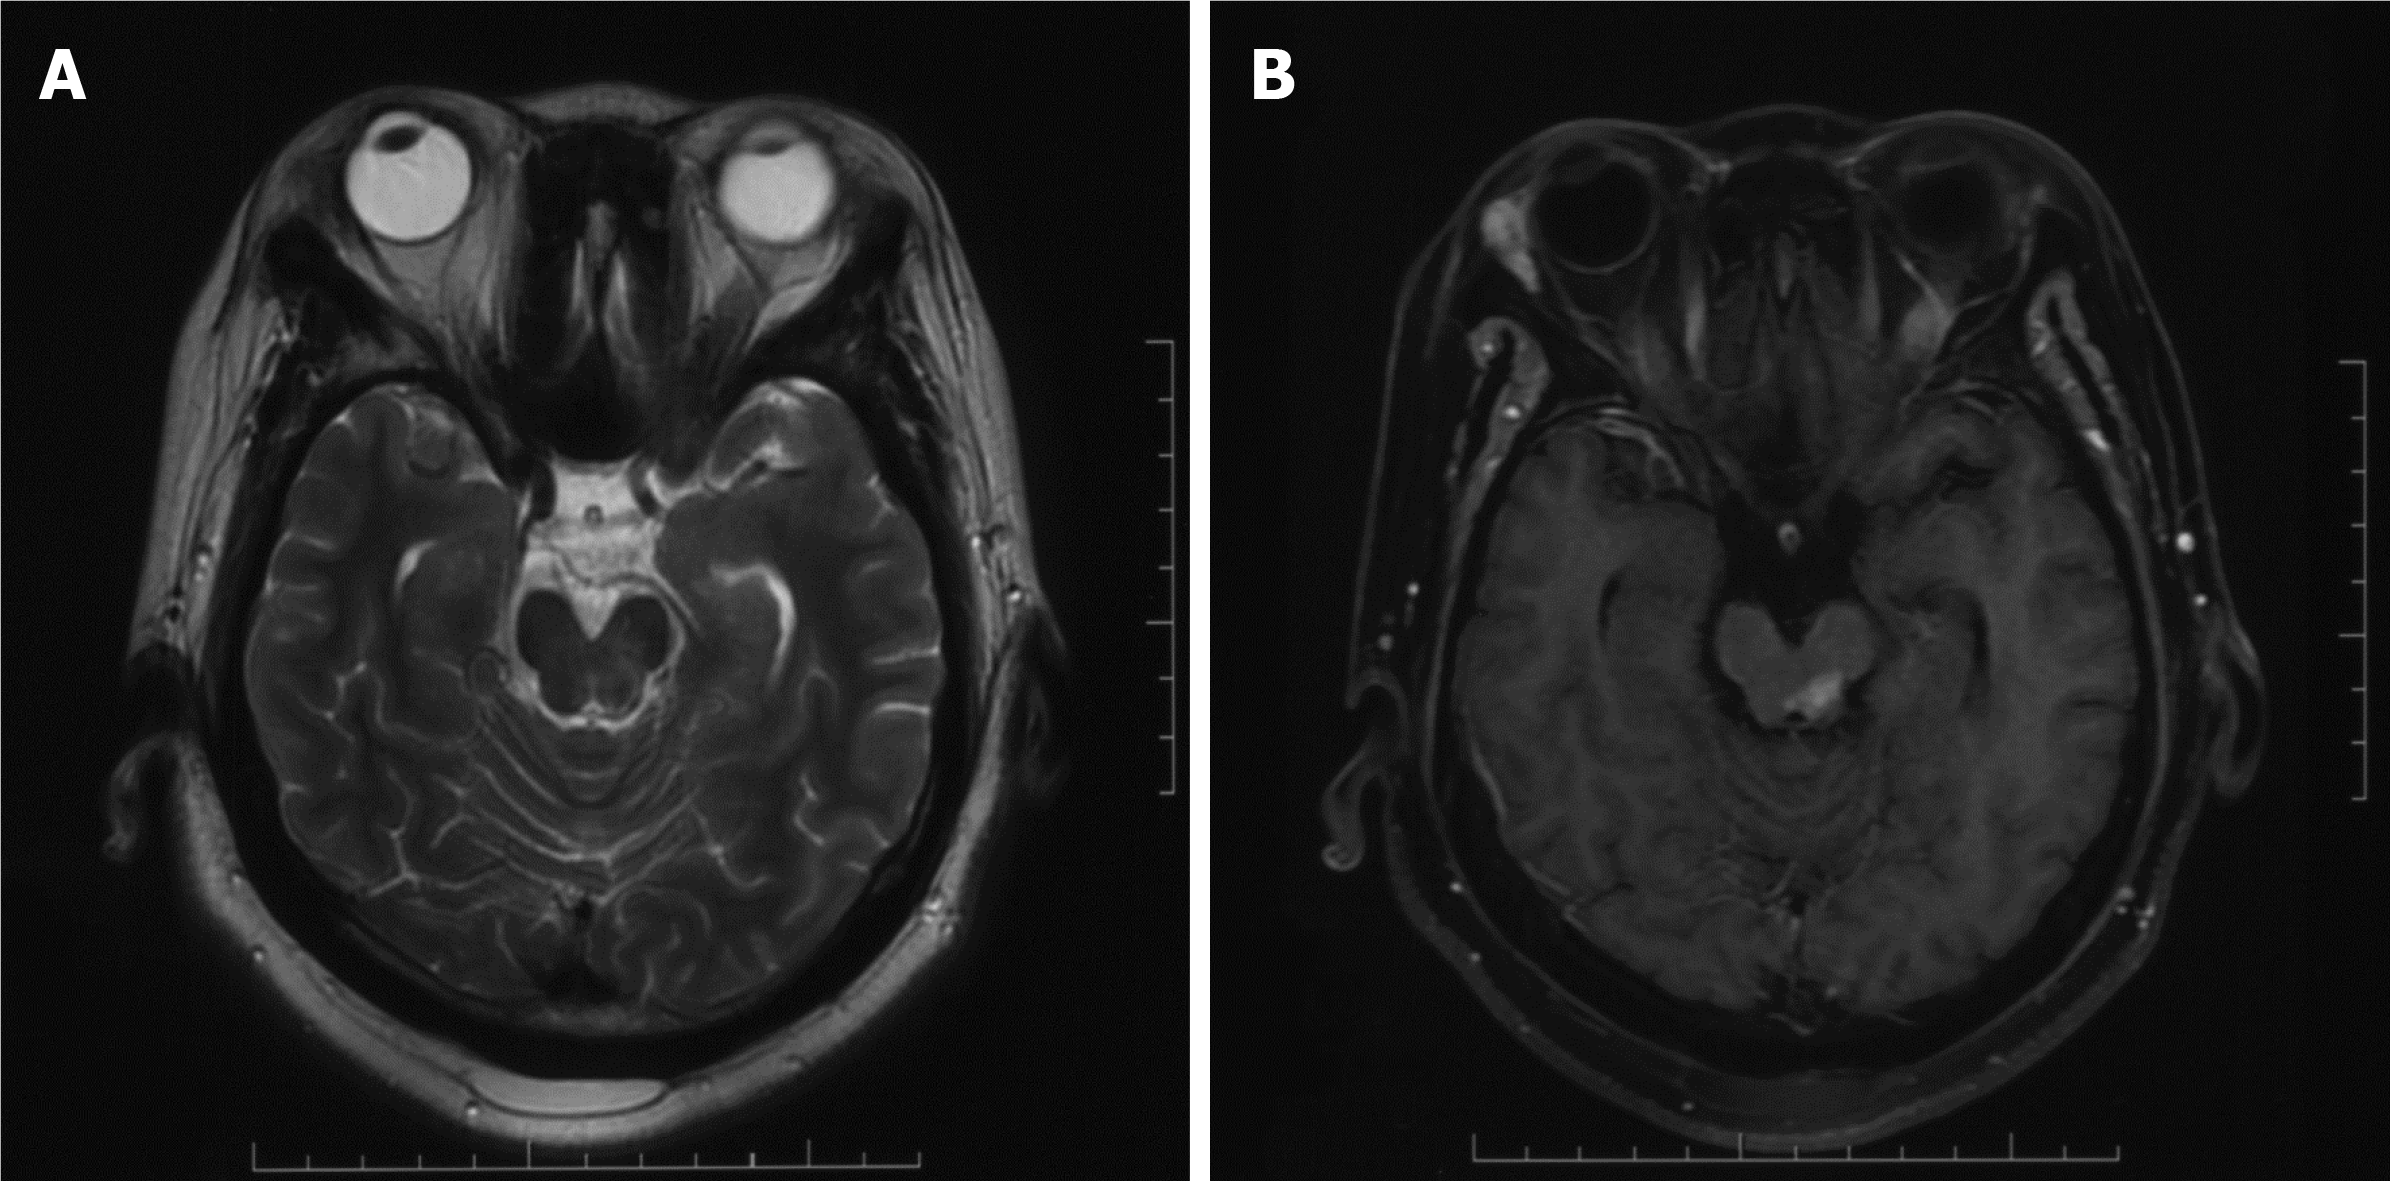
Figure 5 Magnetic resonance imaging reexamination after 20 Gy radiotherapy.
A: T2-weighted image showing mixed signal in the left midbrain; B: Contrast-enhanced magnetic resonance imaging showing residual lesion.
Figure 6 Follow-up magnetic resonance imaging.
A: T2-weighted image showing no mass effect; B: Contrast-enhanced magnetic resonance imaging showing no abnormal enhancement; C and D: Perfusion-weighted imaging showing no abnormal perfusion.
- Citation: Zhao YR, Hu RH, Wu R, Xu JK. Primary mucosa-associated lymphoid tissue lymphoma in the midbrain: A case report. World J Clin Cases 2021; 9(22): 6566-6574
- URL: https://www.wjgnet.com/2307-8960/full/v9/i22/6566.htm
- DOI: https://dx.doi.org/10.12998/wjcc.v9.i22.6566


