Copyright
©The Author(s) 2021.
World J Clin Cases. Aug 6, 2021; 9(22): 6450-6456
Published online Aug 6, 2021. doi: 10.12998/wjcc.v9.i22.6450
Published online Aug 6, 2021. doi: 10.12998/wjcc.v9.i22.6450
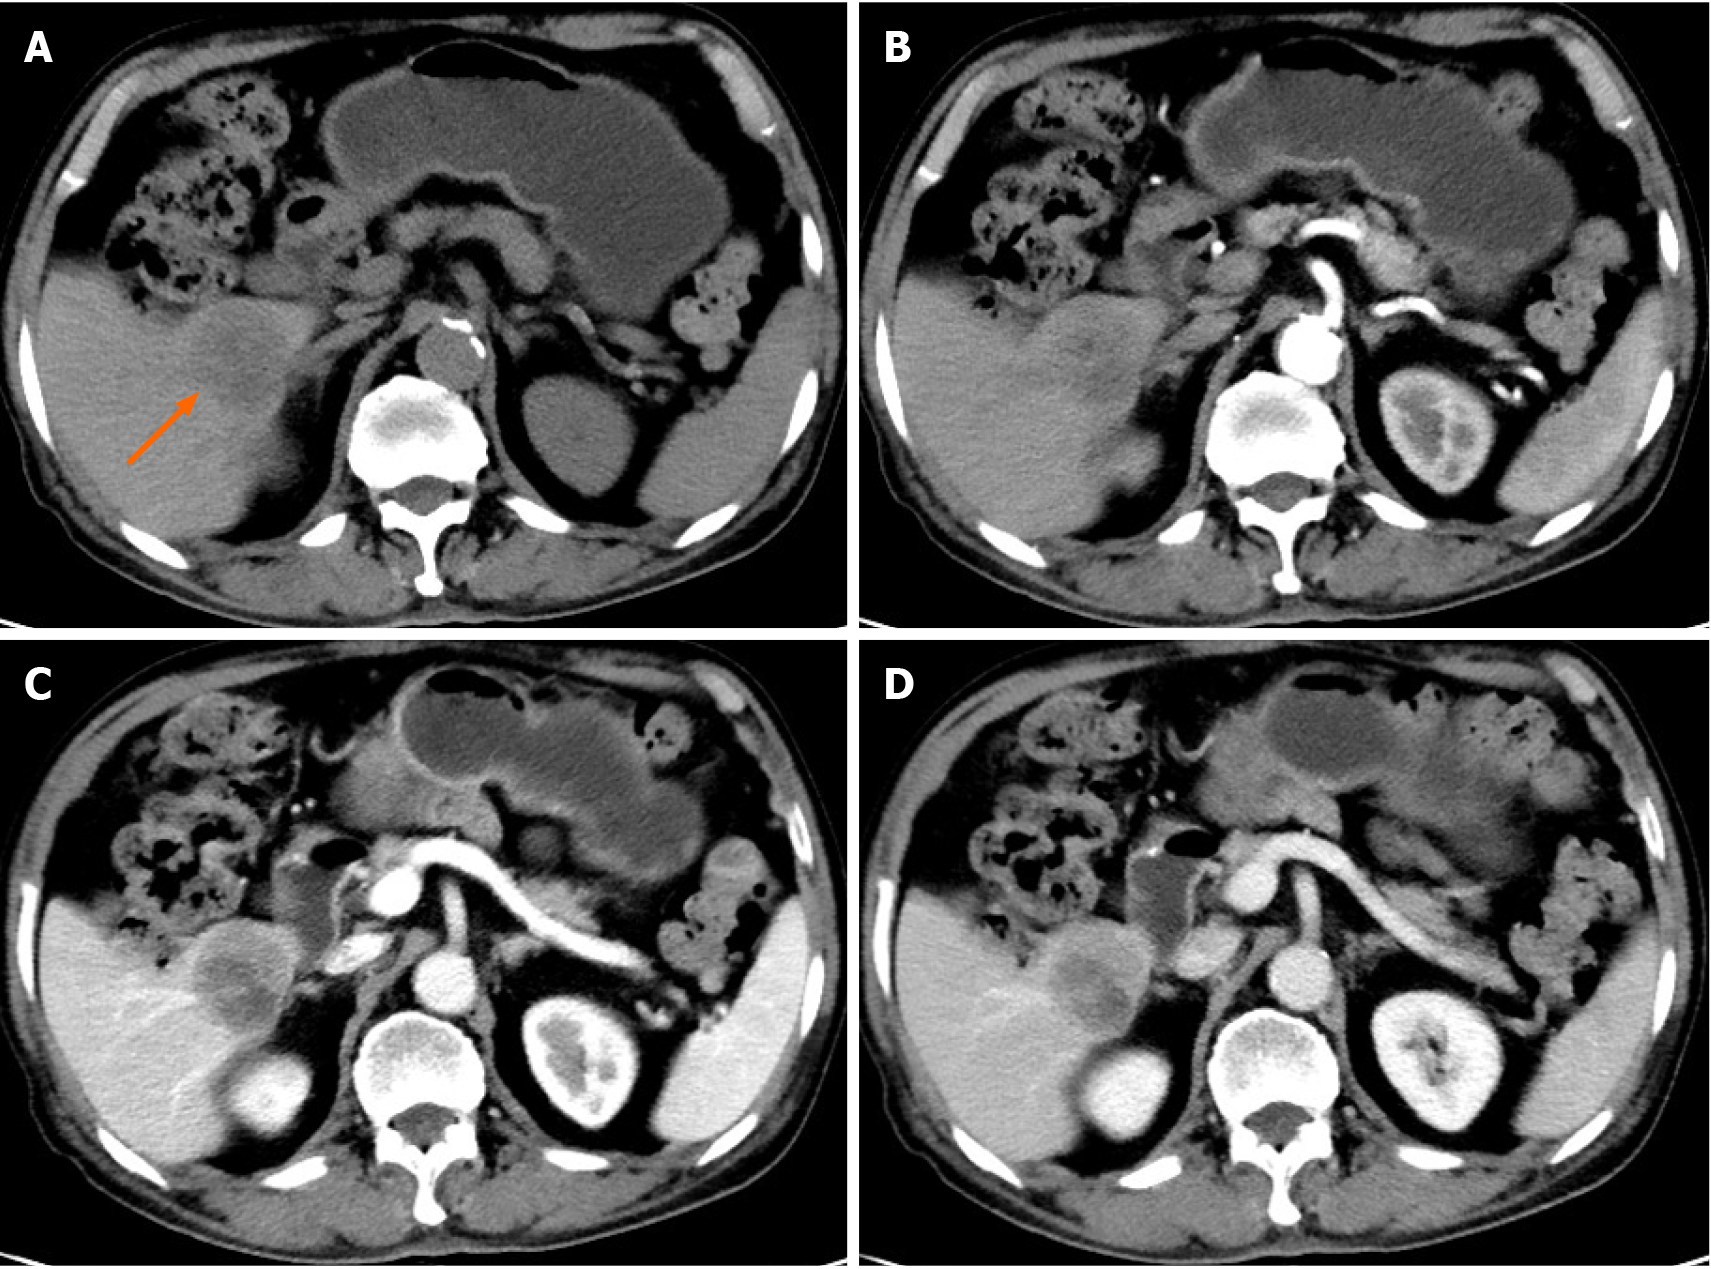
Figure 1 Contrast-enhanced computed tomography images of the tumor.
A: Non-contrast-enhanced computed tomography (CT) images reveal a 40 mm × 37 mm, well-circumscribed, heterogeneous hypoattenuating mass in the right lower lobe of the liver (arrow); B-D: Dynamic CT images demonstrate a rim-like enhancement of the tumor in the arterial phase (B); portal venous phase (C); and equilibrium phase (D). The tumor is less enhanced than the adjacent liver.
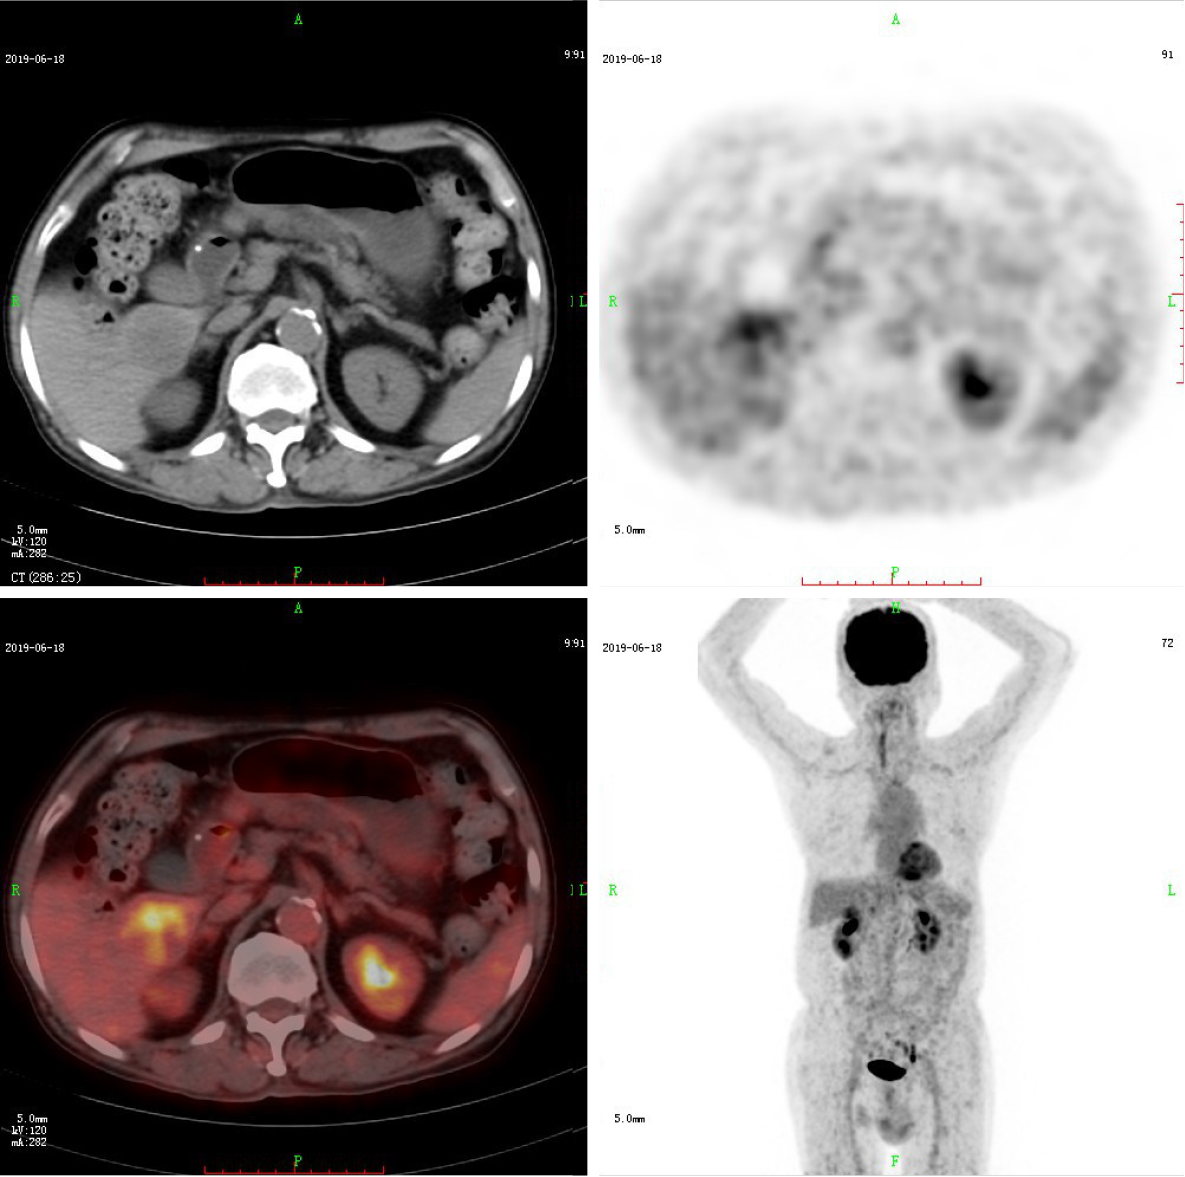
Figure 2 Positron emission tomography (PET) with 2-deoxy-2-[fluorine-18] fluoro-D-glucose images.
On 18F-positron emission tomography/com
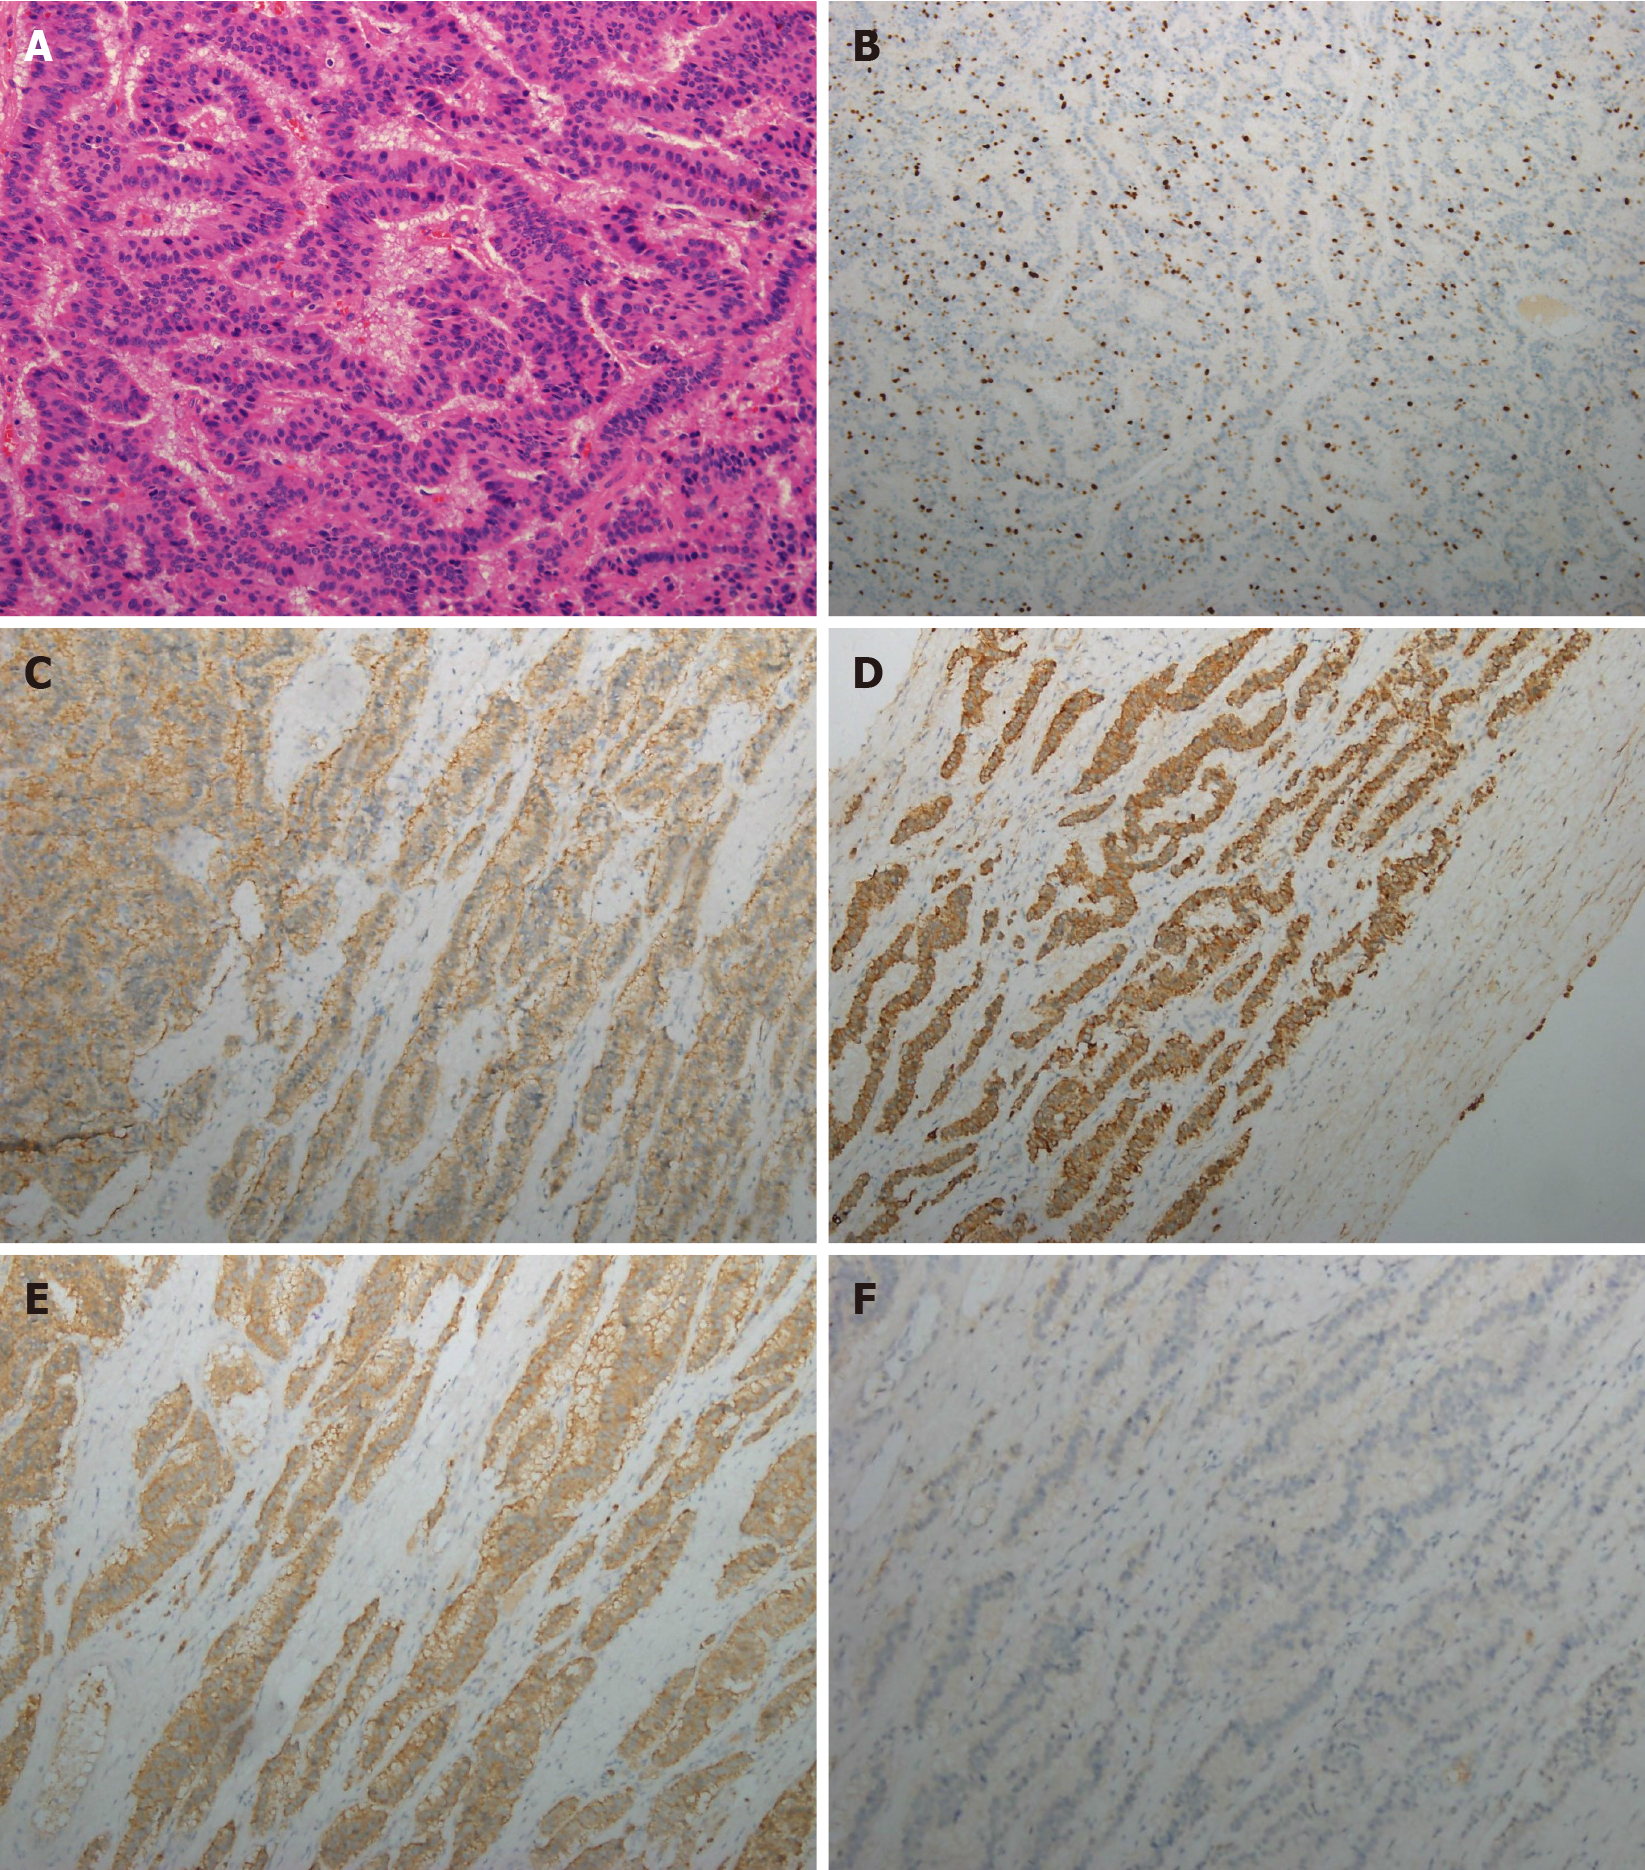
Figure 3 Pathological findings.
A: Hematoxylin and eosin-stained sections (× 200 magnification) demonstrate a well-differentiated neoplasm with the trabecular and glandular architectural pattern; B: The Ki-67 proliferation index (× 100 magnification) is 15% in tumor cells; C-F: Immunohistochemical staining (× 100 magnification) reveals positive immunoreactivities for CD56 (C), cytokeratin AE1/AE3 (D), synaptophysin (E), and negative immunoreactivity for chromogranin A (F), respectively.
- Citation: Rao YY, Zhang HJ, Wang XJ, Li MF. Primary hepatic neuroendocrine tumor — 18F-fluorodeoxyglucose positron emission tomography/computed tomography findings: A case report. World J Clin Cases 2021; 9(22): 6450-6456
- URL: https://www.wjgnet.com/2307-8960/full/v9/i22/6450.htm
- DOI: https://dx.doi.org/10.12998/wjcc.v9.i22.6450


