Copyright
©The Author(s) 2021.
World J Clin Cases. Aug 6, 2021; 9(22): 6357-6379
Published online Aug 6, 2021. doi: 10.12998/wjcc.v9.i22.6357
Published online Aug 6, 2021. doi: 10.12998/wjcc.v9.i22.6357
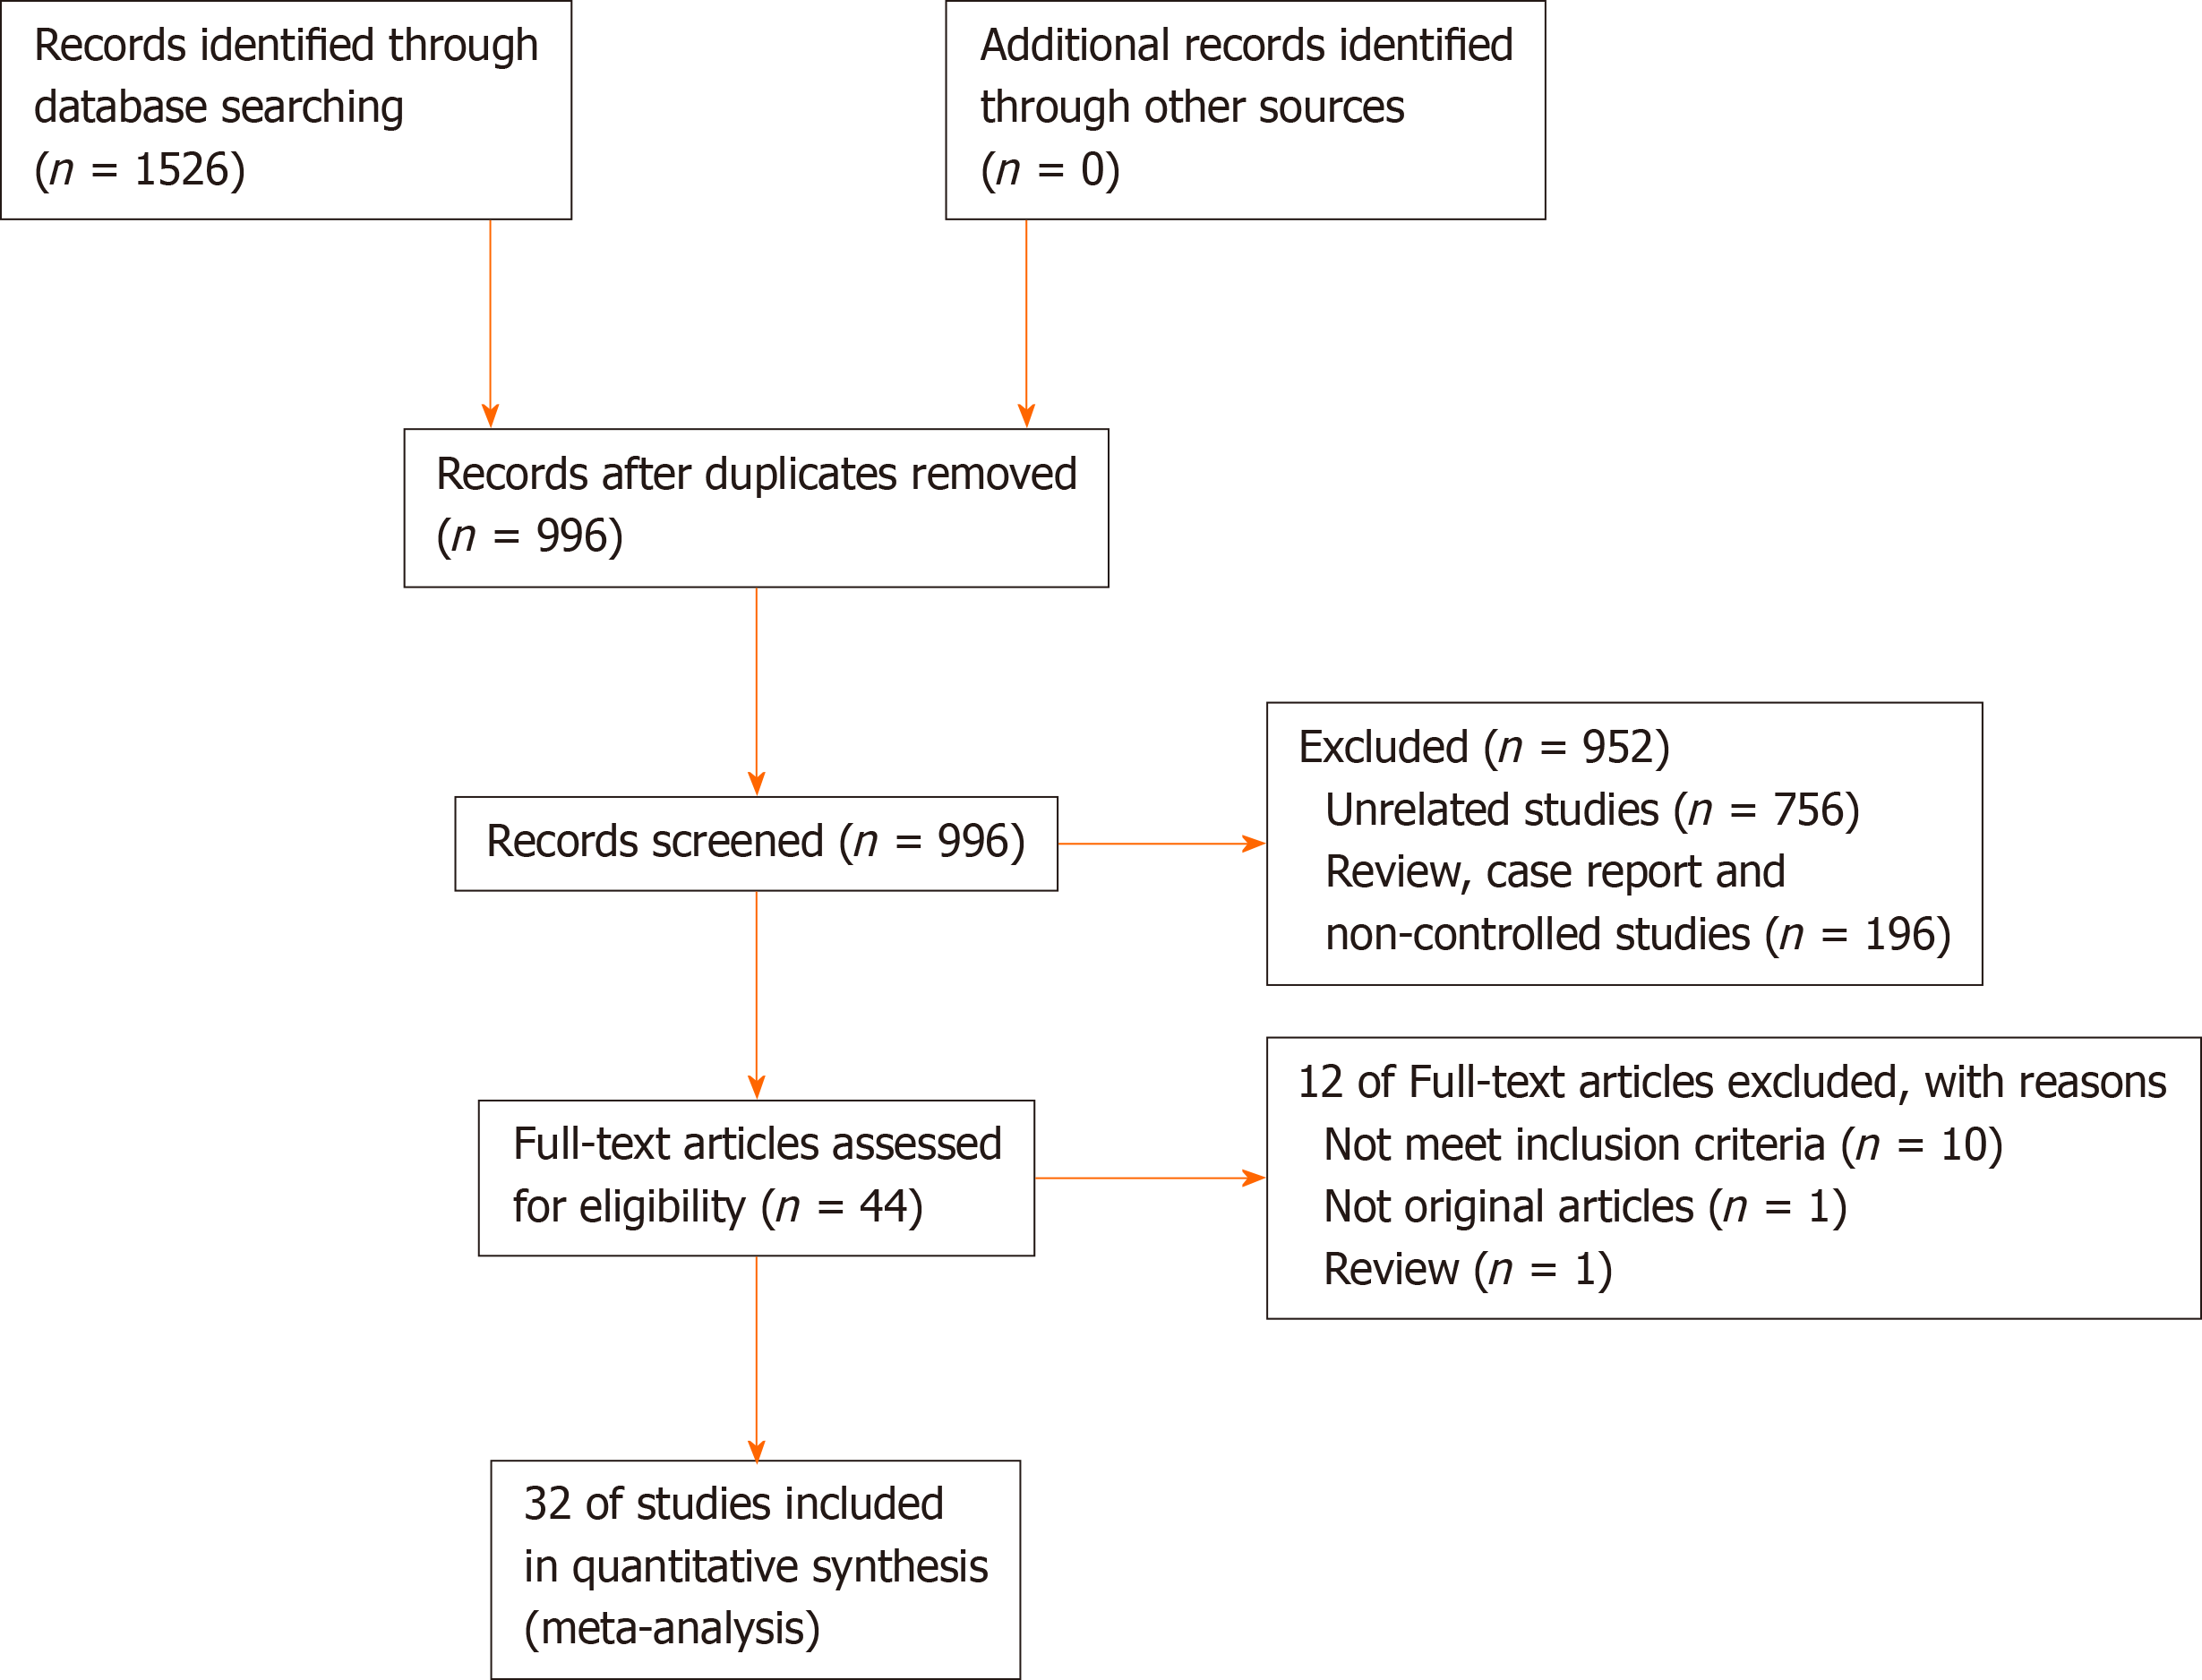
Figure 1 Study identification and selection flow.
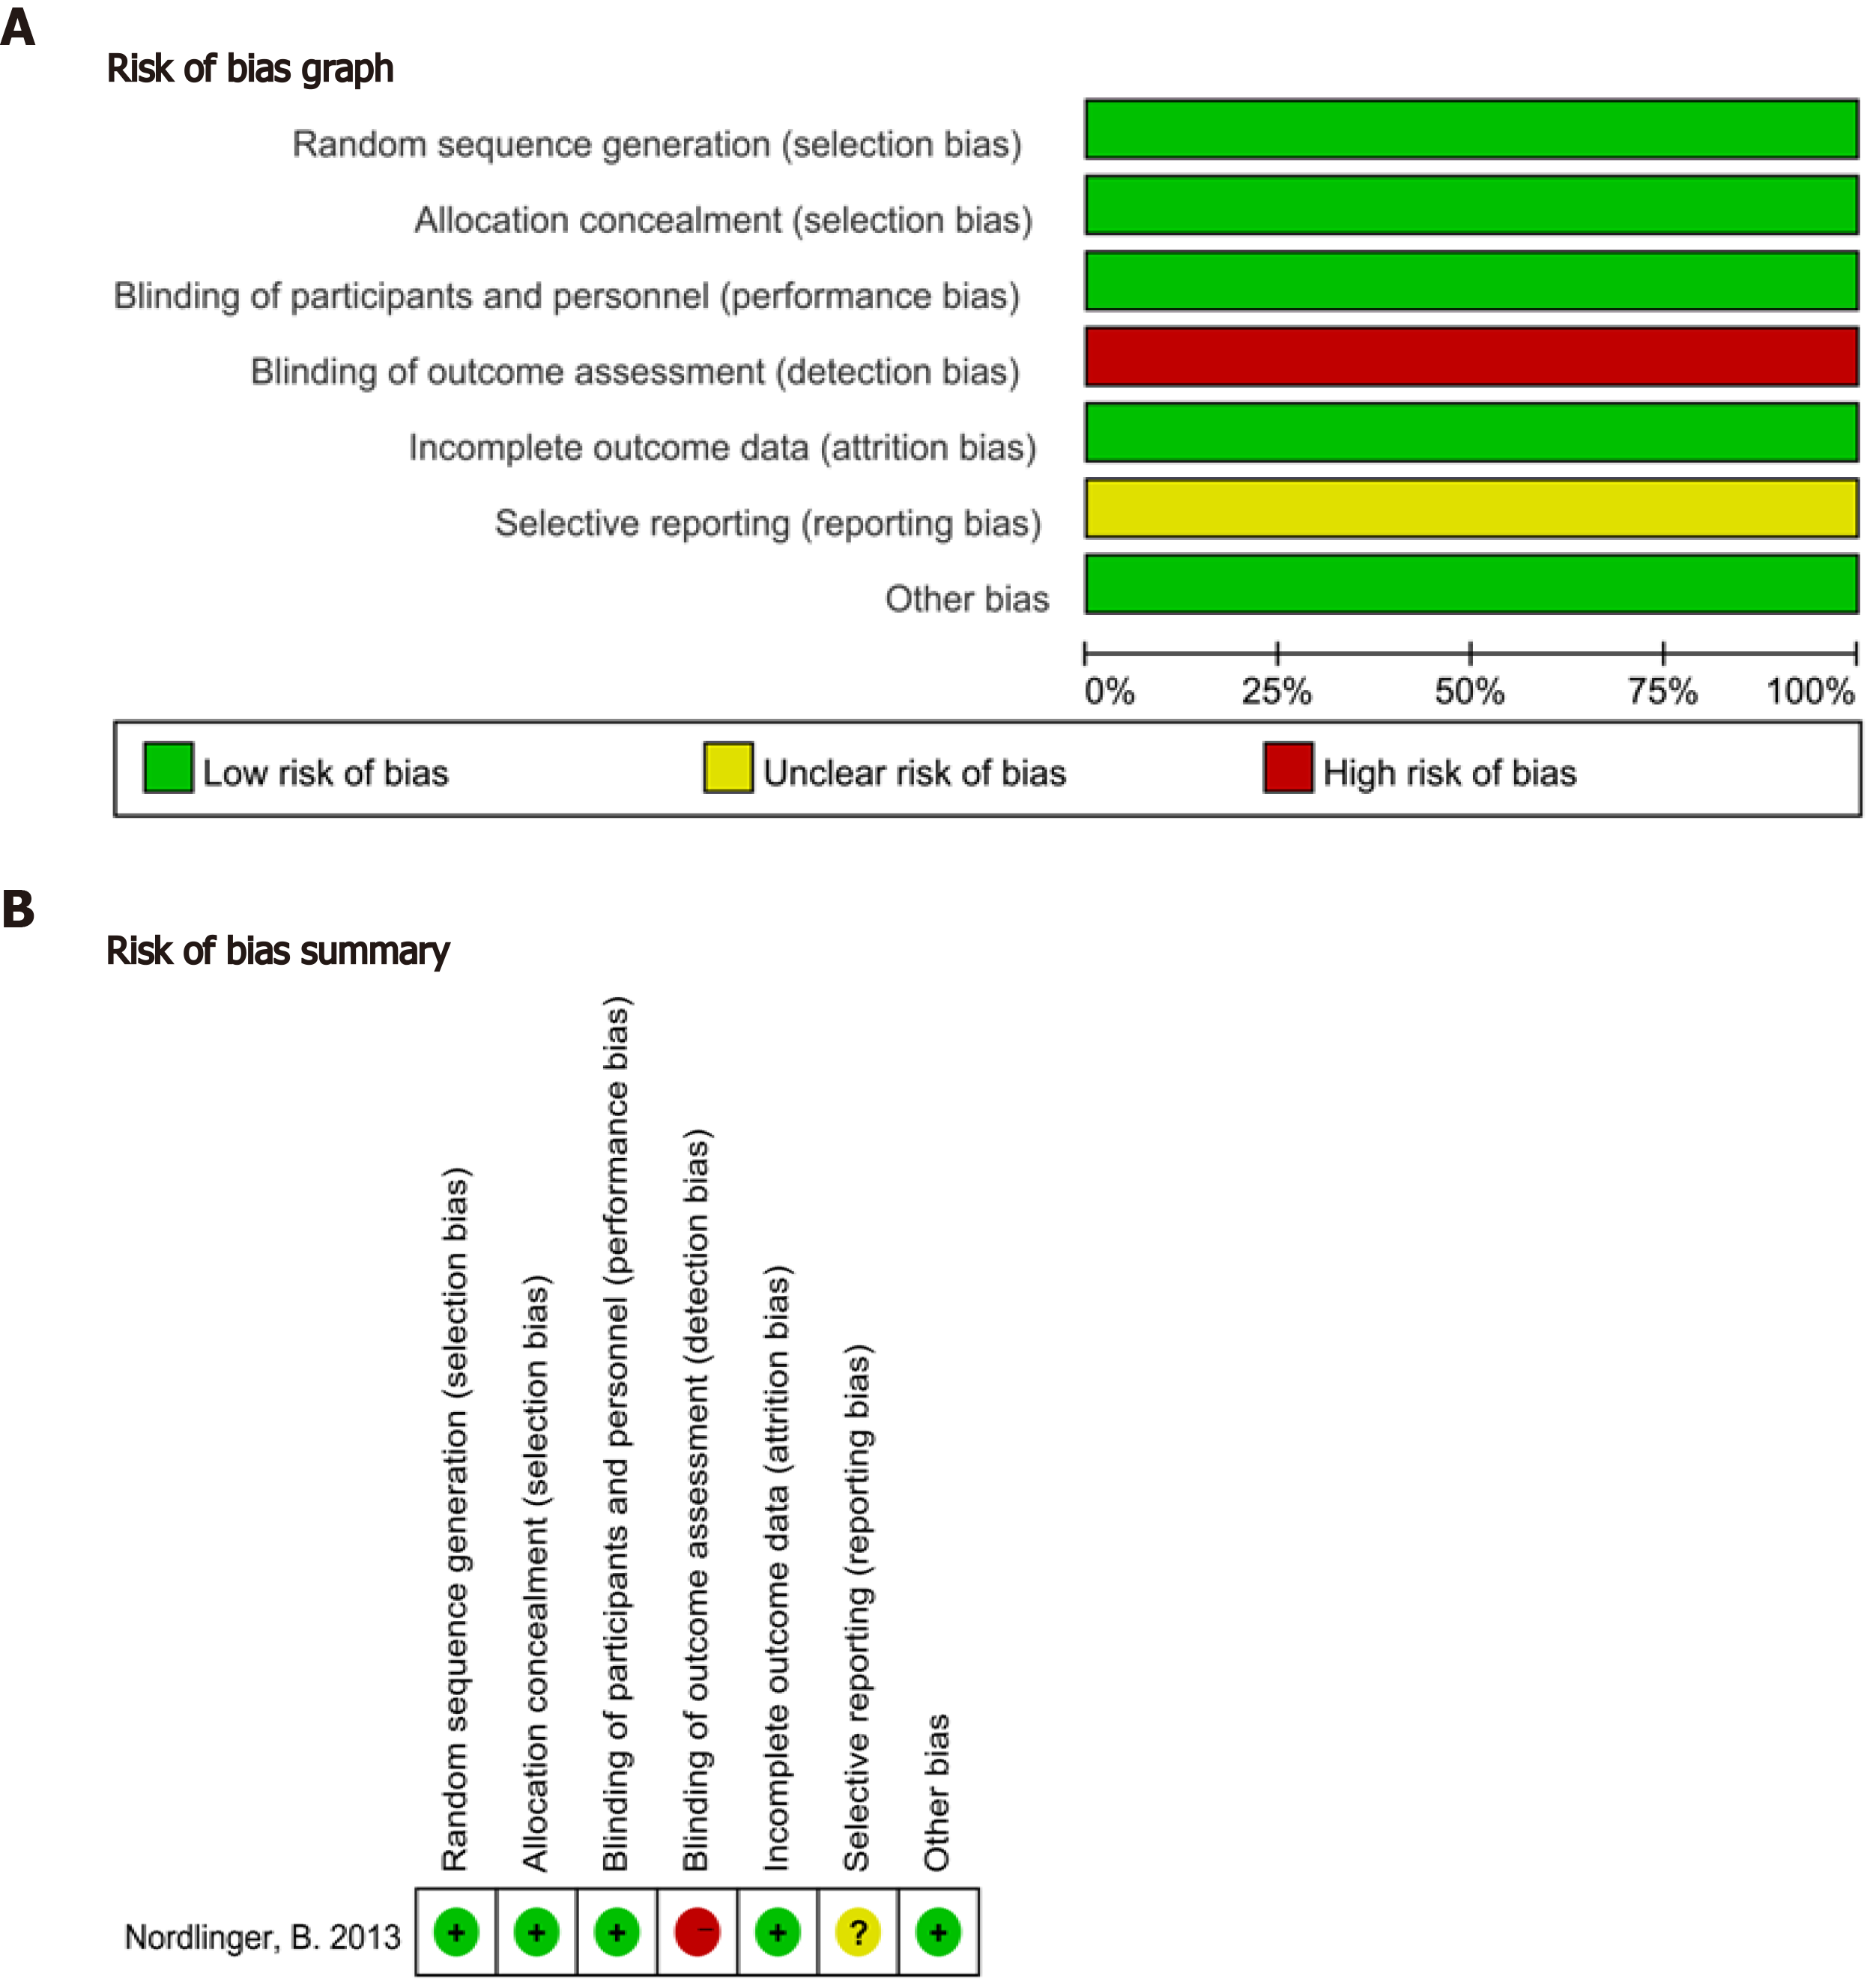
Figure 2 Quality assessment of 1 randomized controlled trial.
A: Risk of bias graph; B: Risk of bias summary.
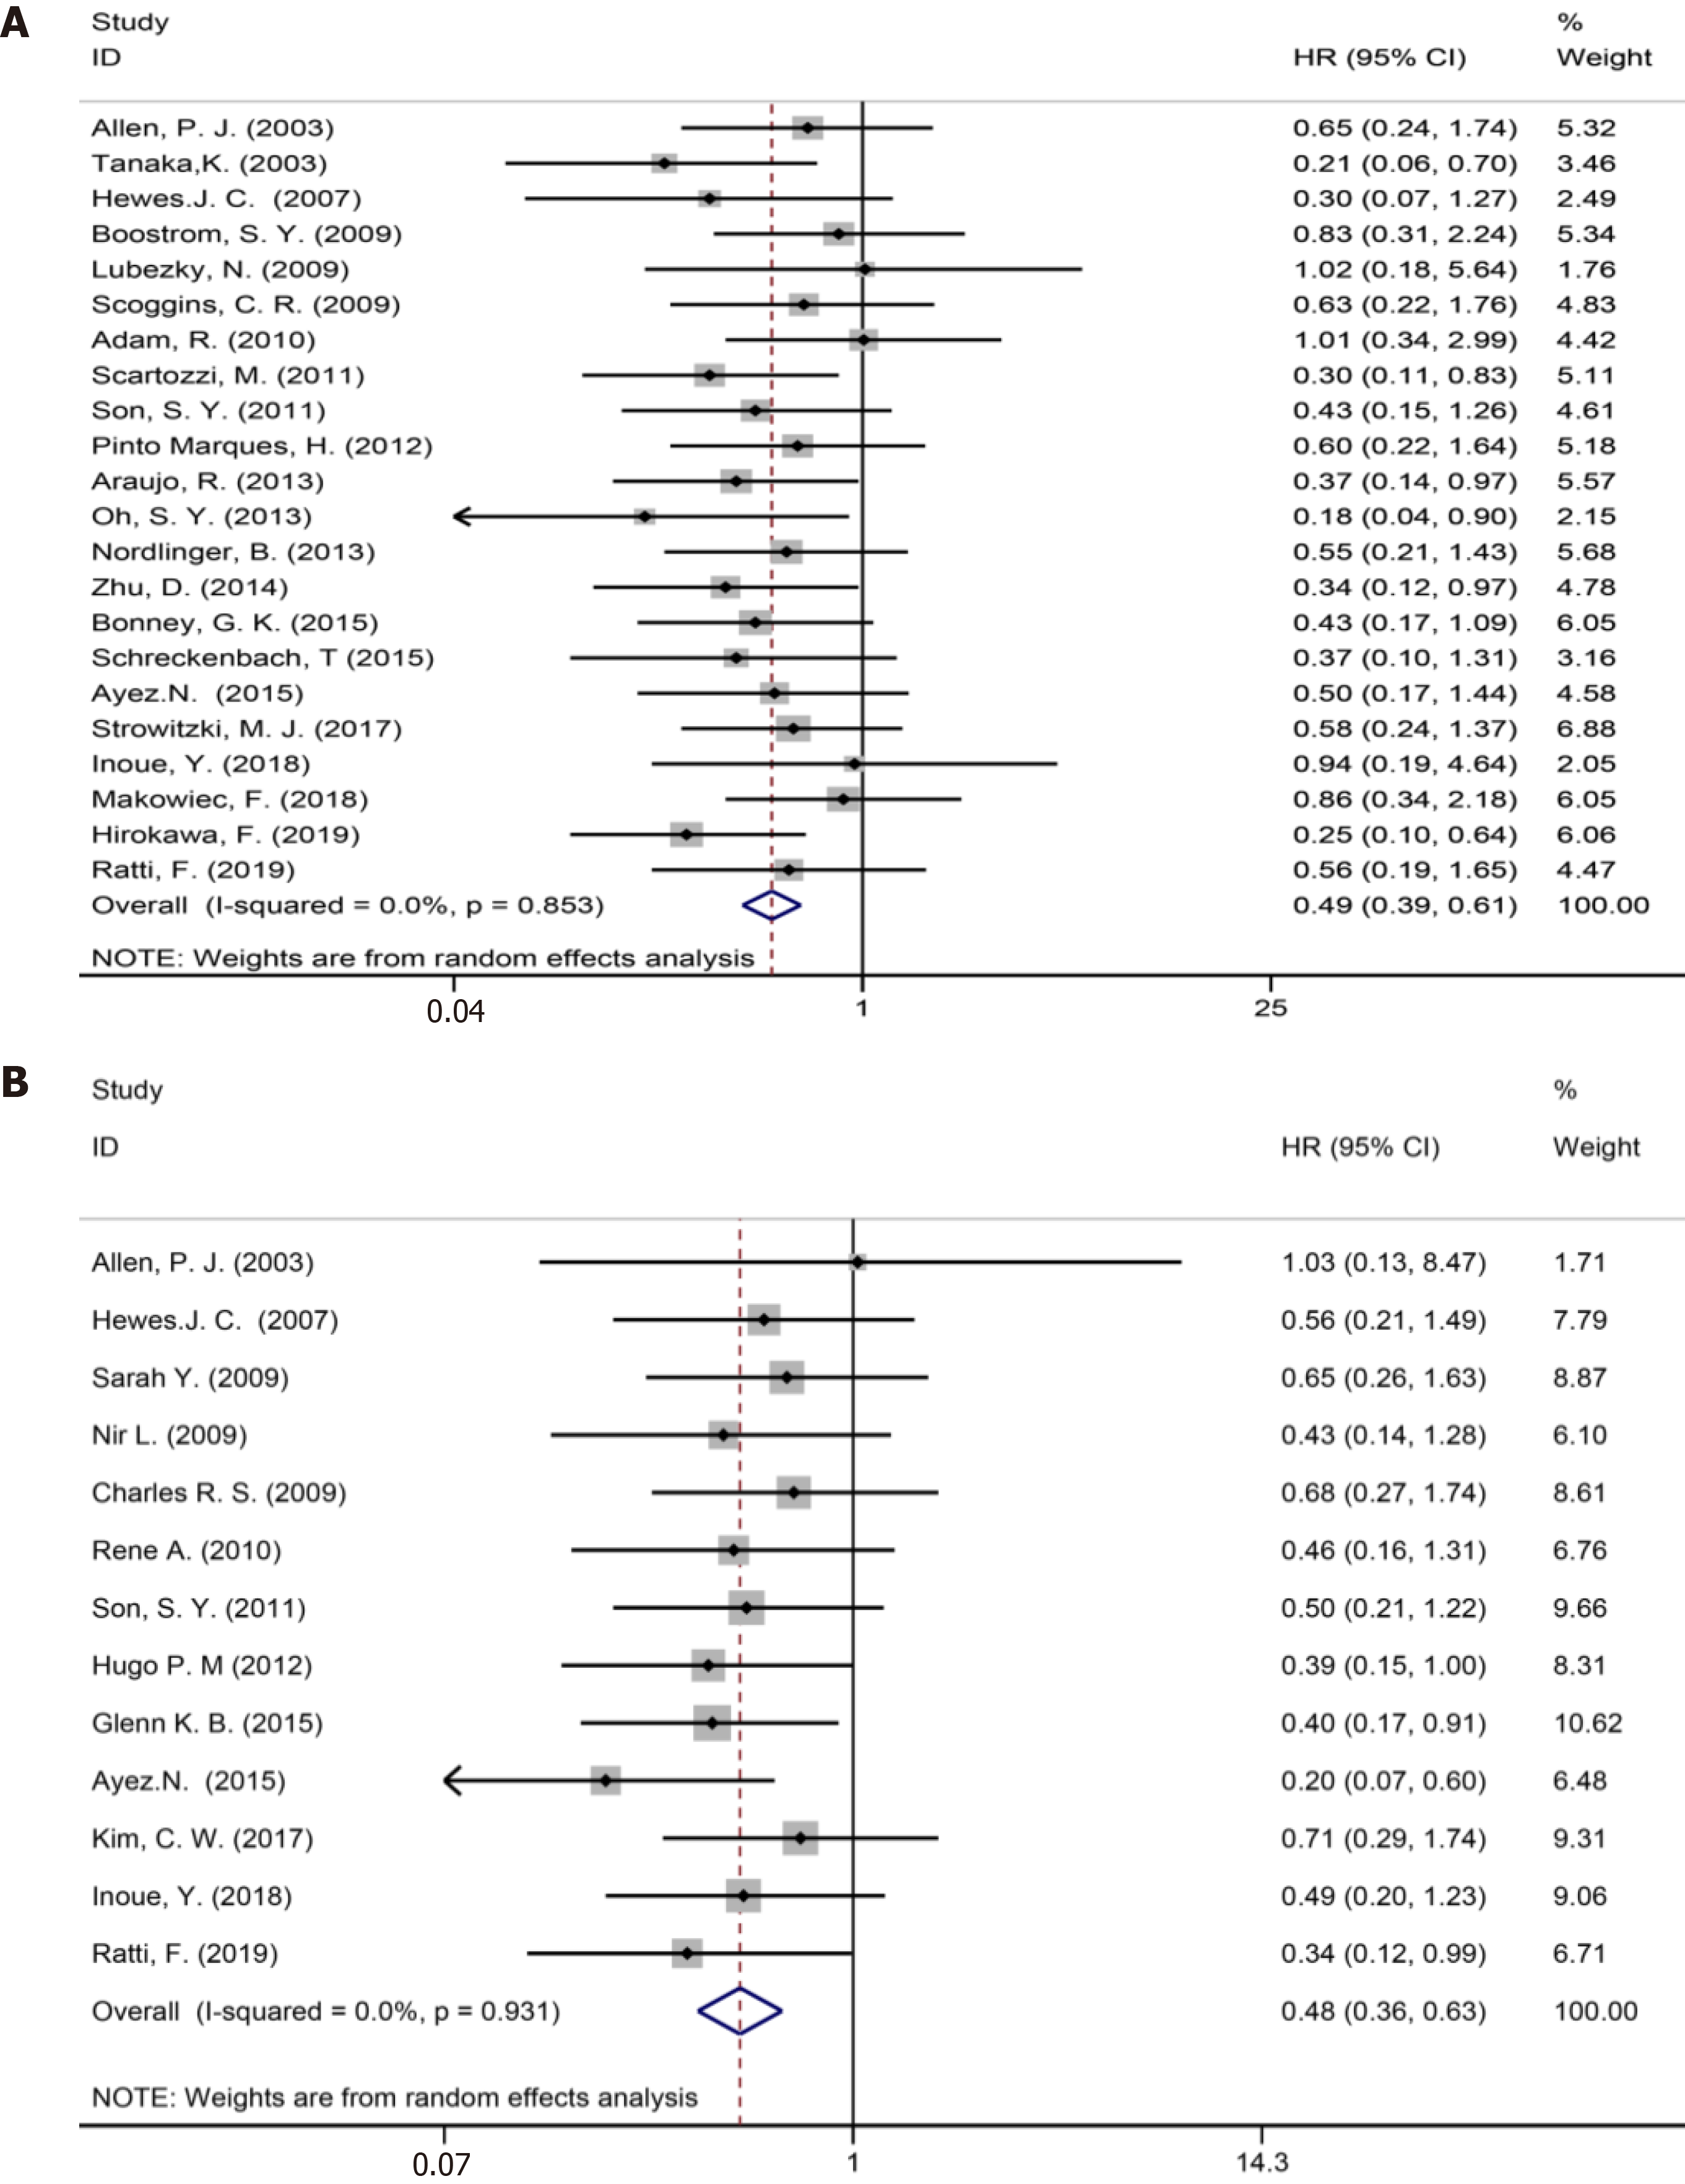
Figure 3 Result of 5-year overall survival and disease-free survival.
A: 5-year overall survival for all patients and two groups; B: 5-year disease-free survival for all patients and two groups.
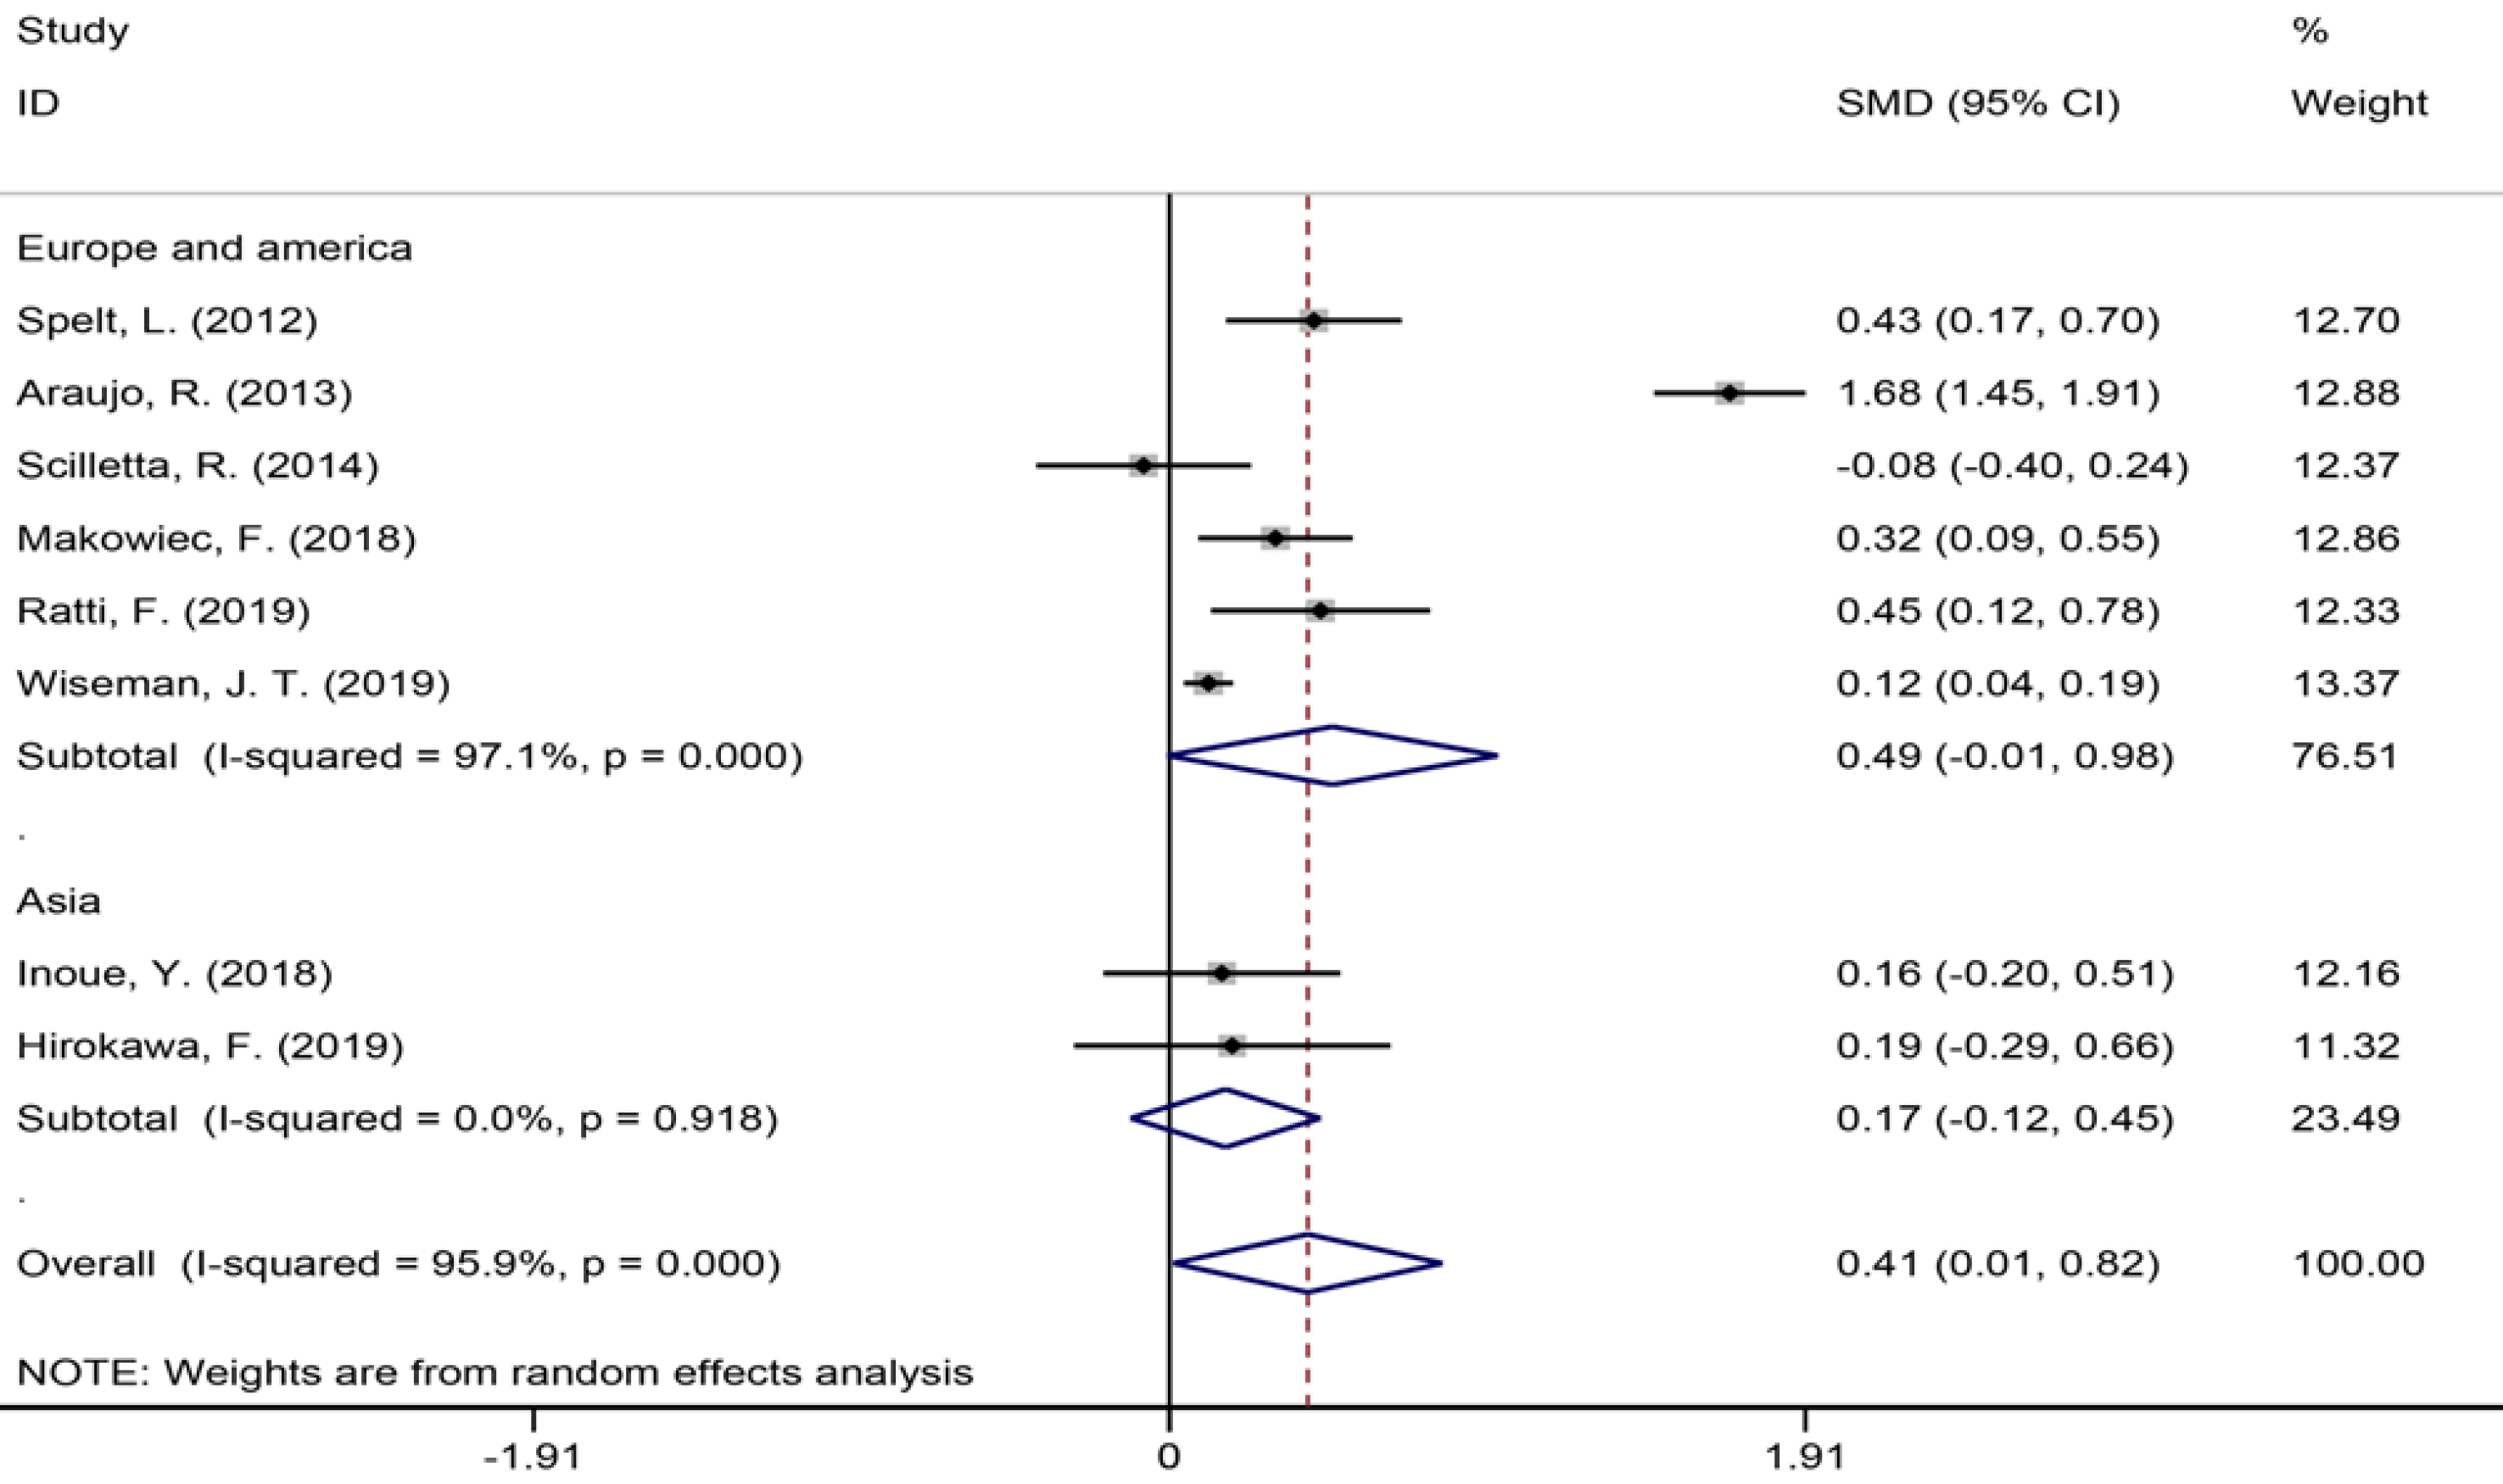
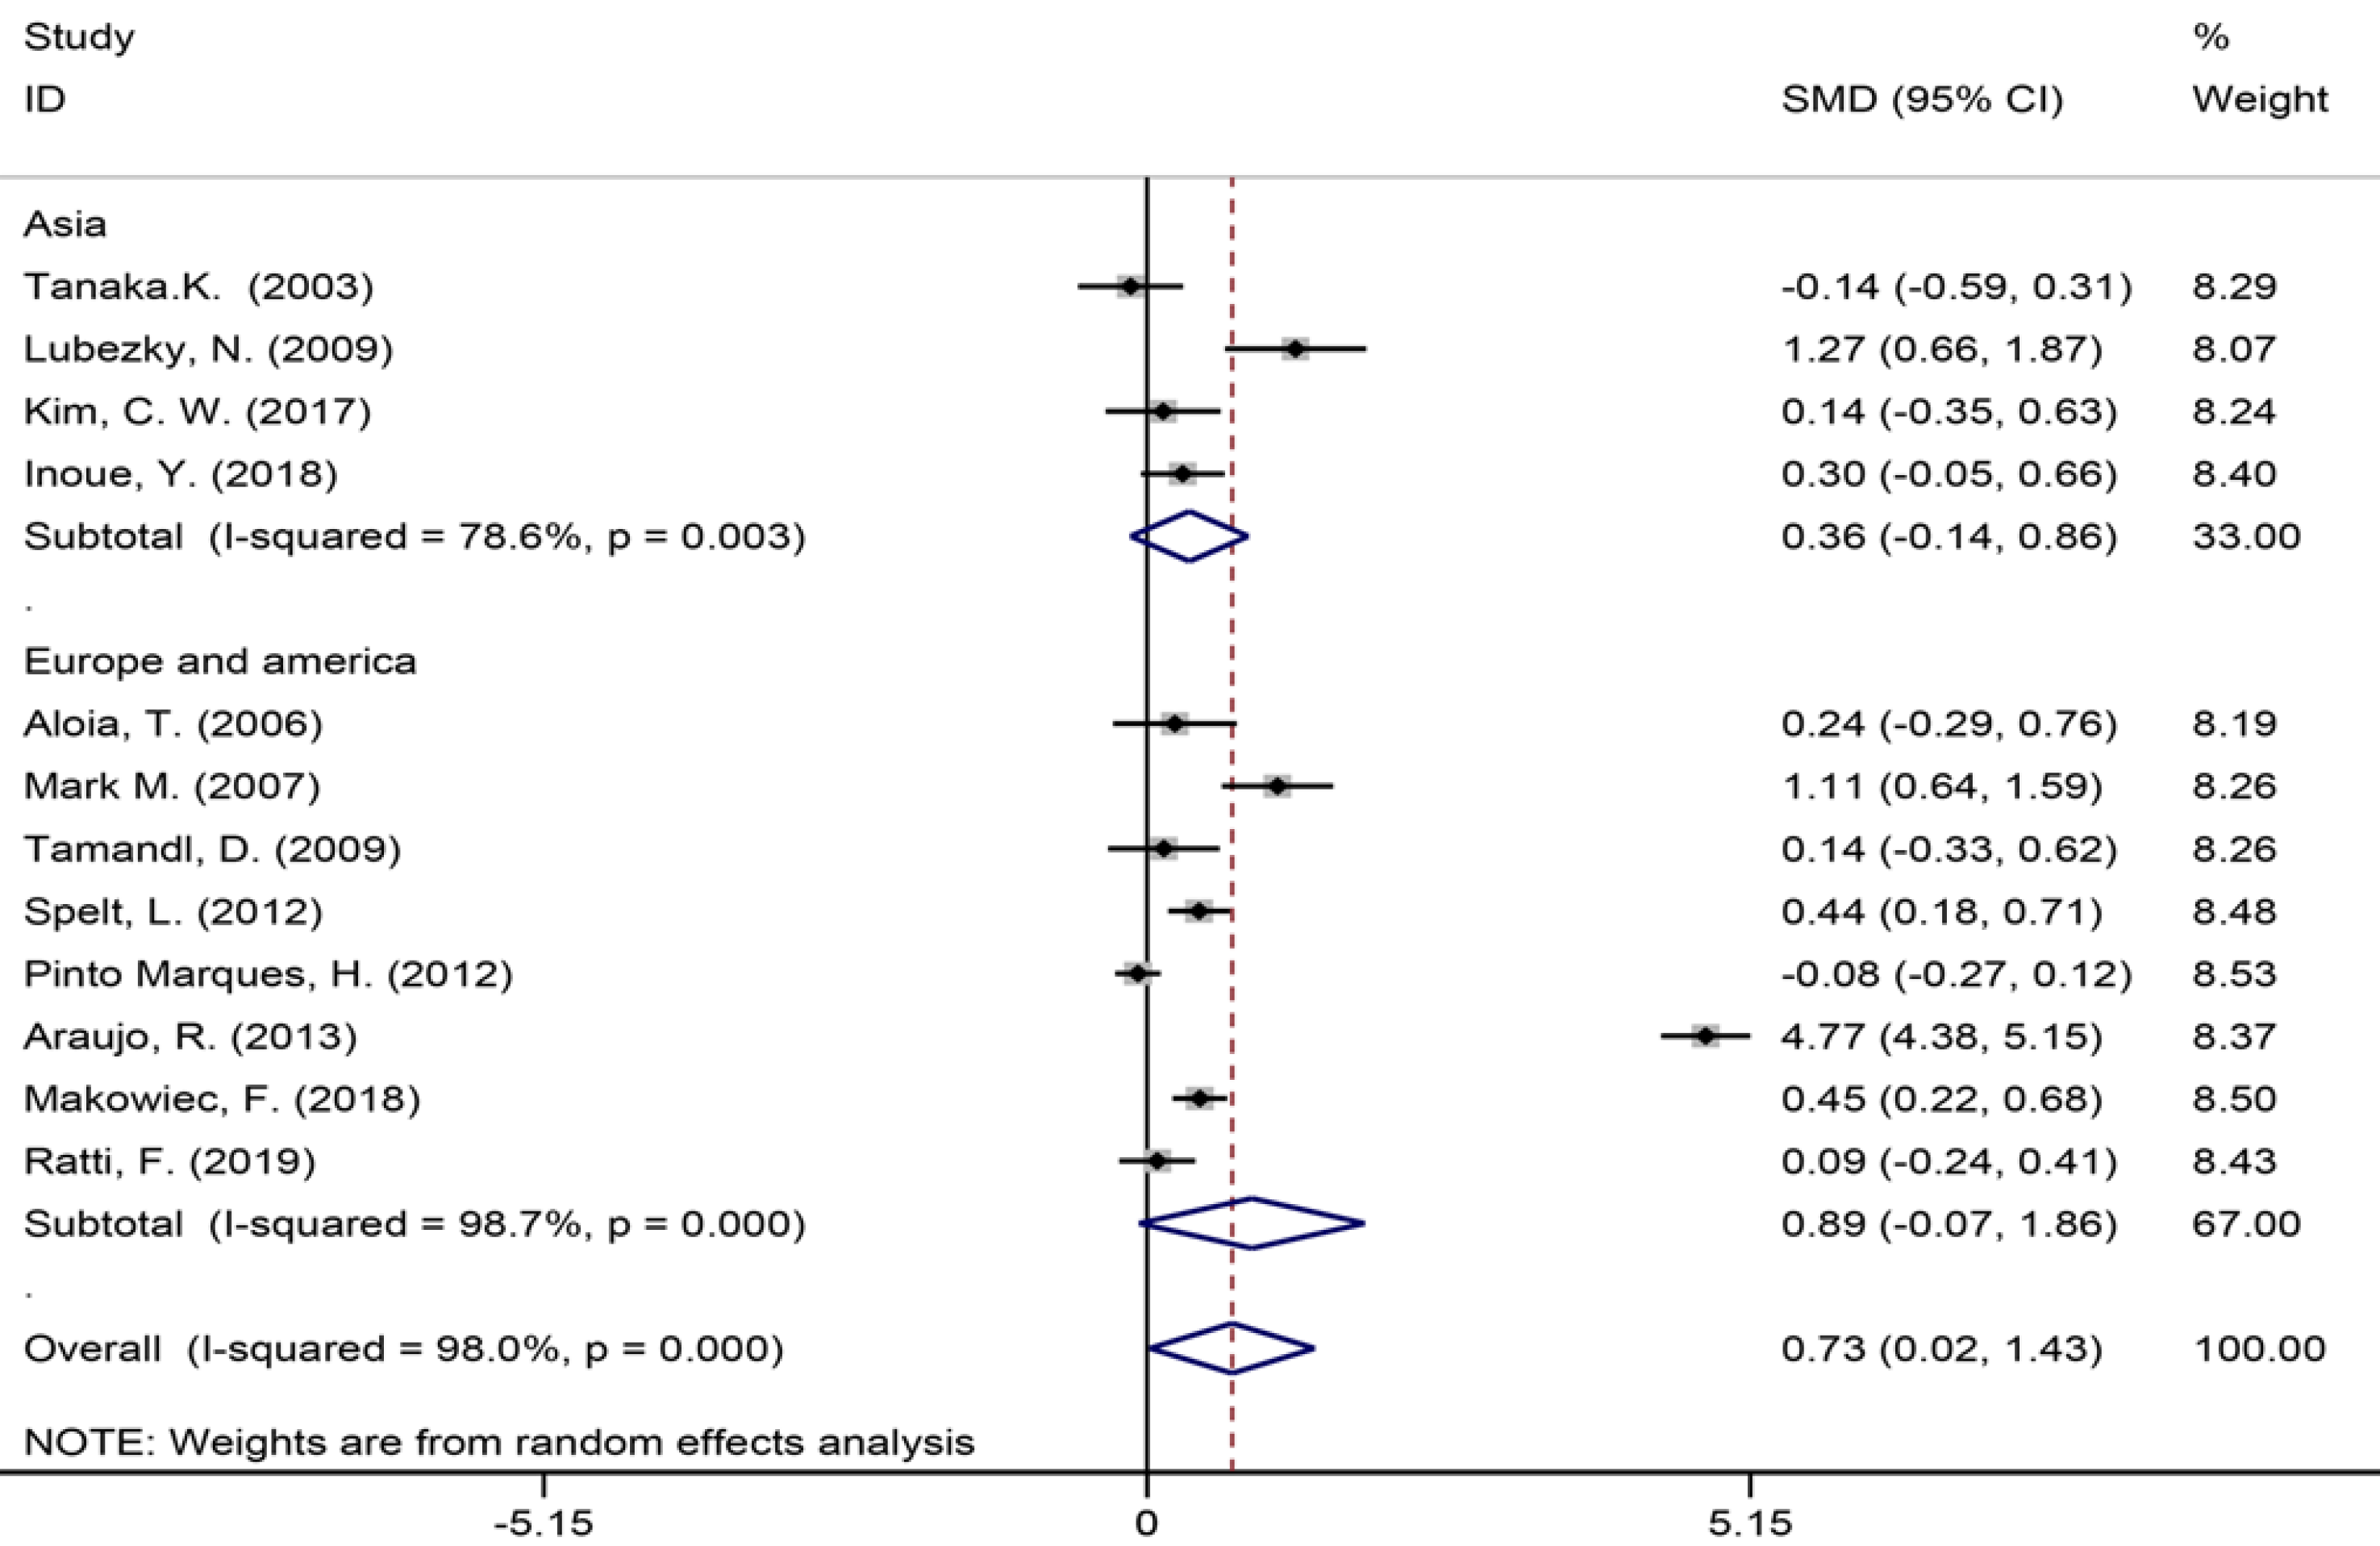
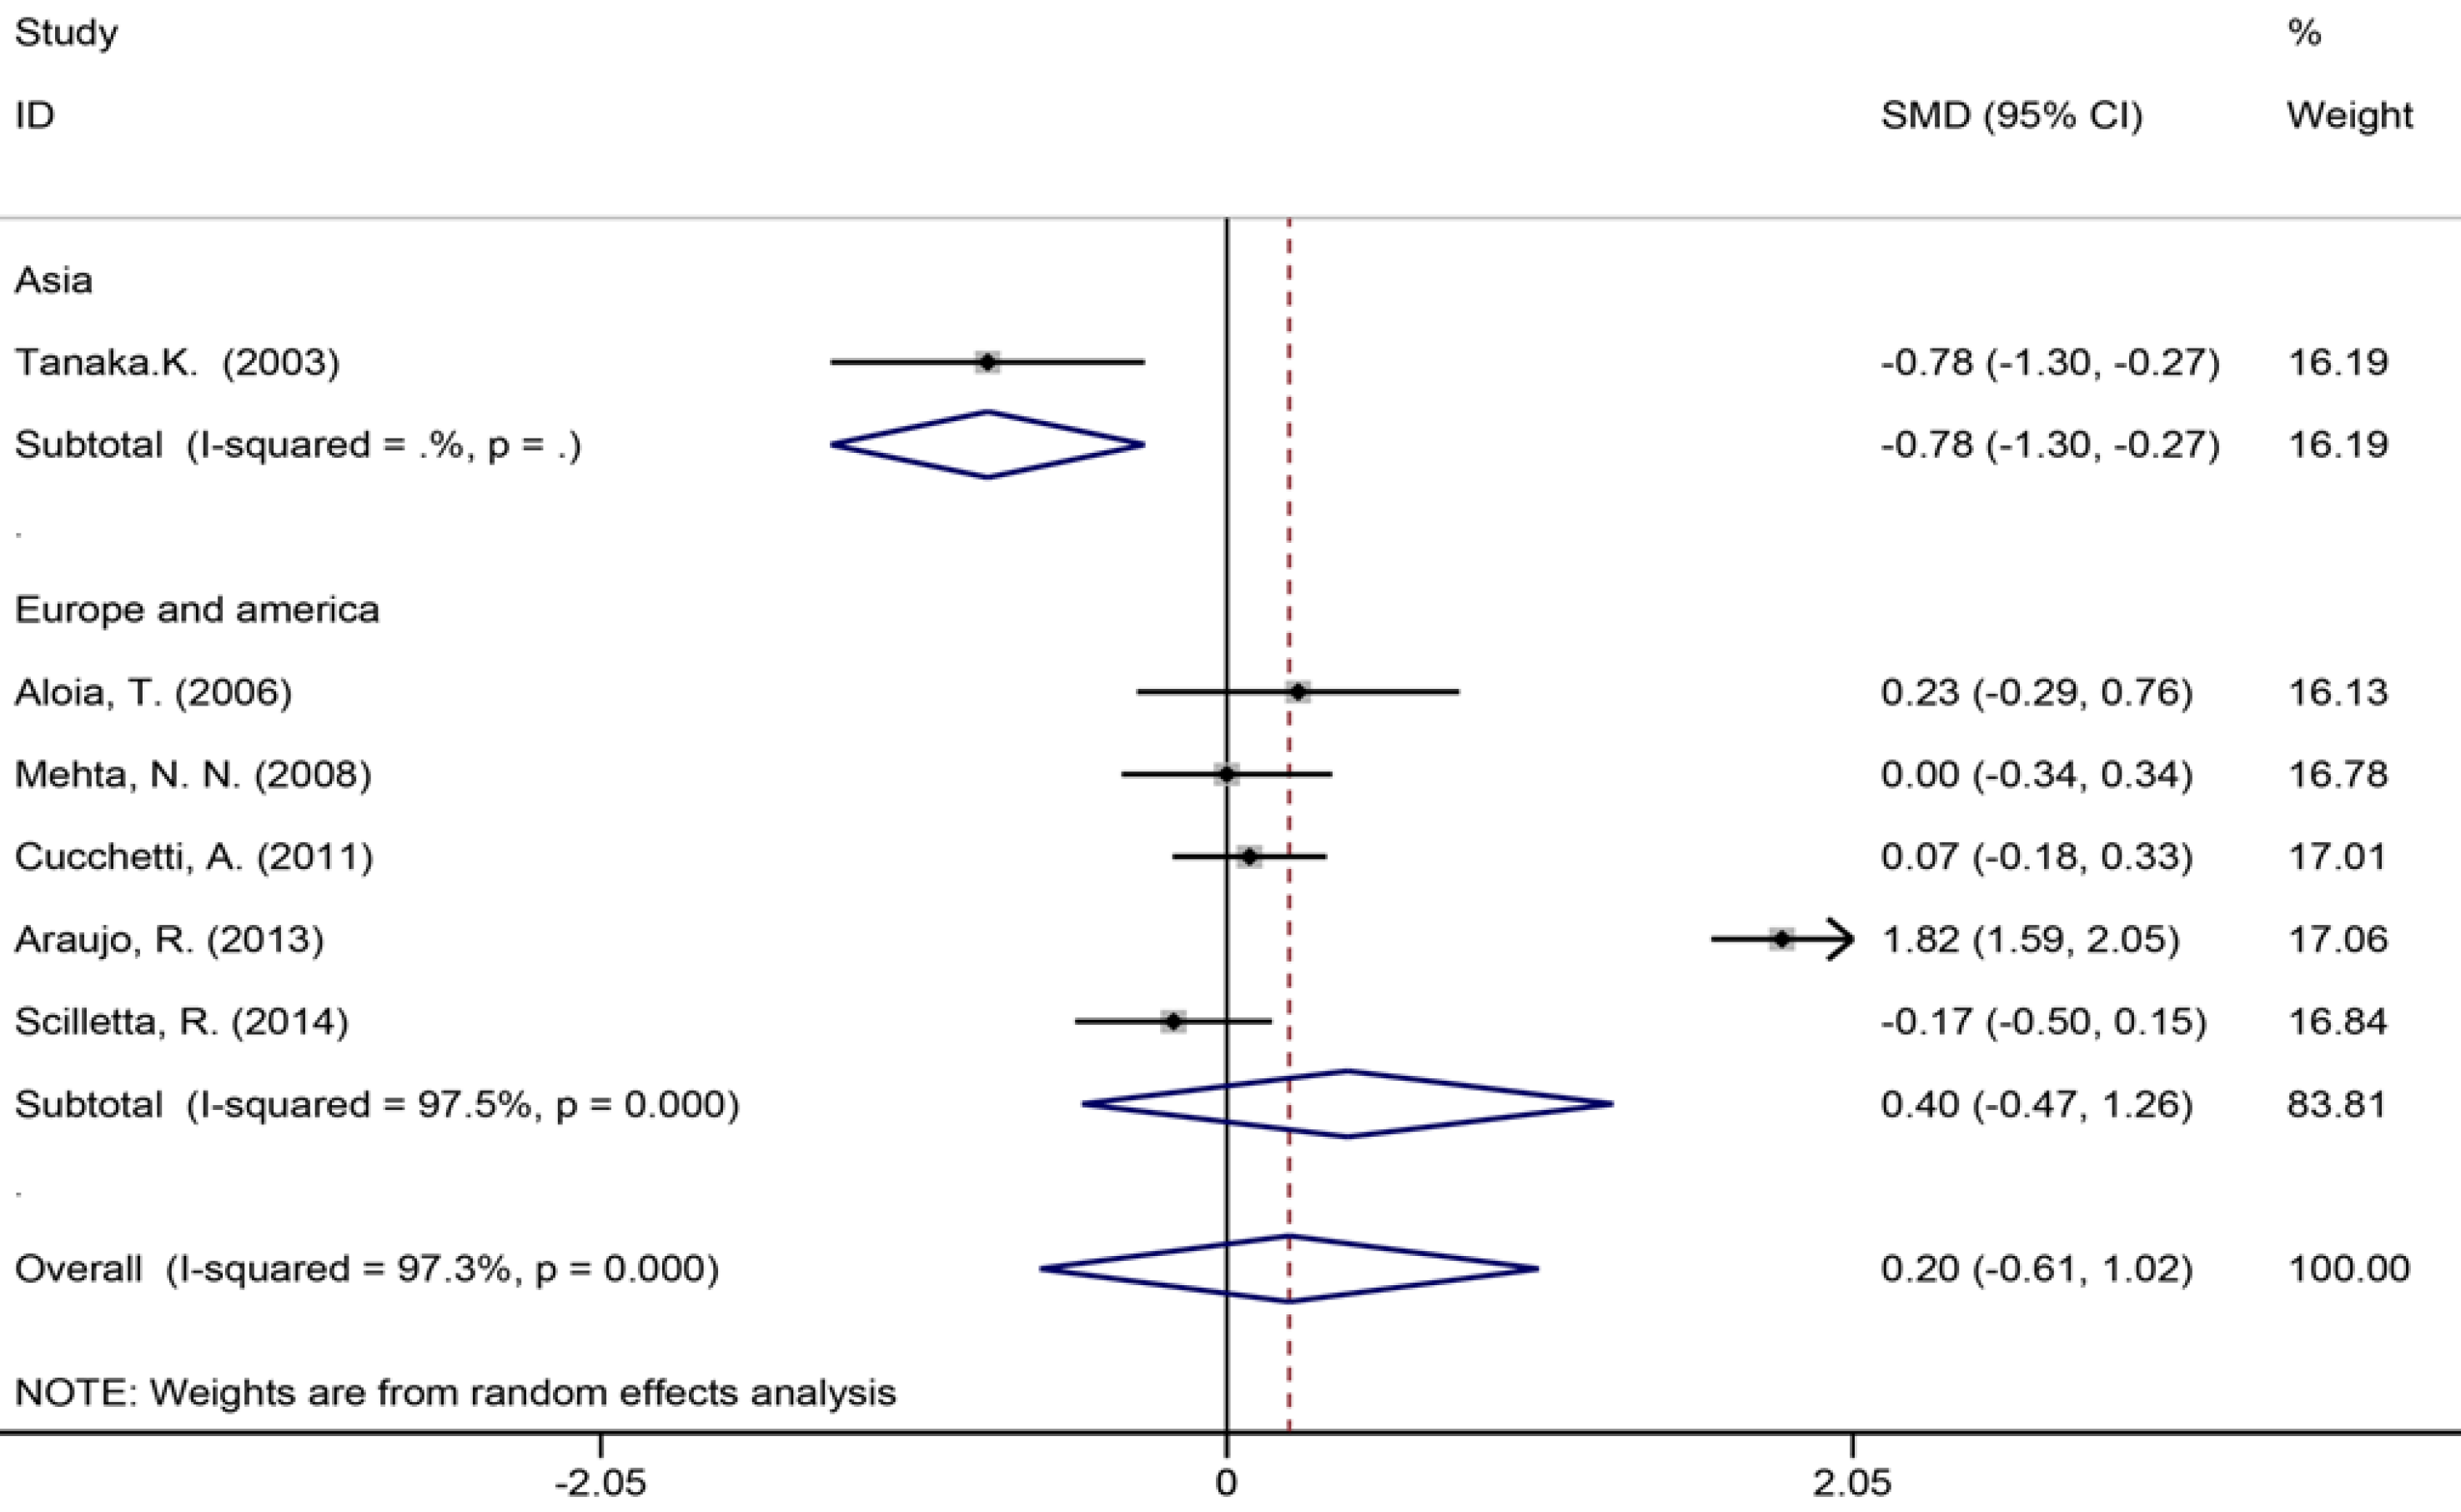
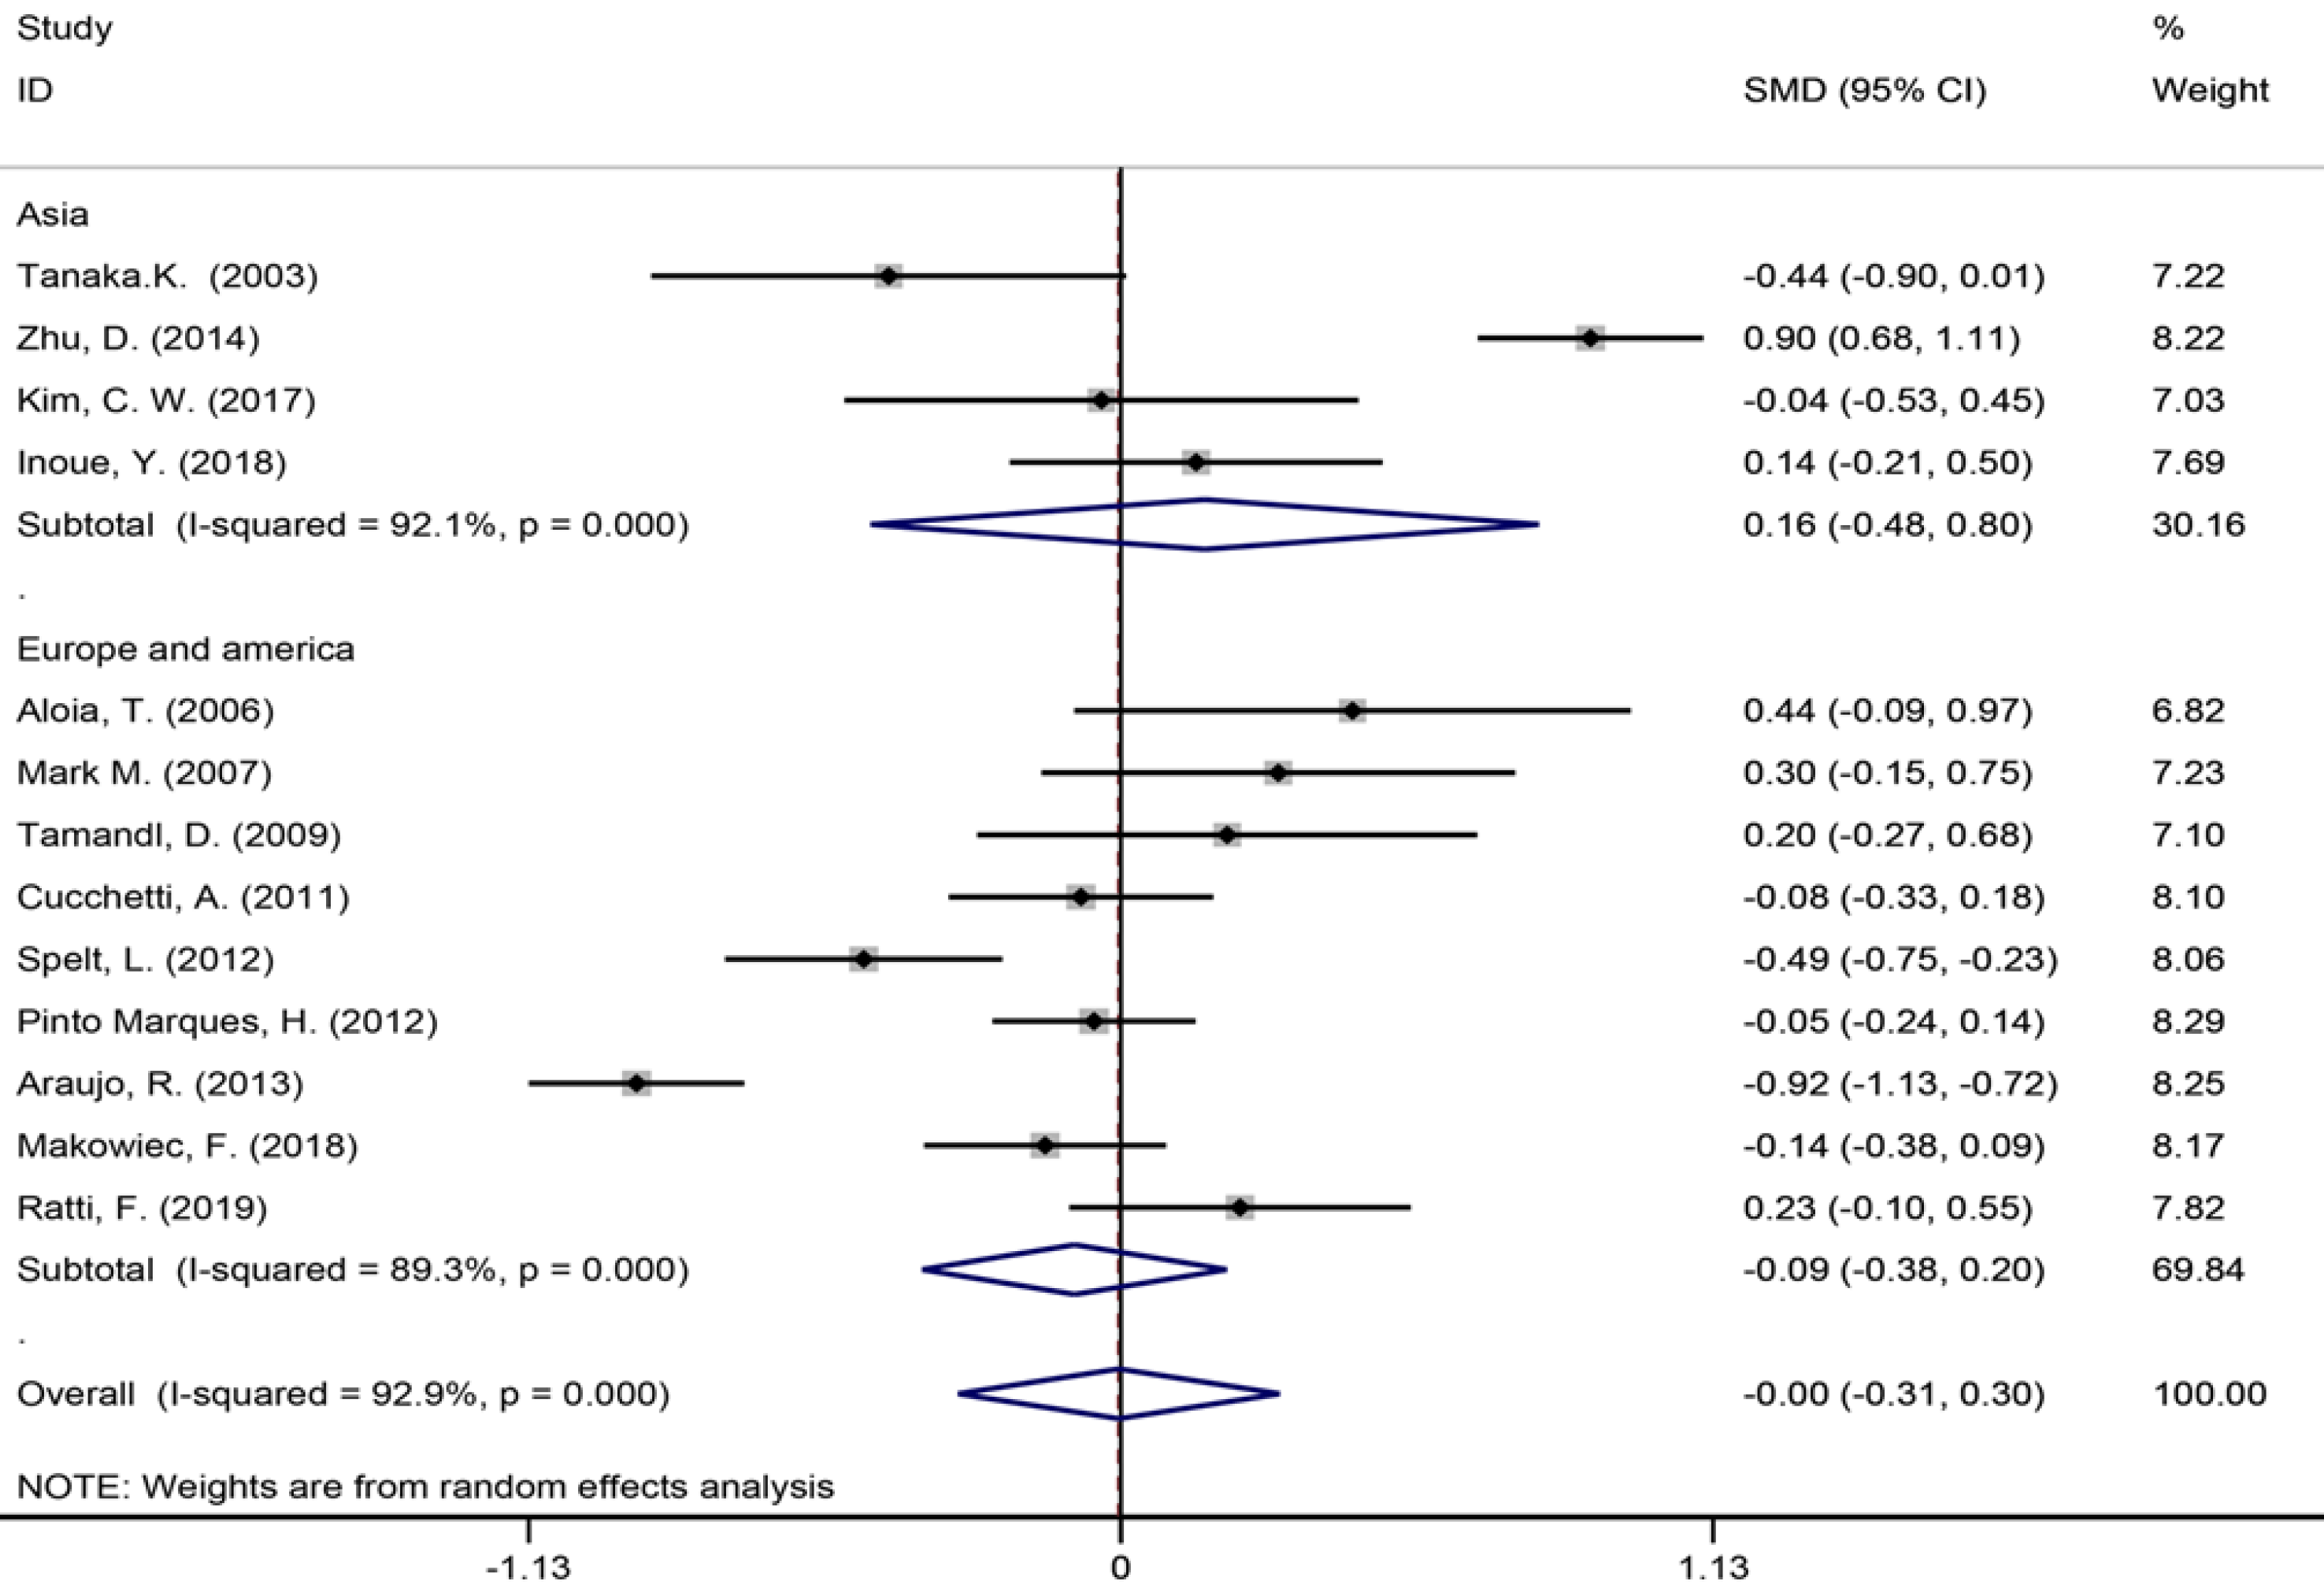
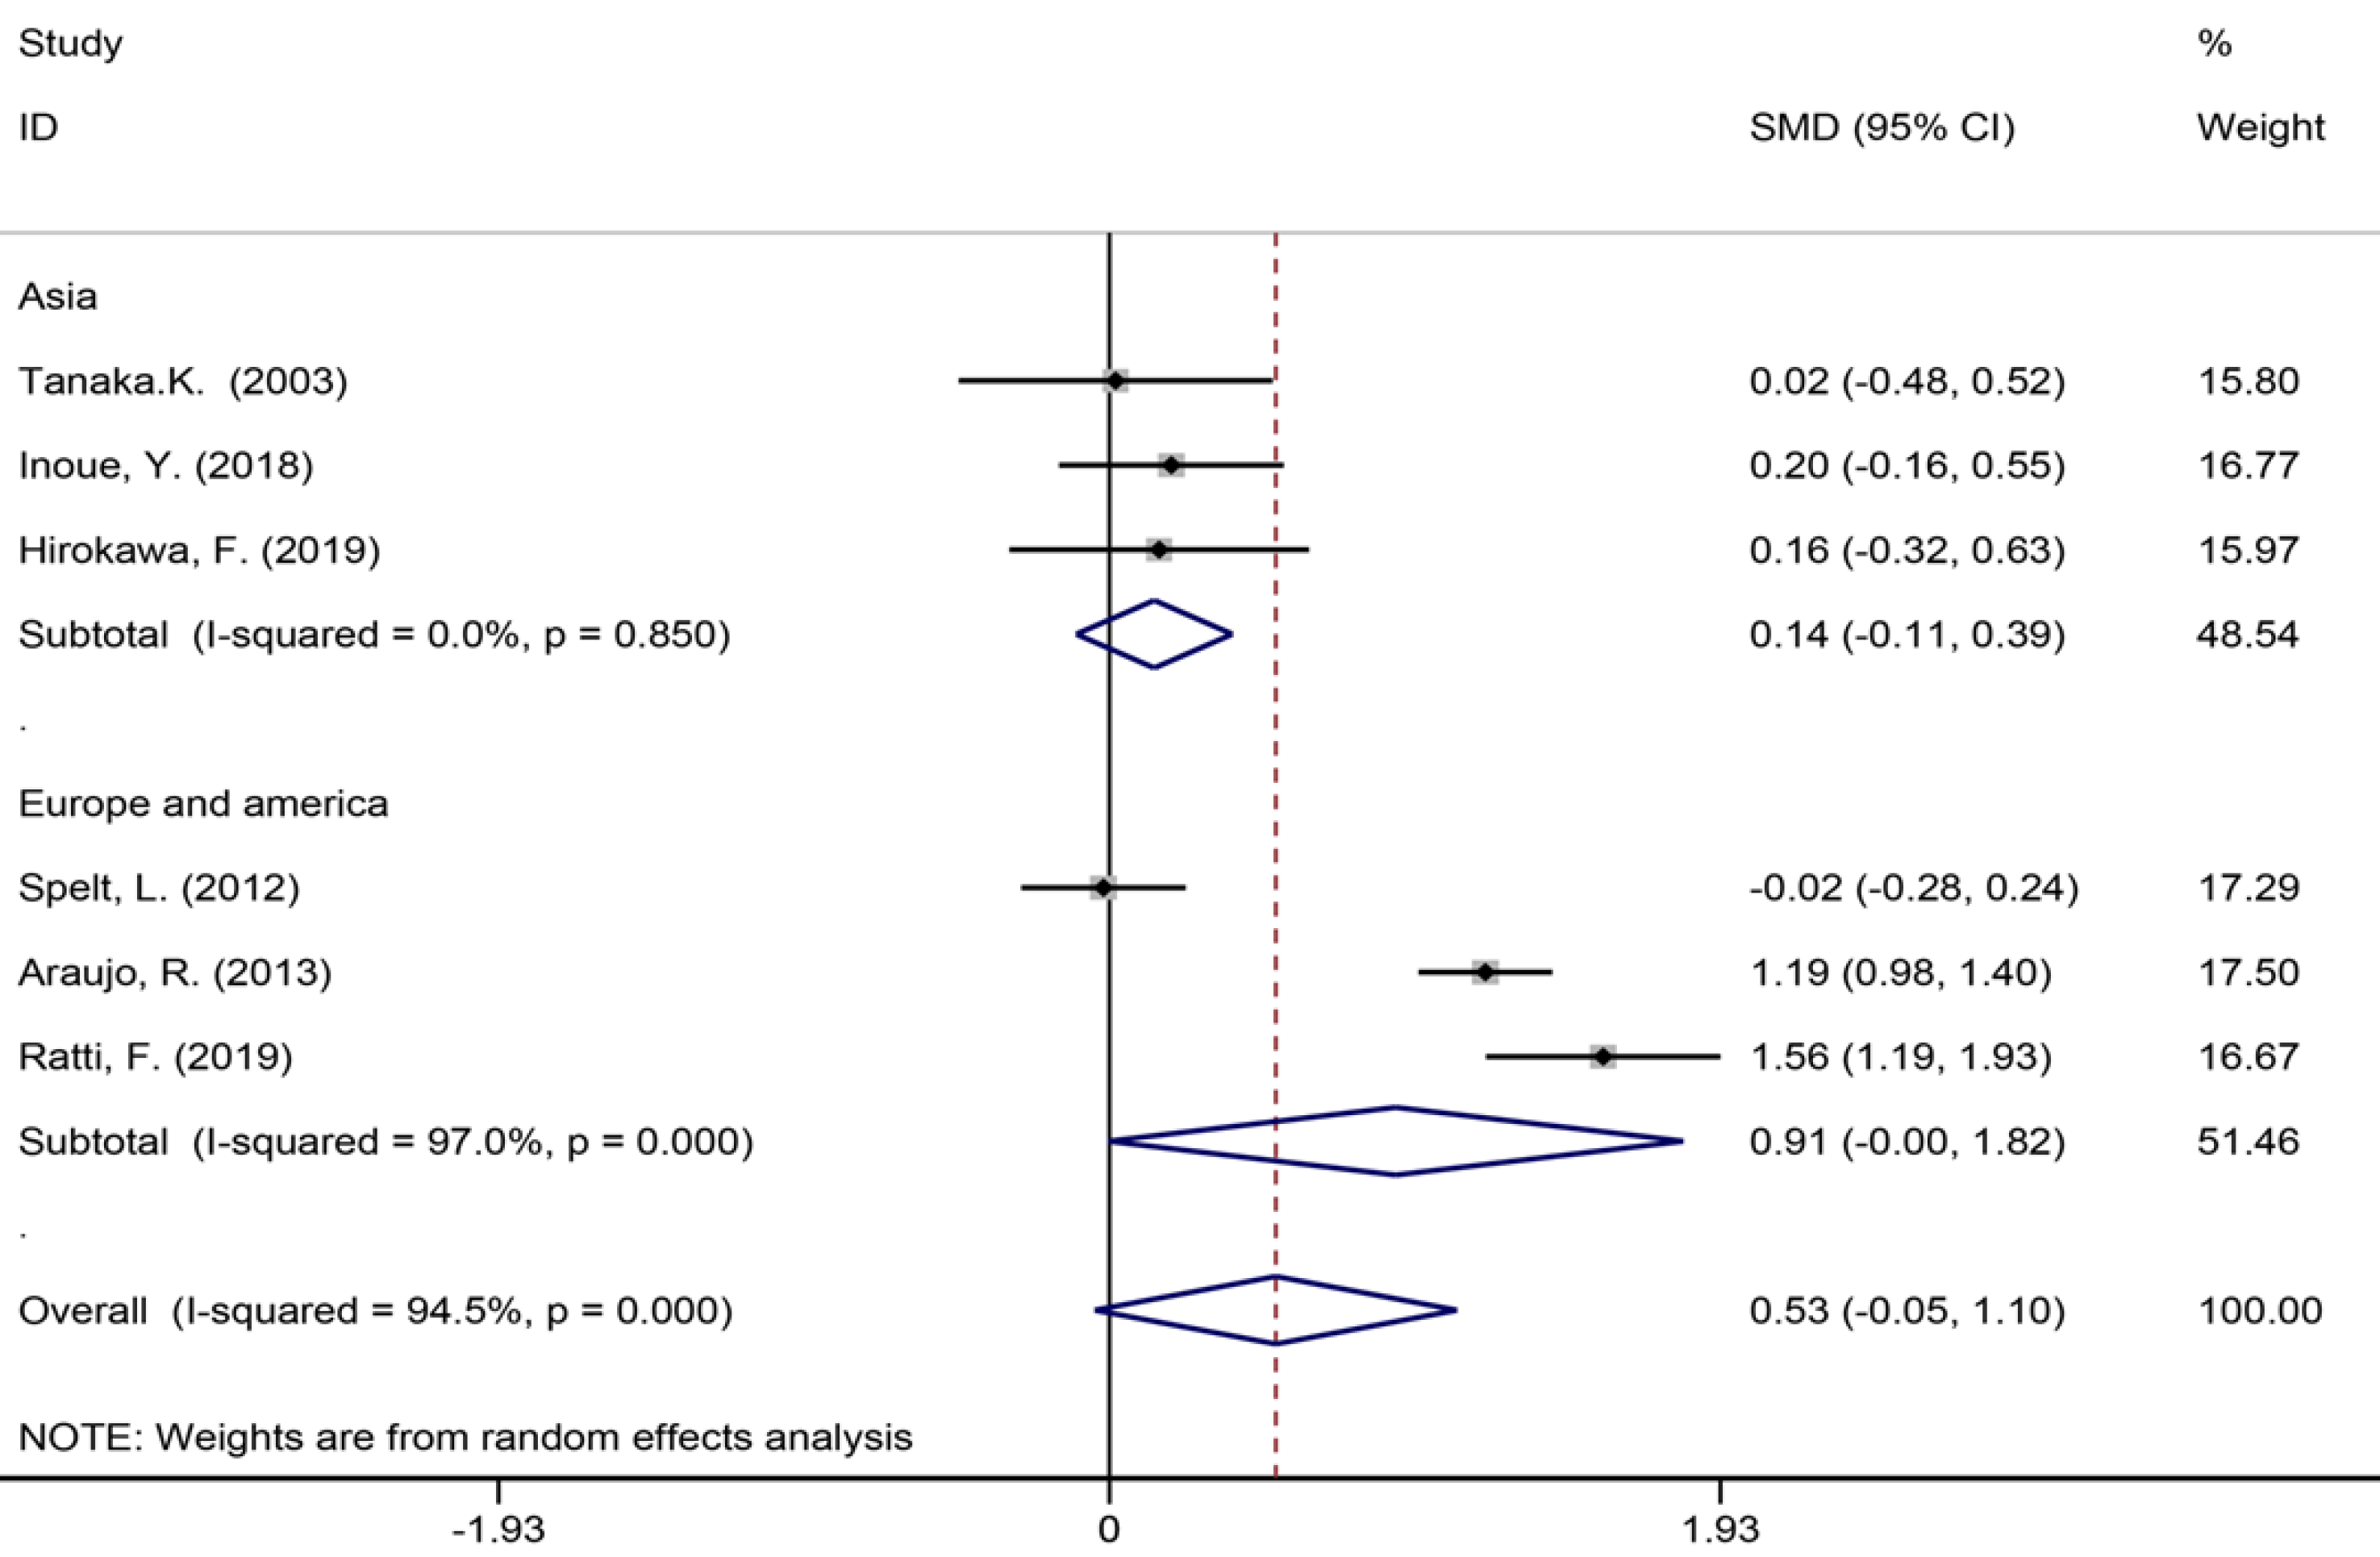
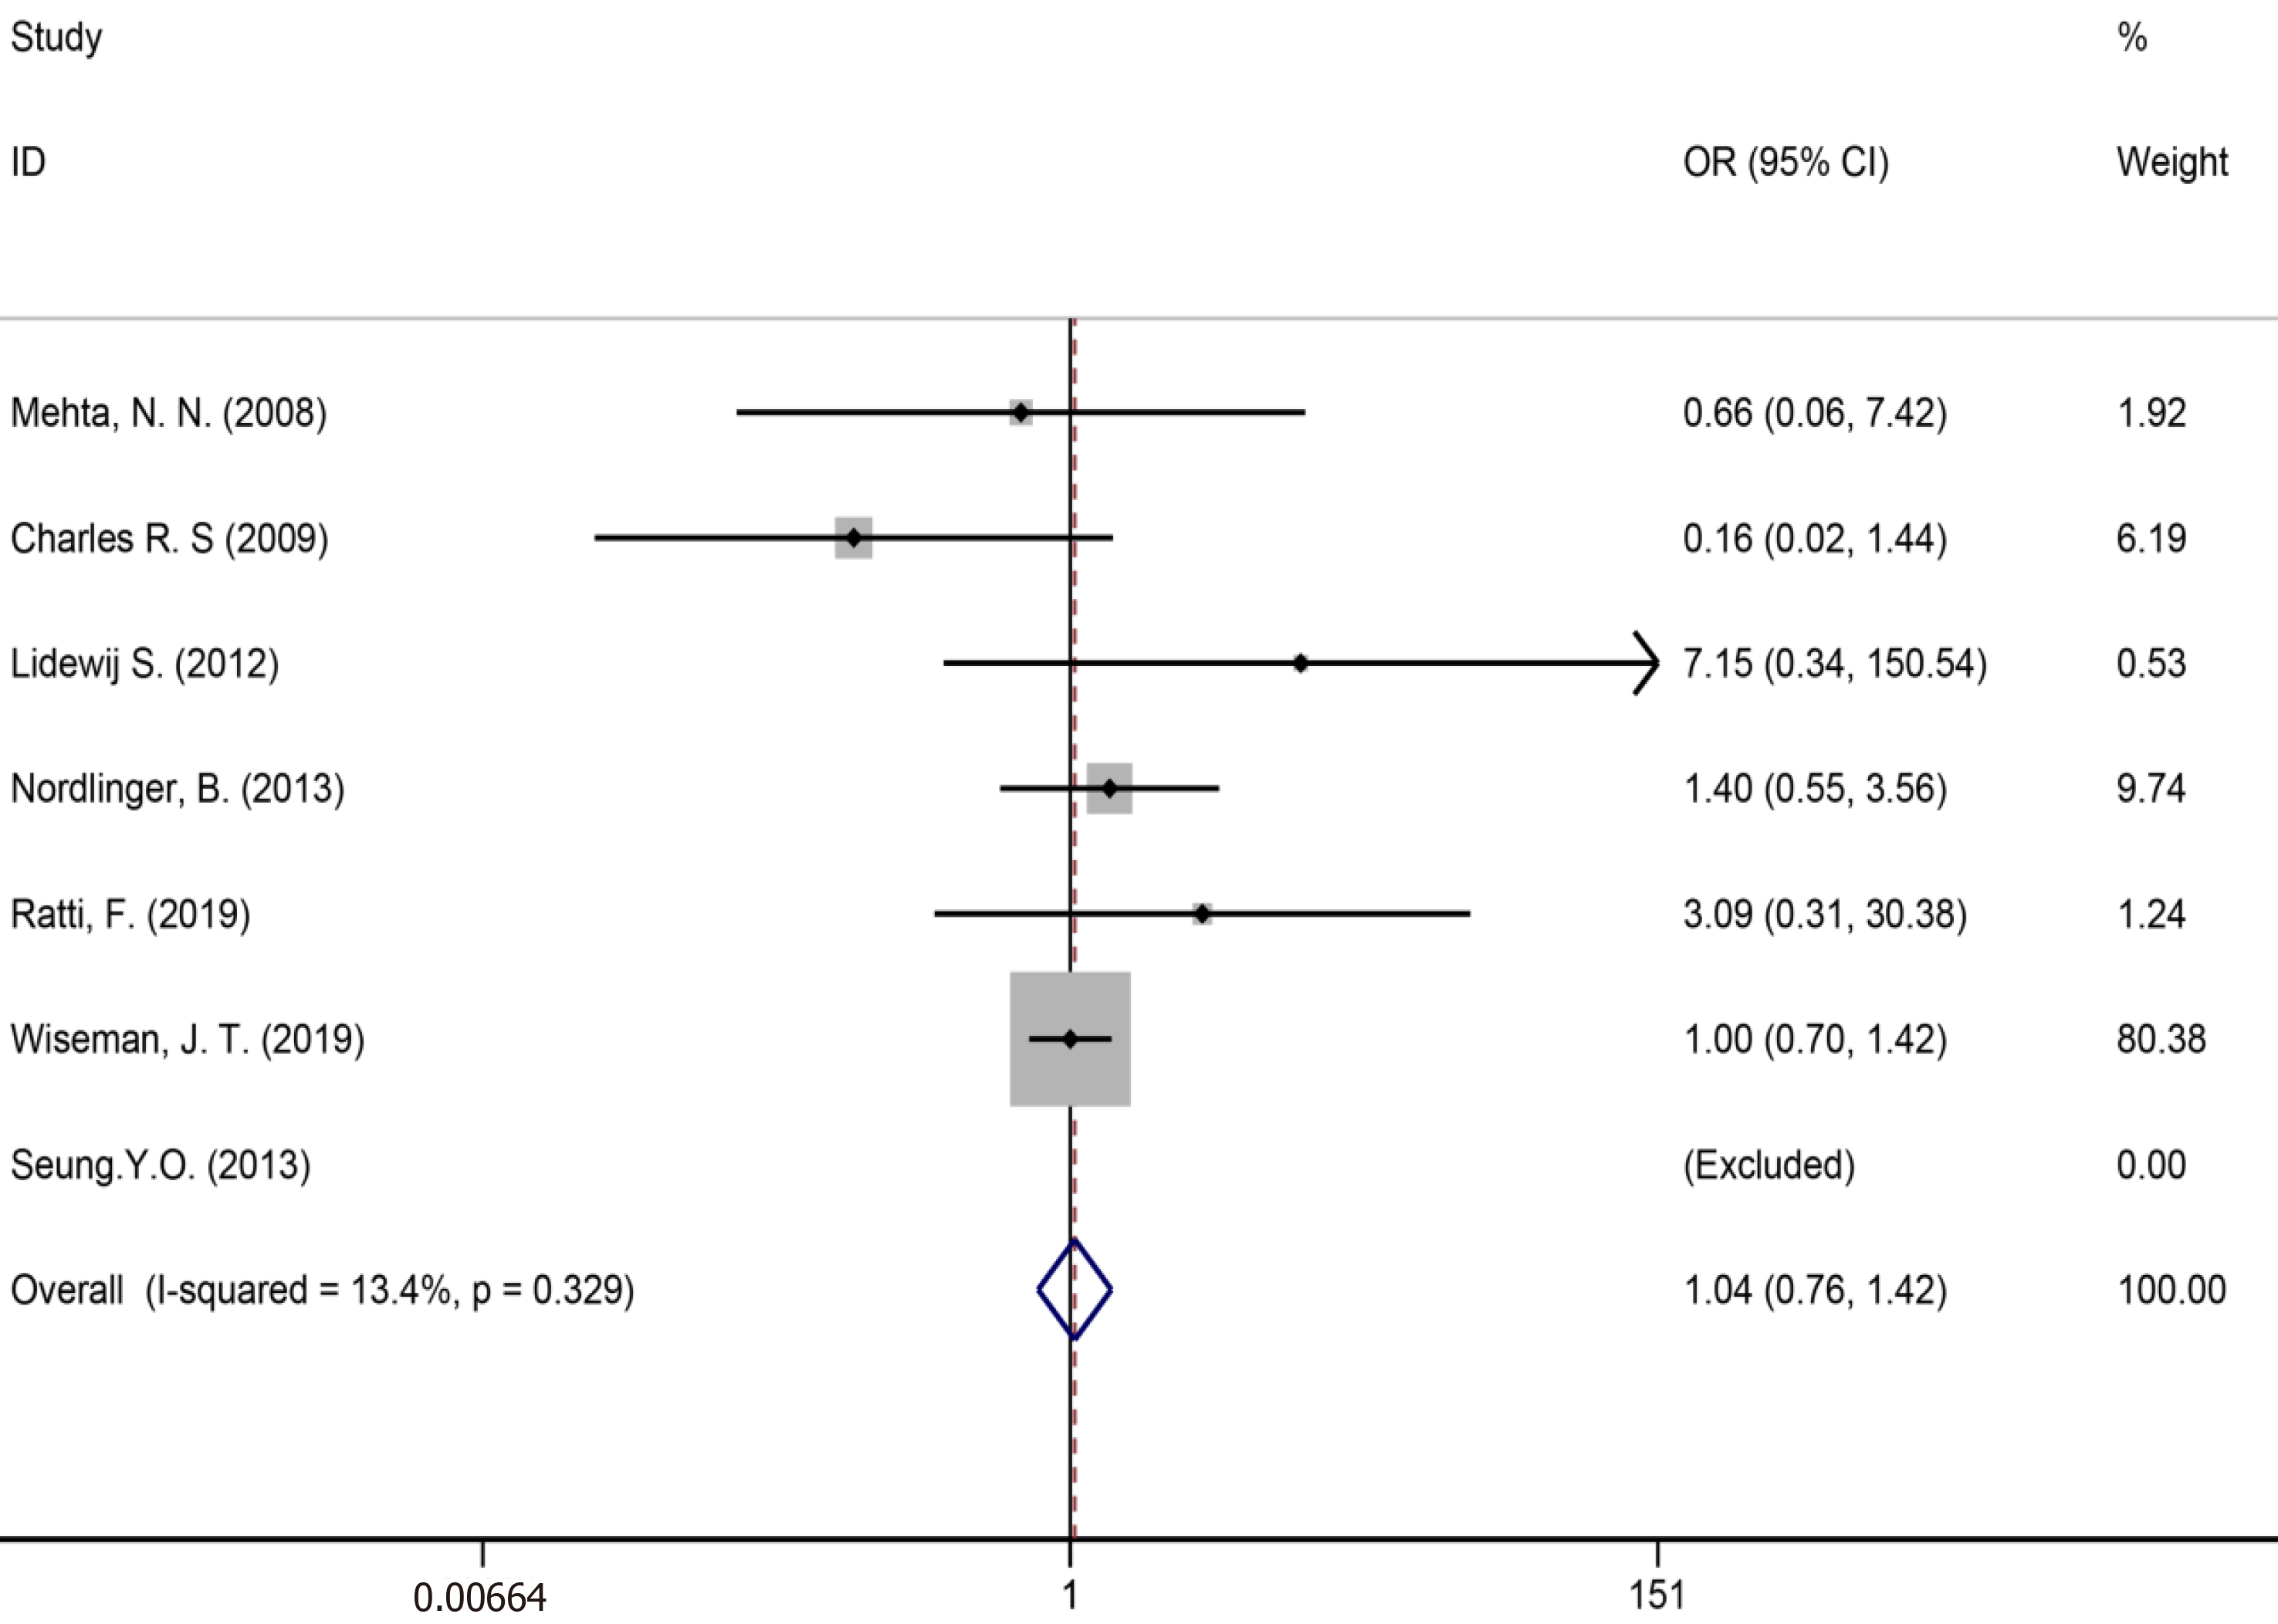
Figure 4 Duration of operation for all patients and by study region subgroups.
Figure 5 Number of liver metastases for all patients and by study region subgroups.
Figure 6 Lymph node metastasis for all patients and two groups.
Figure 7 Length of hospital stay and by study region subgroups.
Figure 8 Size of the largest metastasis for all patients and by study region subgroups.
Figure 9 Blood loss during surgery for all patients and by study region subgroups.
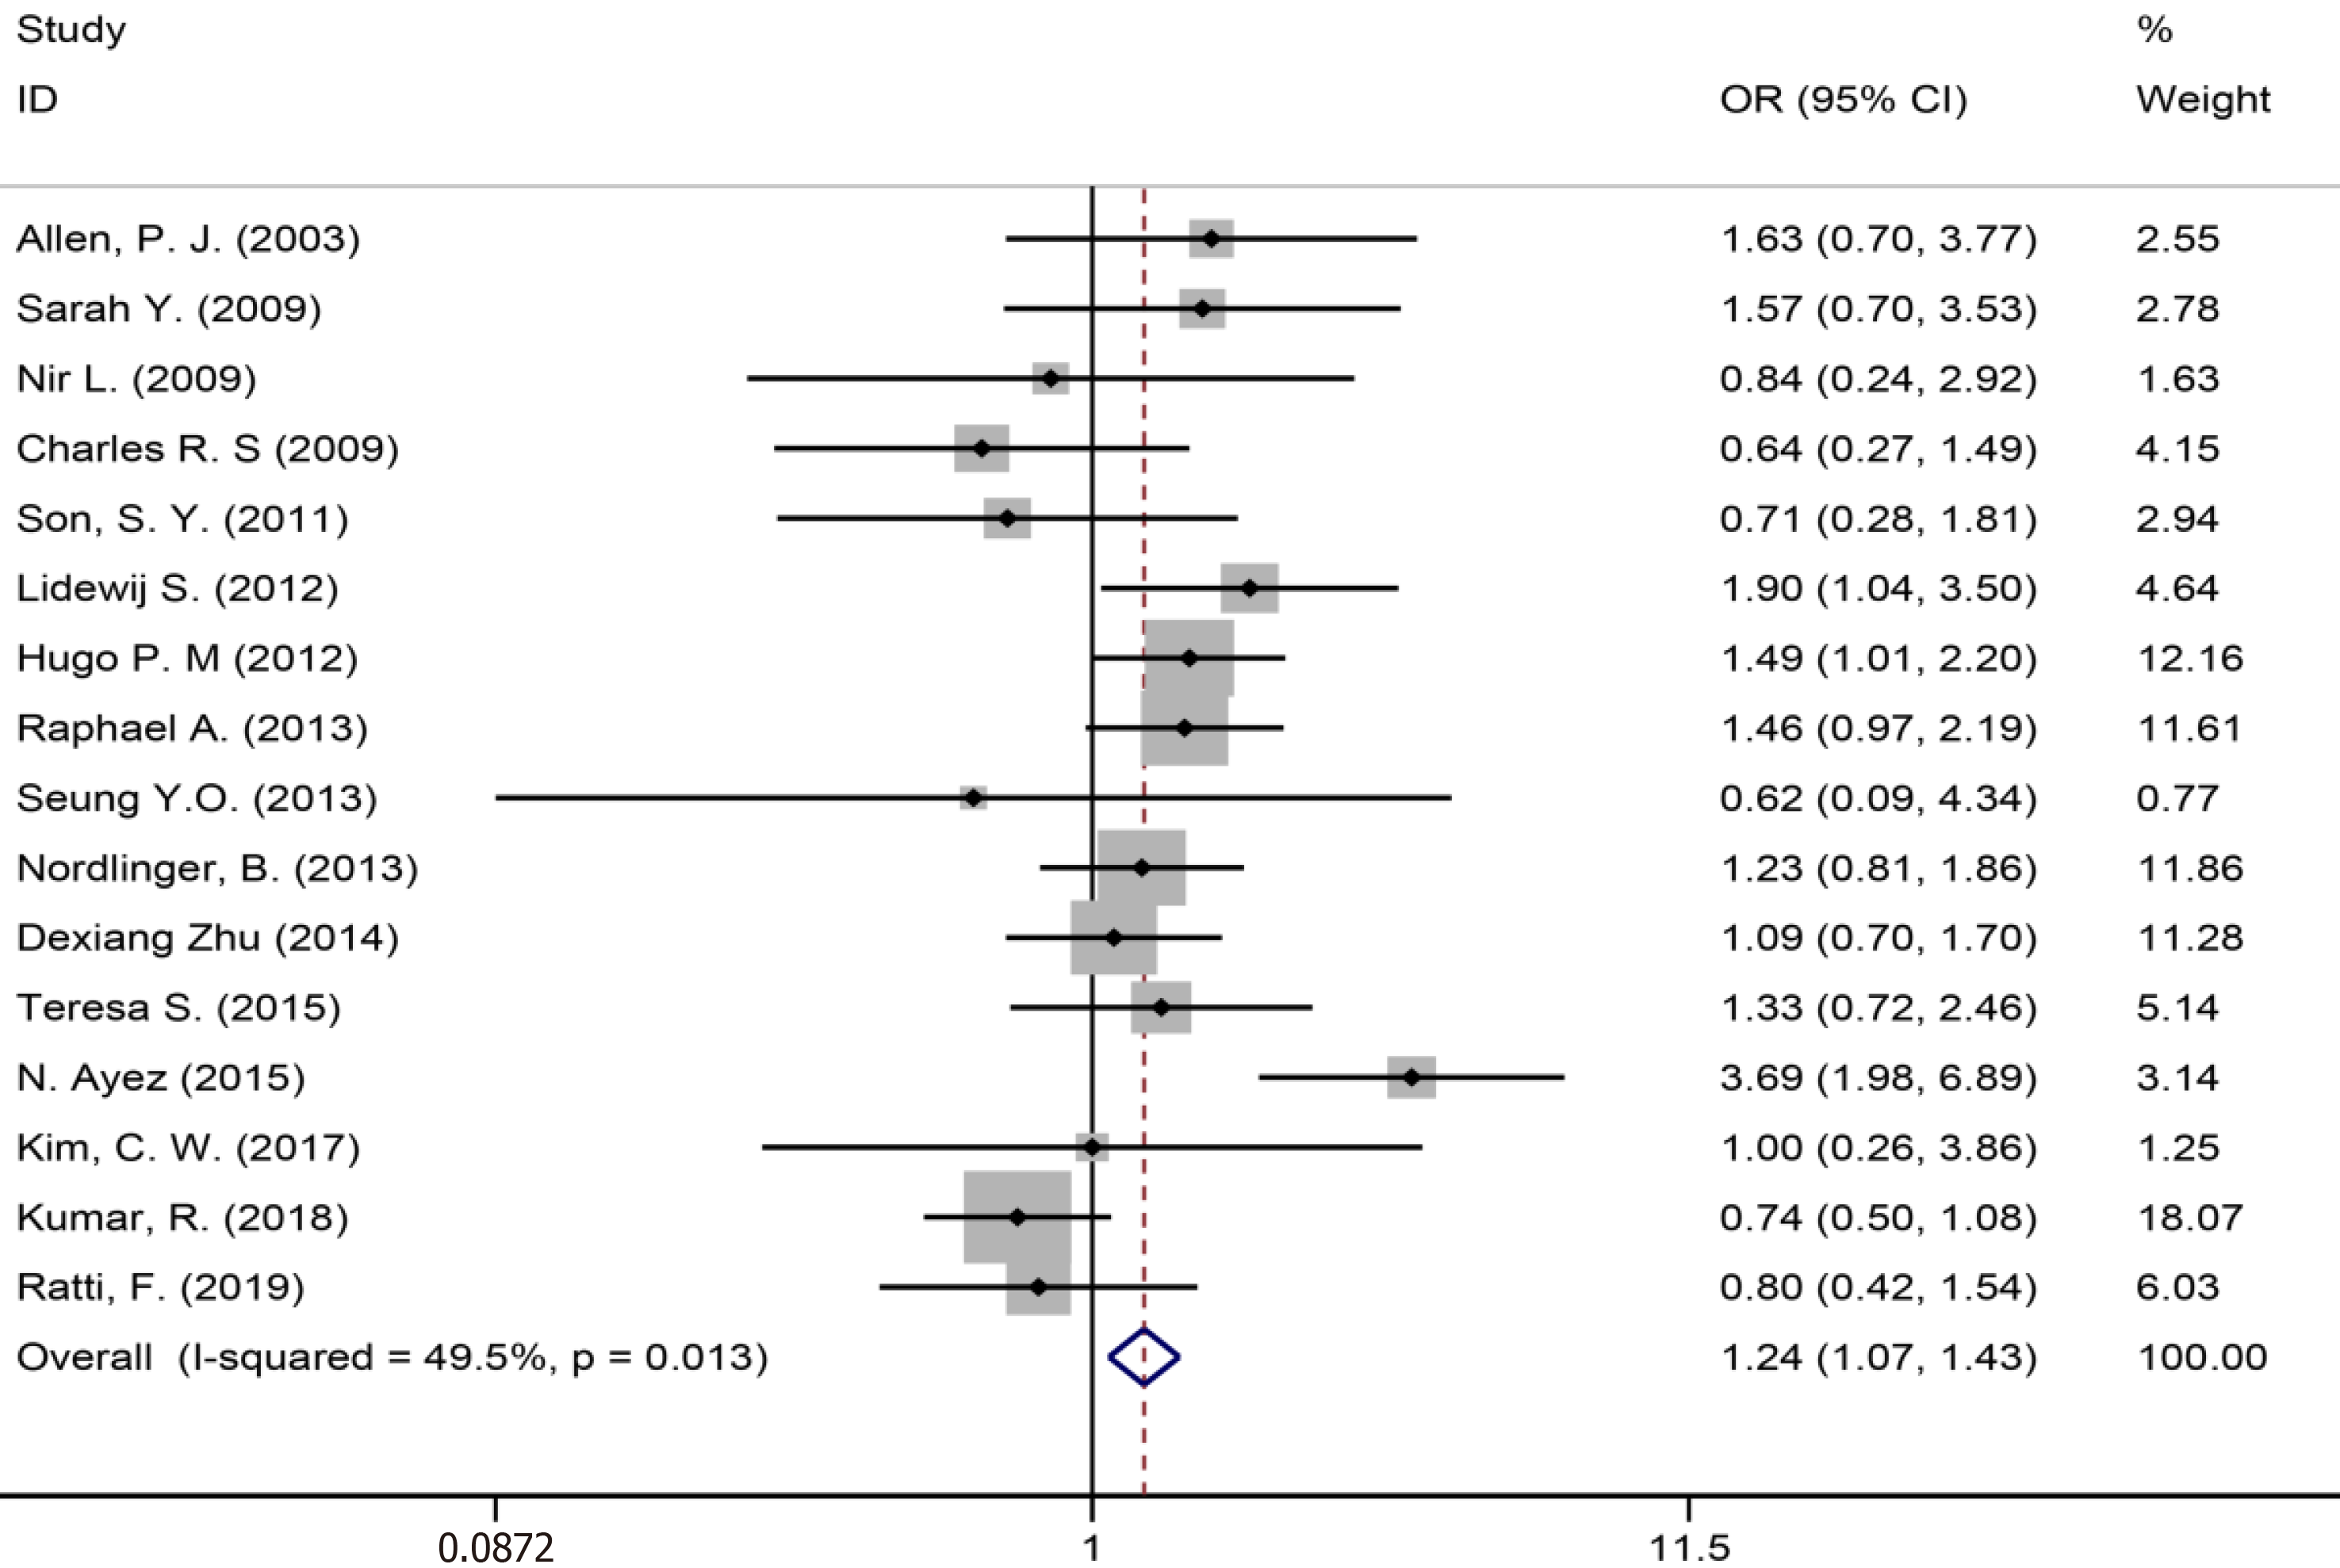
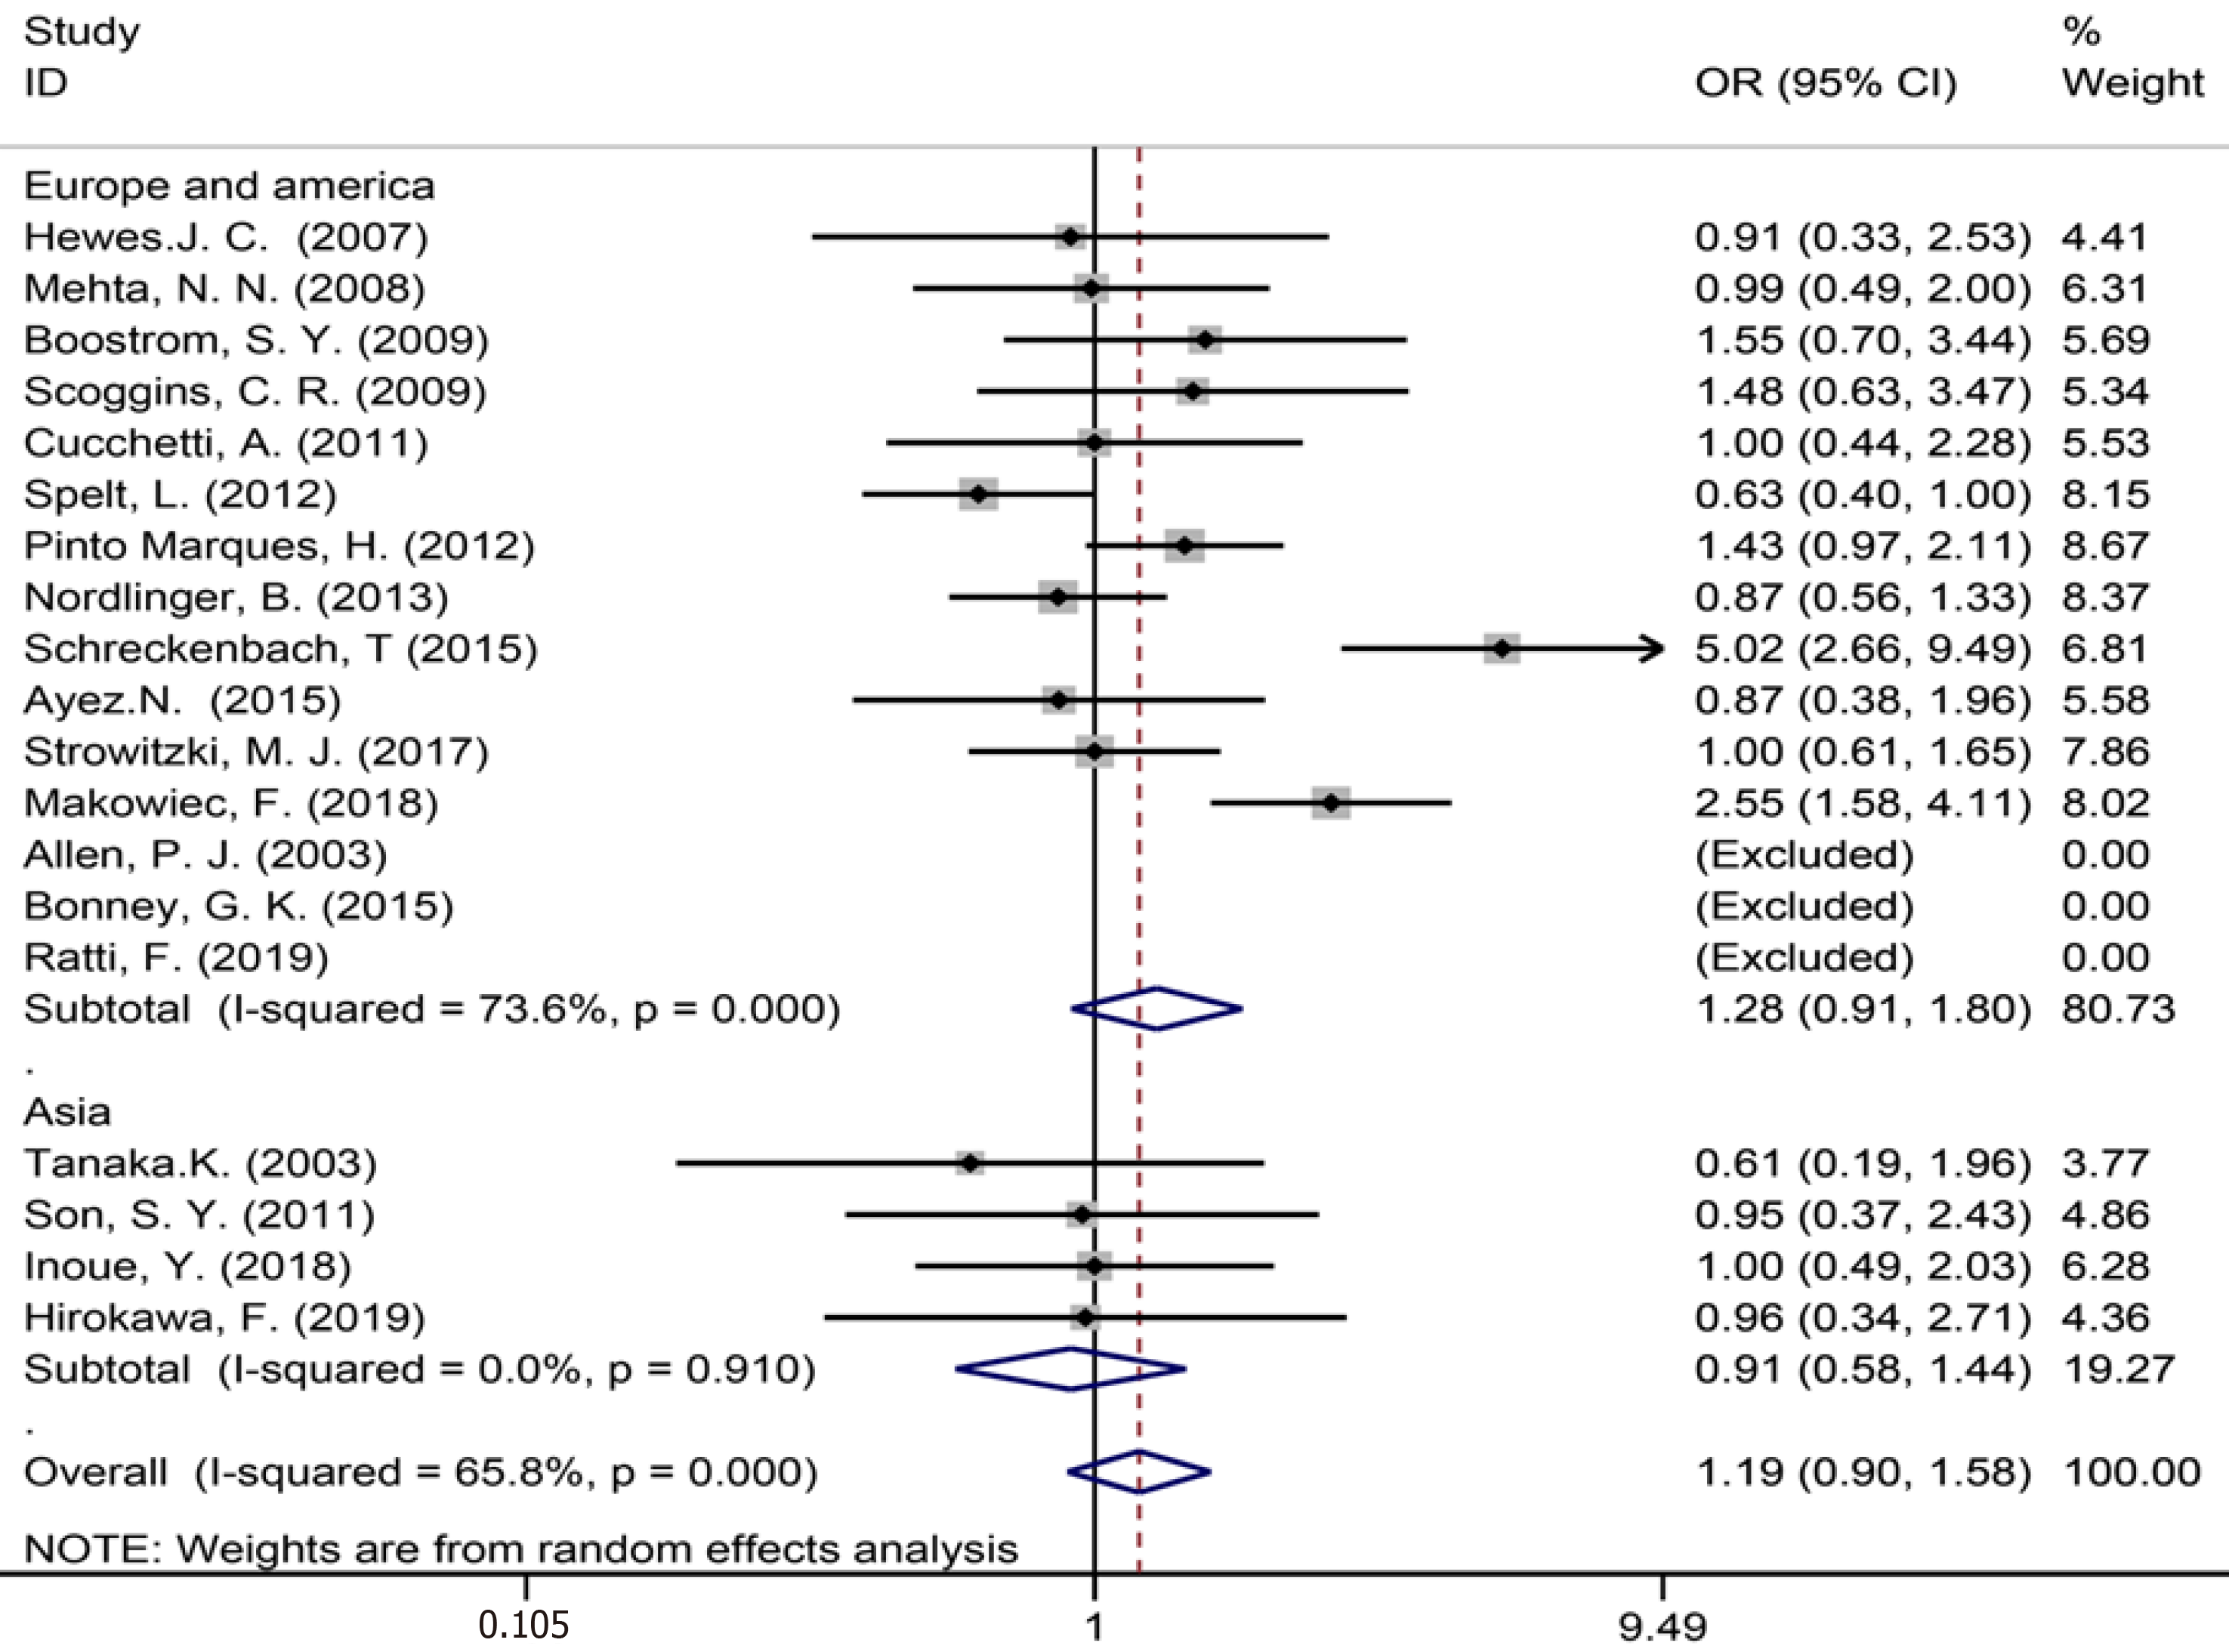
Figure 10 Synchronous metastases for all and by study region subgroups.
Figure 11 Major liver resection for all patients and two groups.
Figure 12 R0 liver resections for all patients and two groups.
Figure 13 Blood transfusions for all patients and two groups.
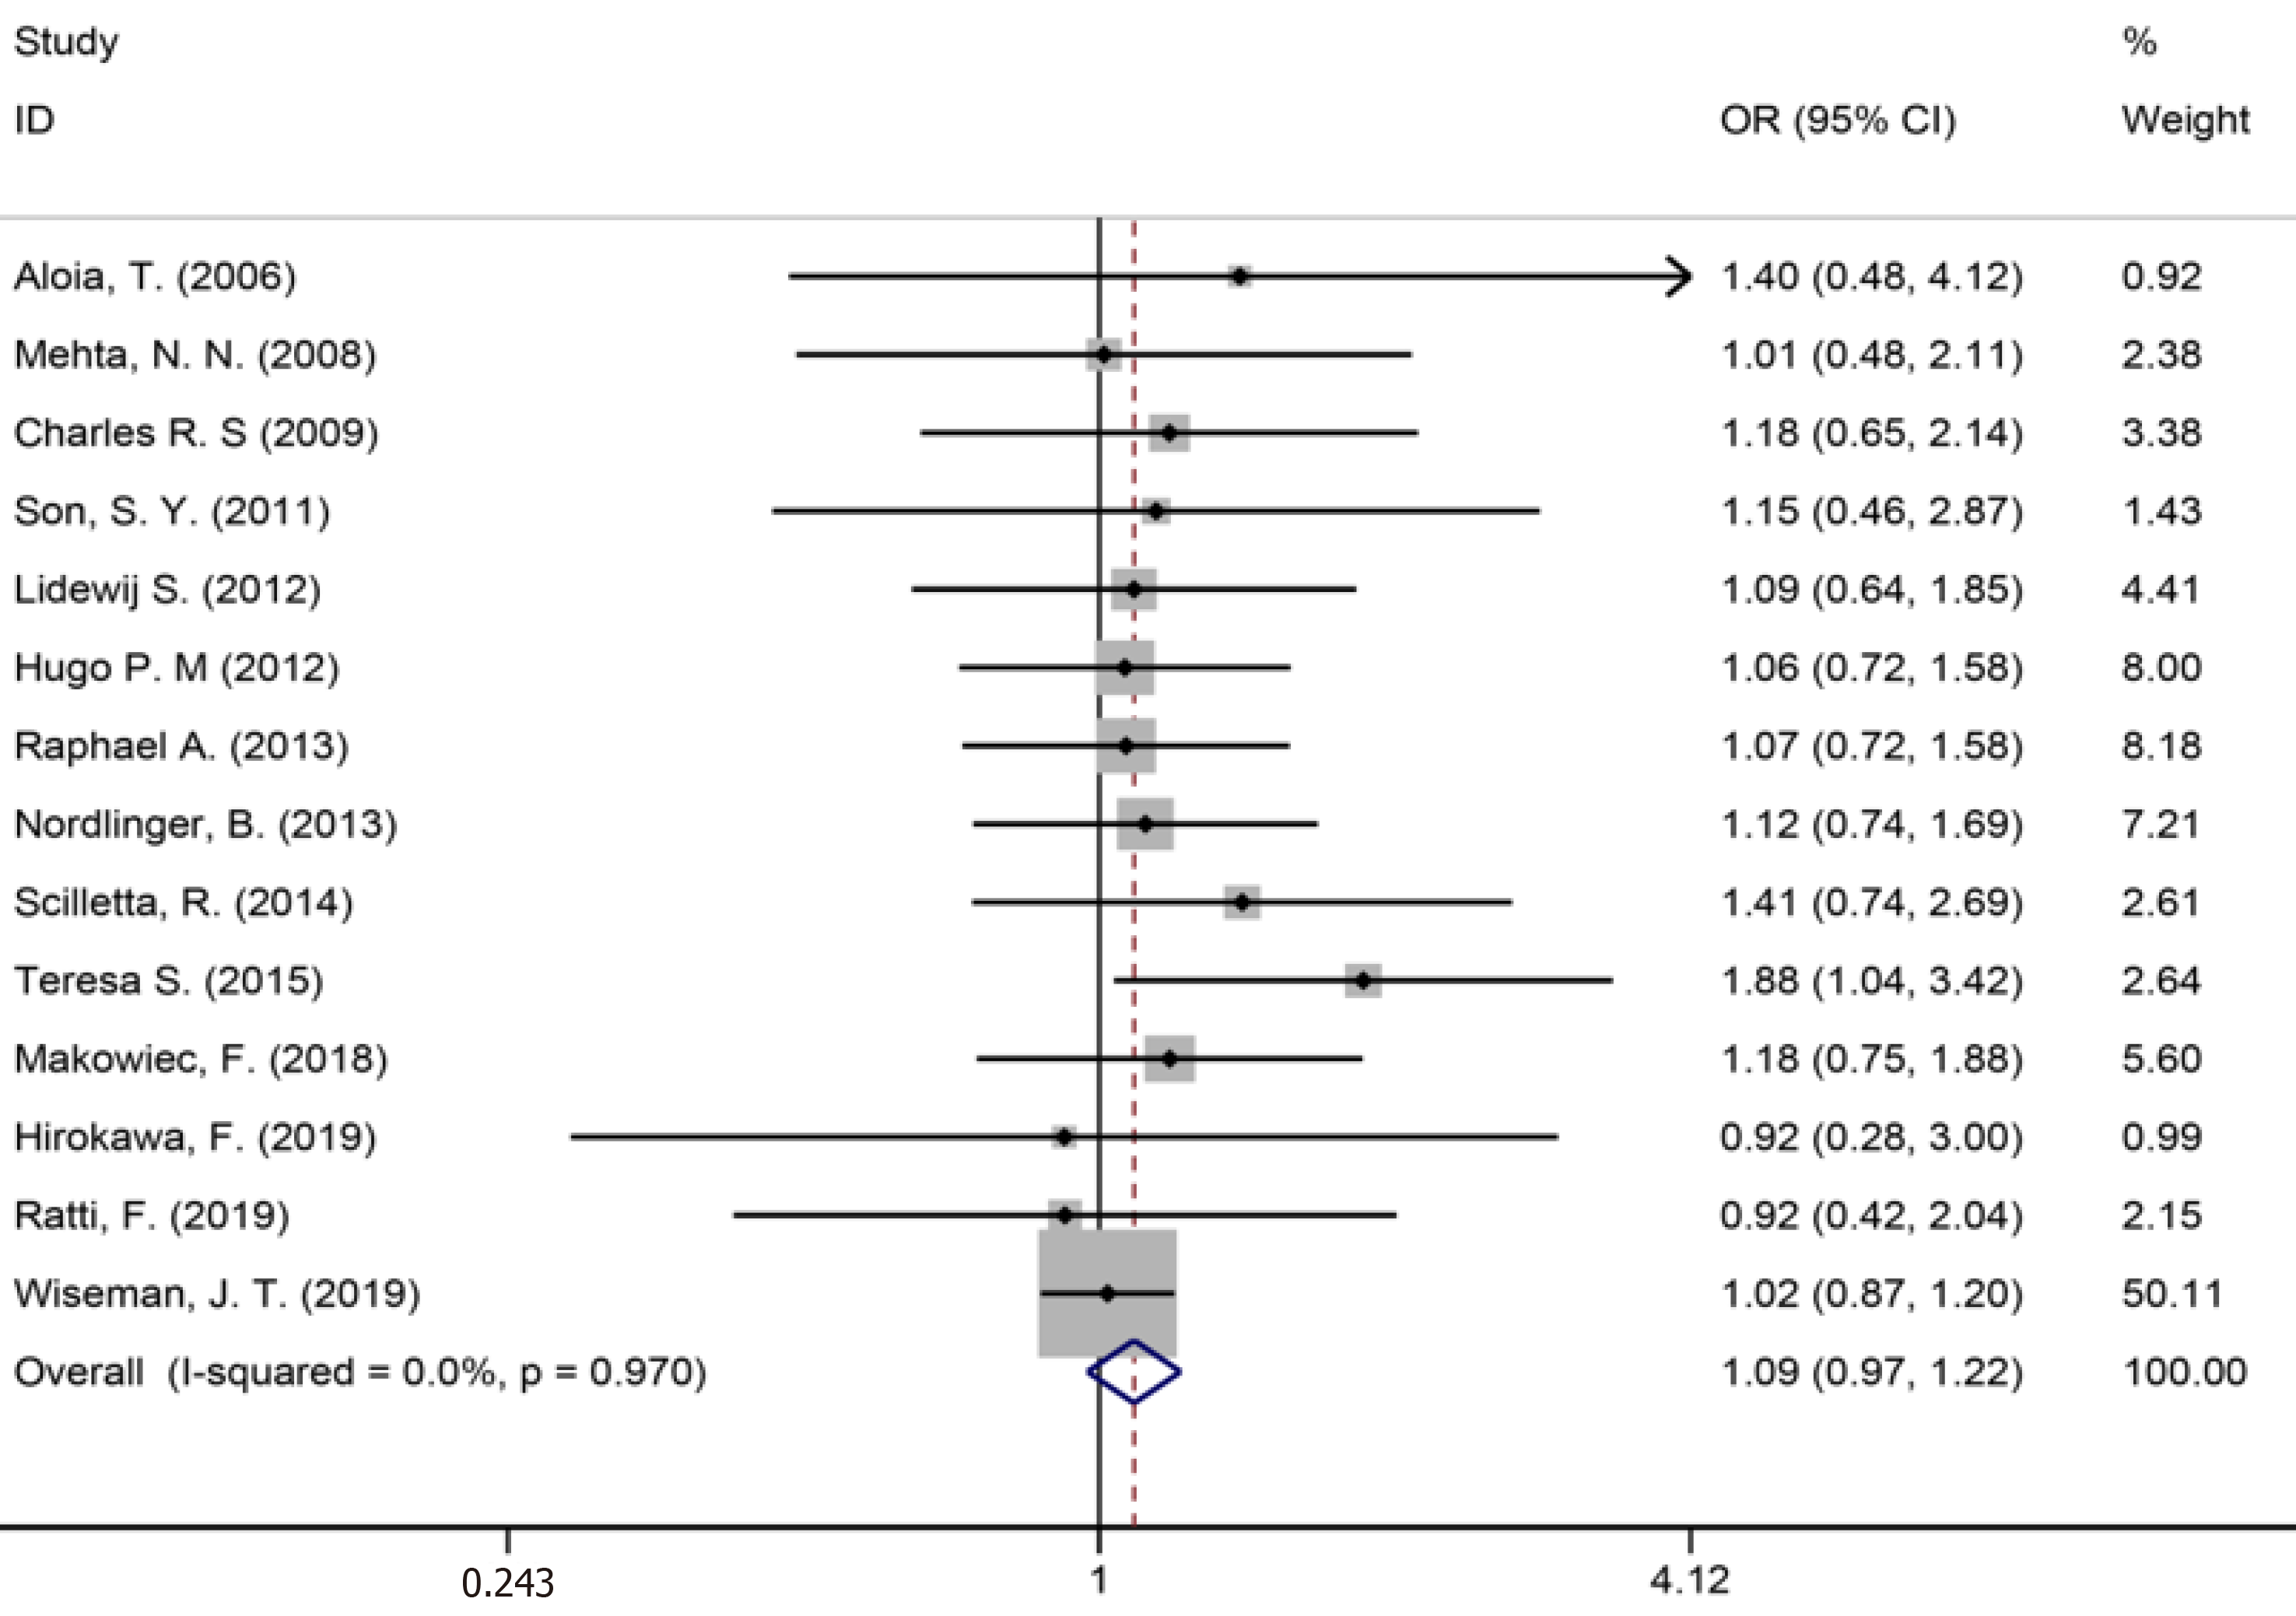
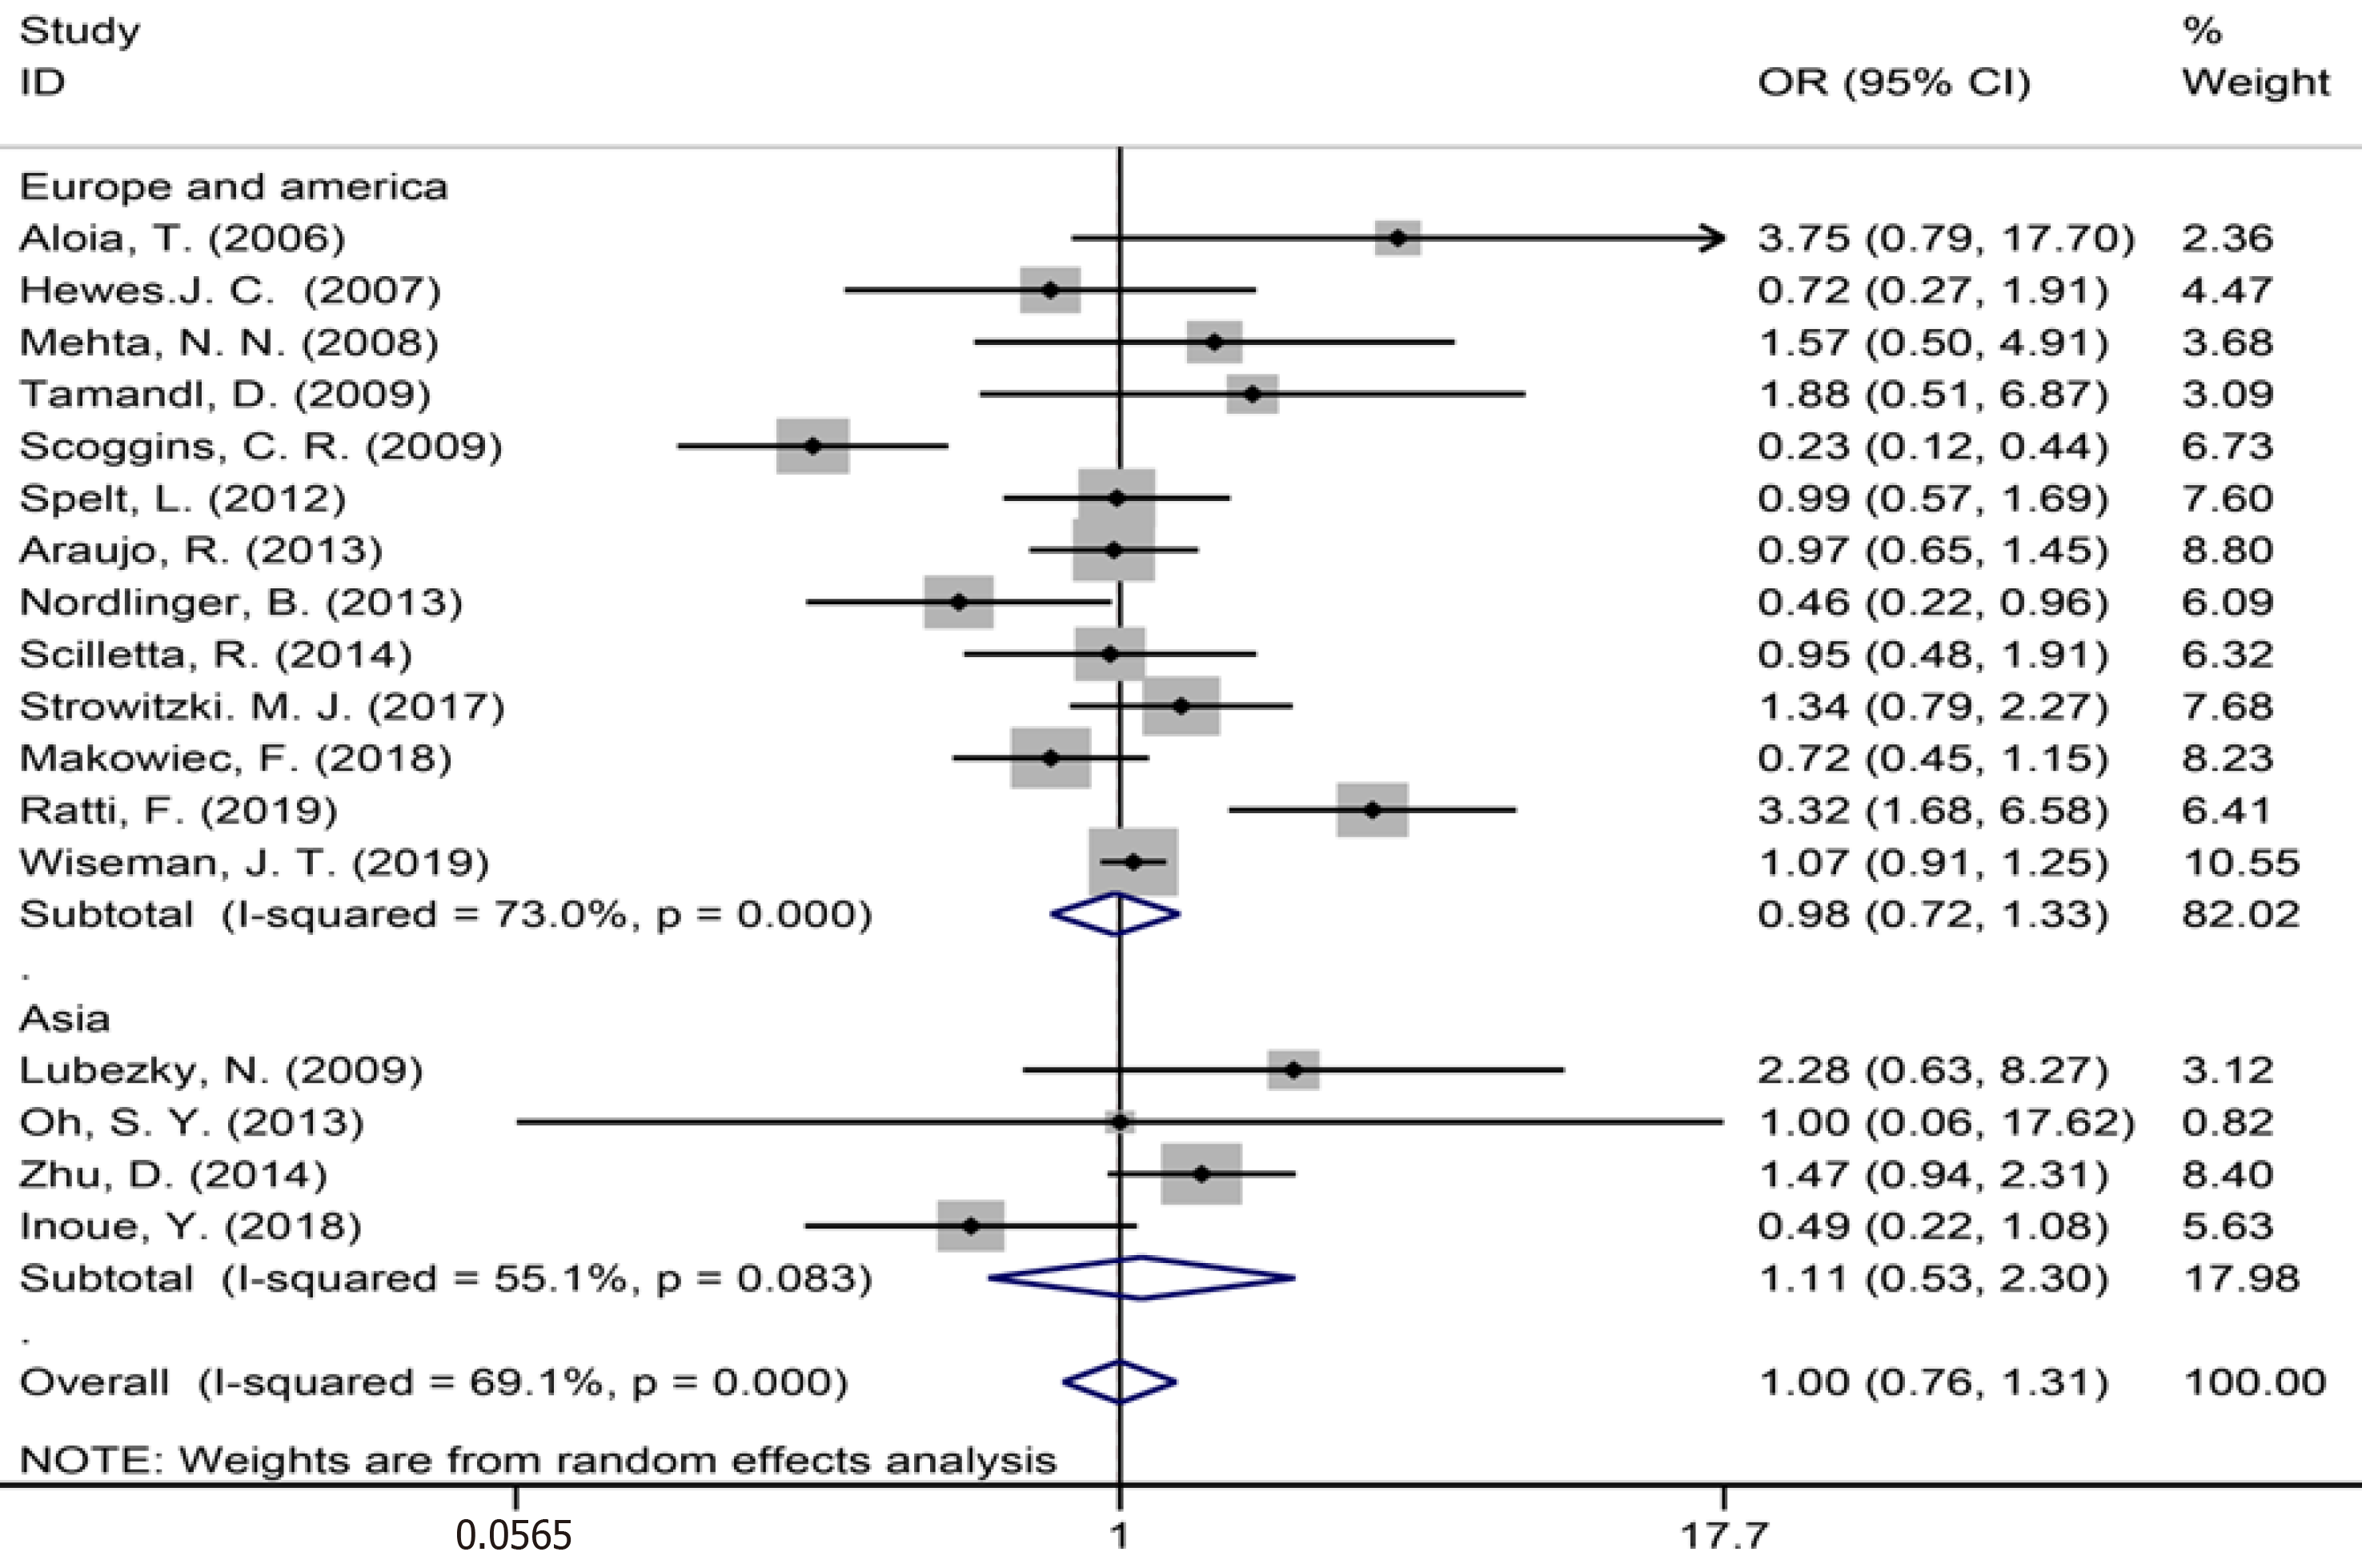
Figure 14 Perioperative complications for all patients and by study region.
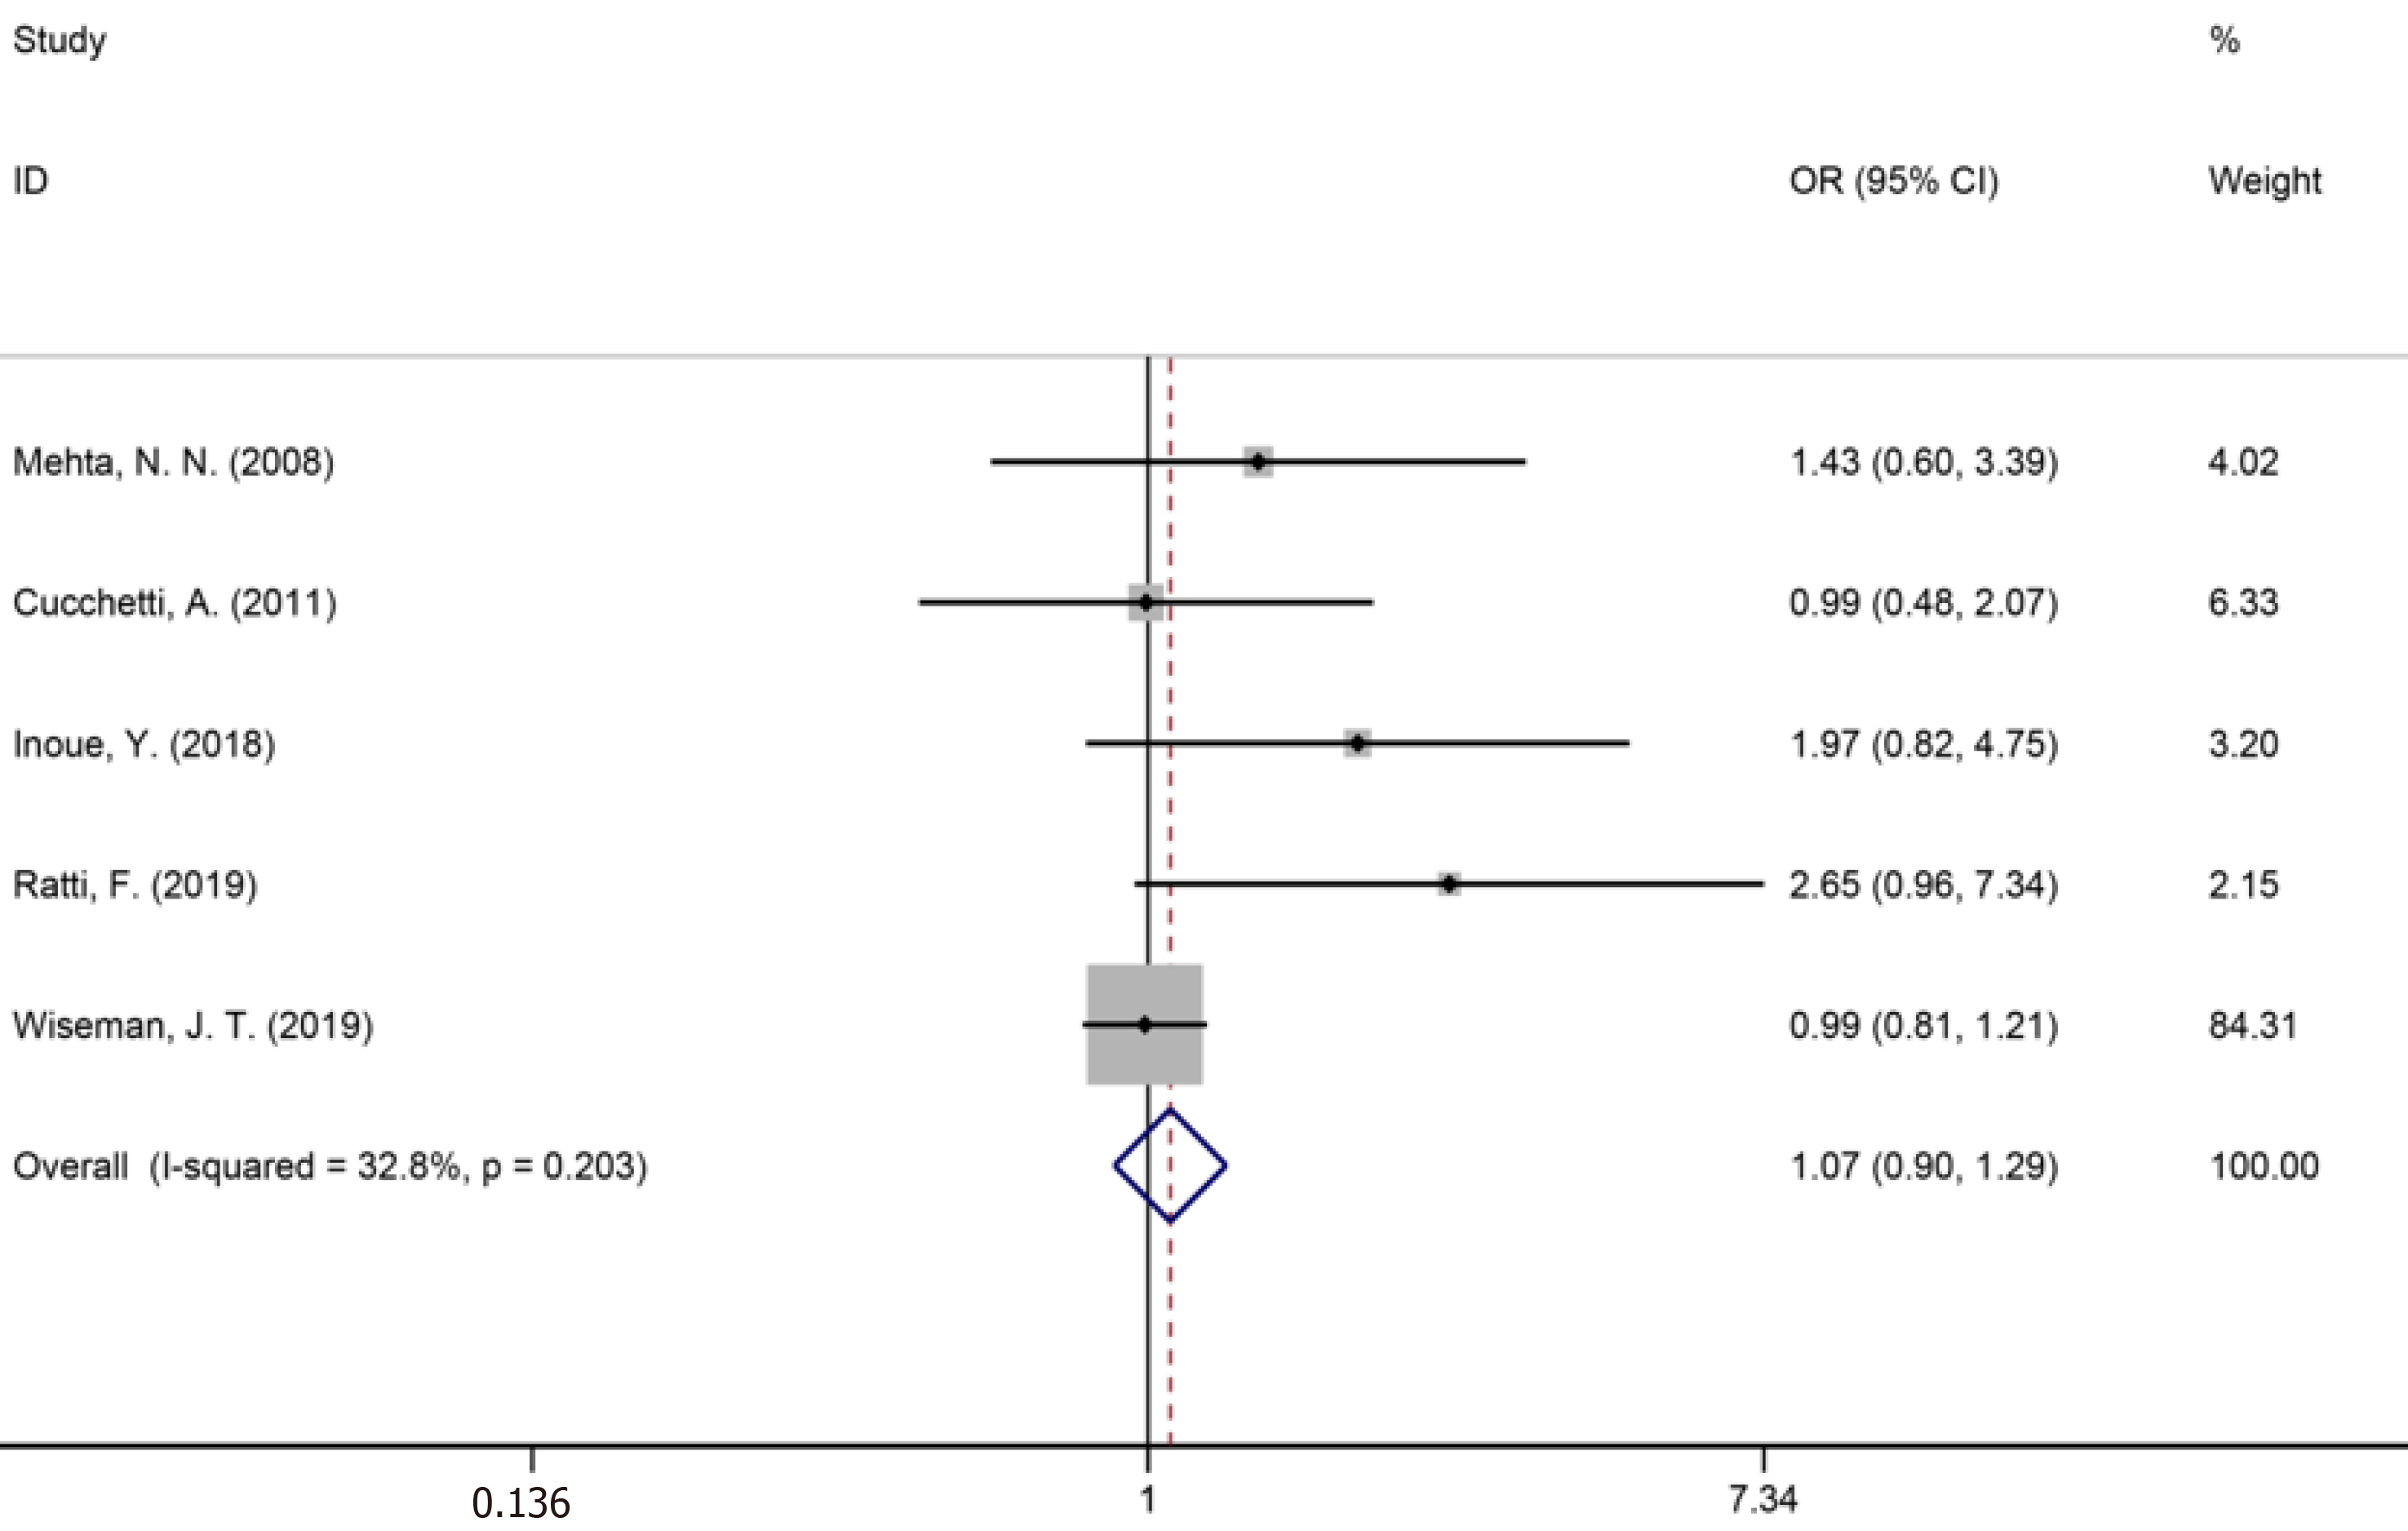
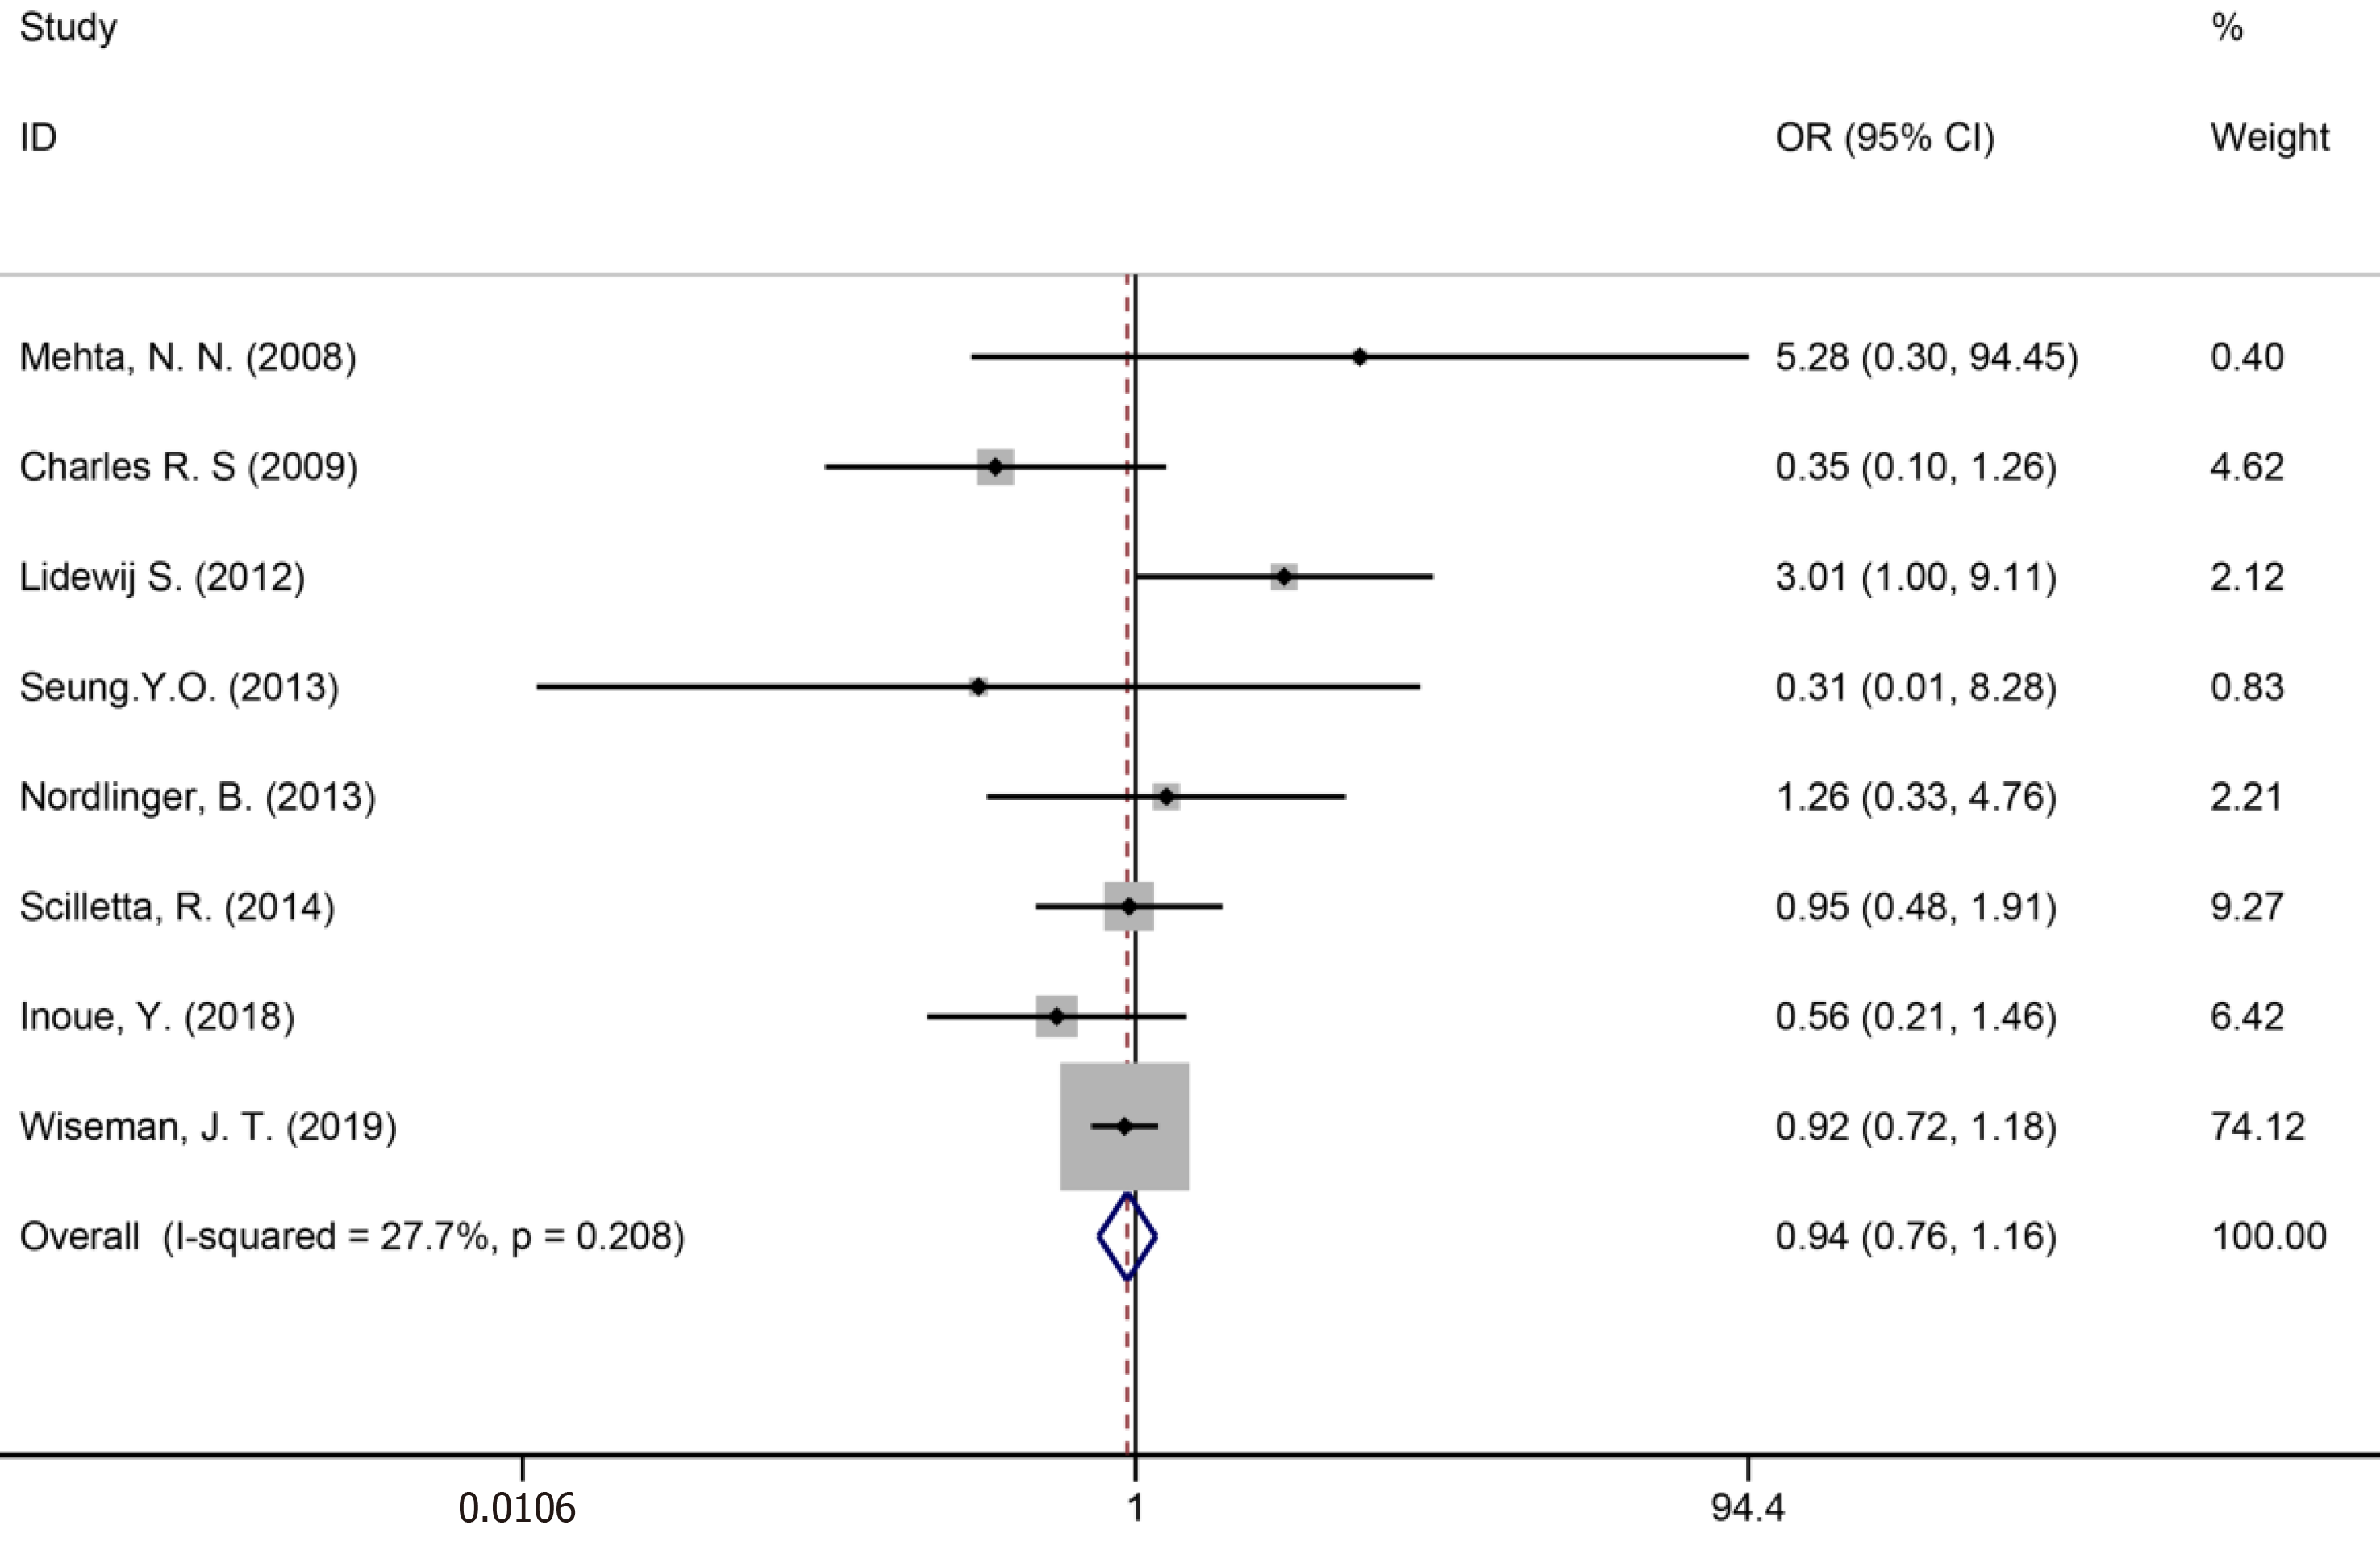
Figure 15 Bile leakage for all patients and two groups.
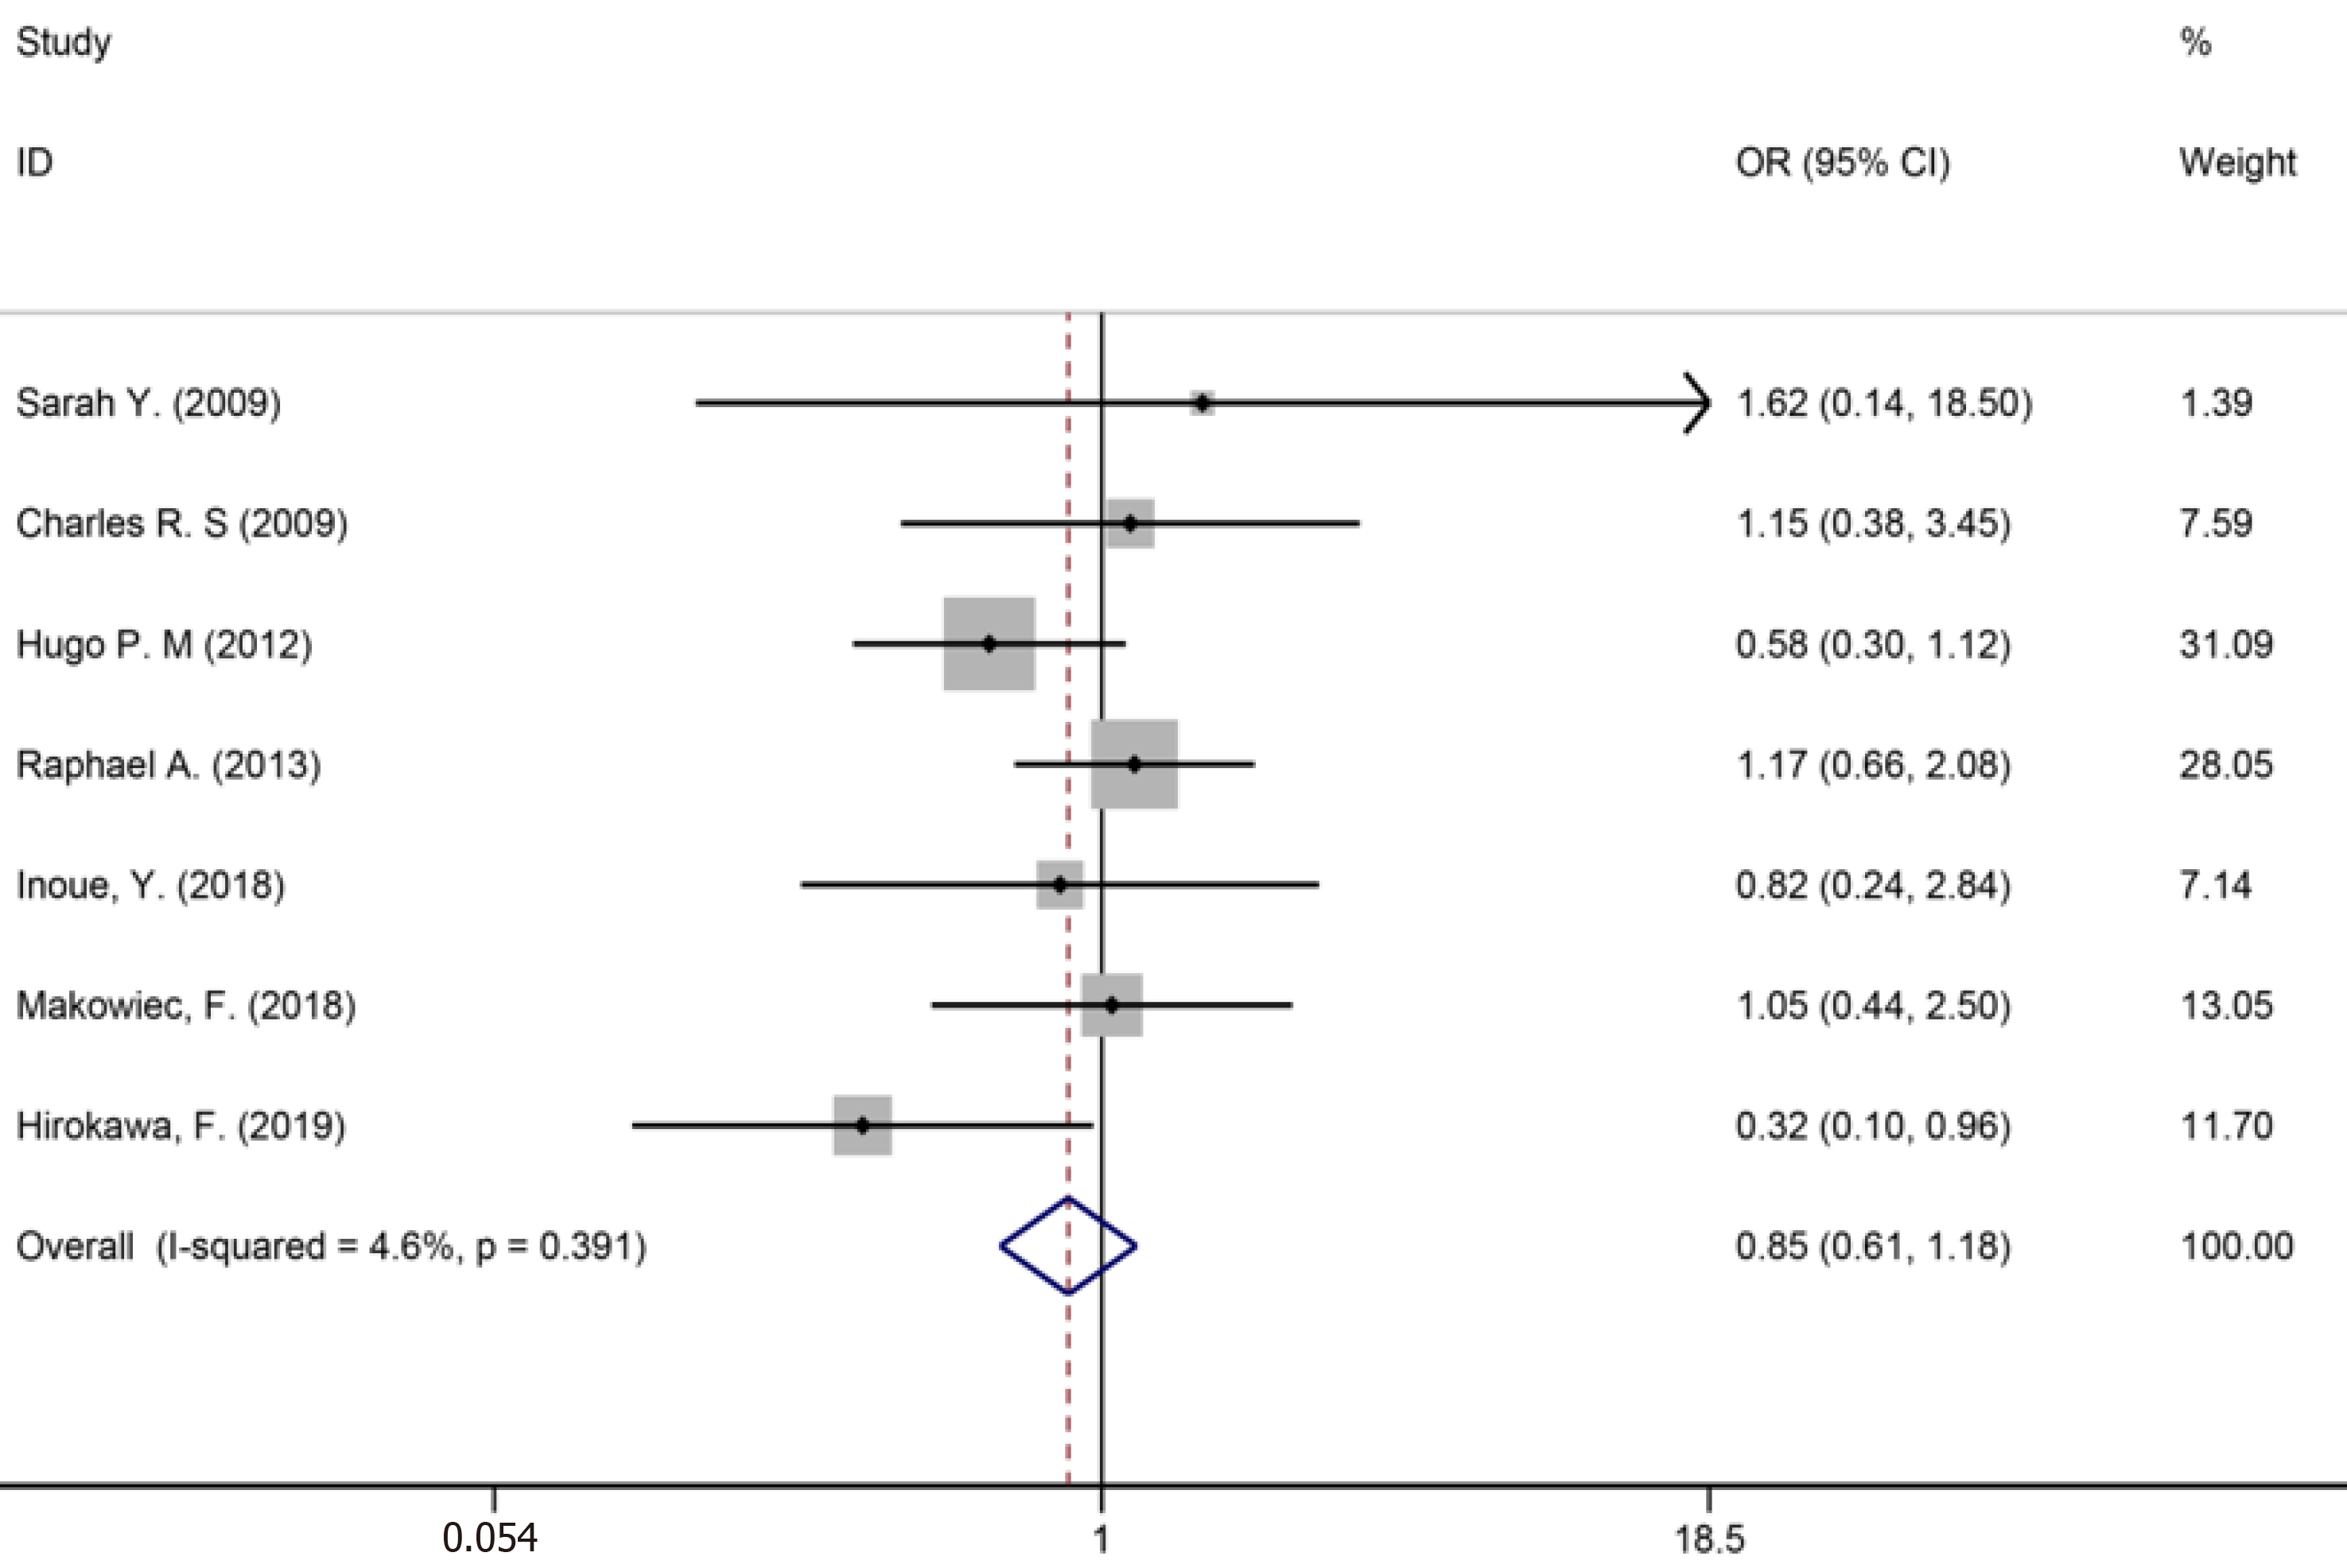
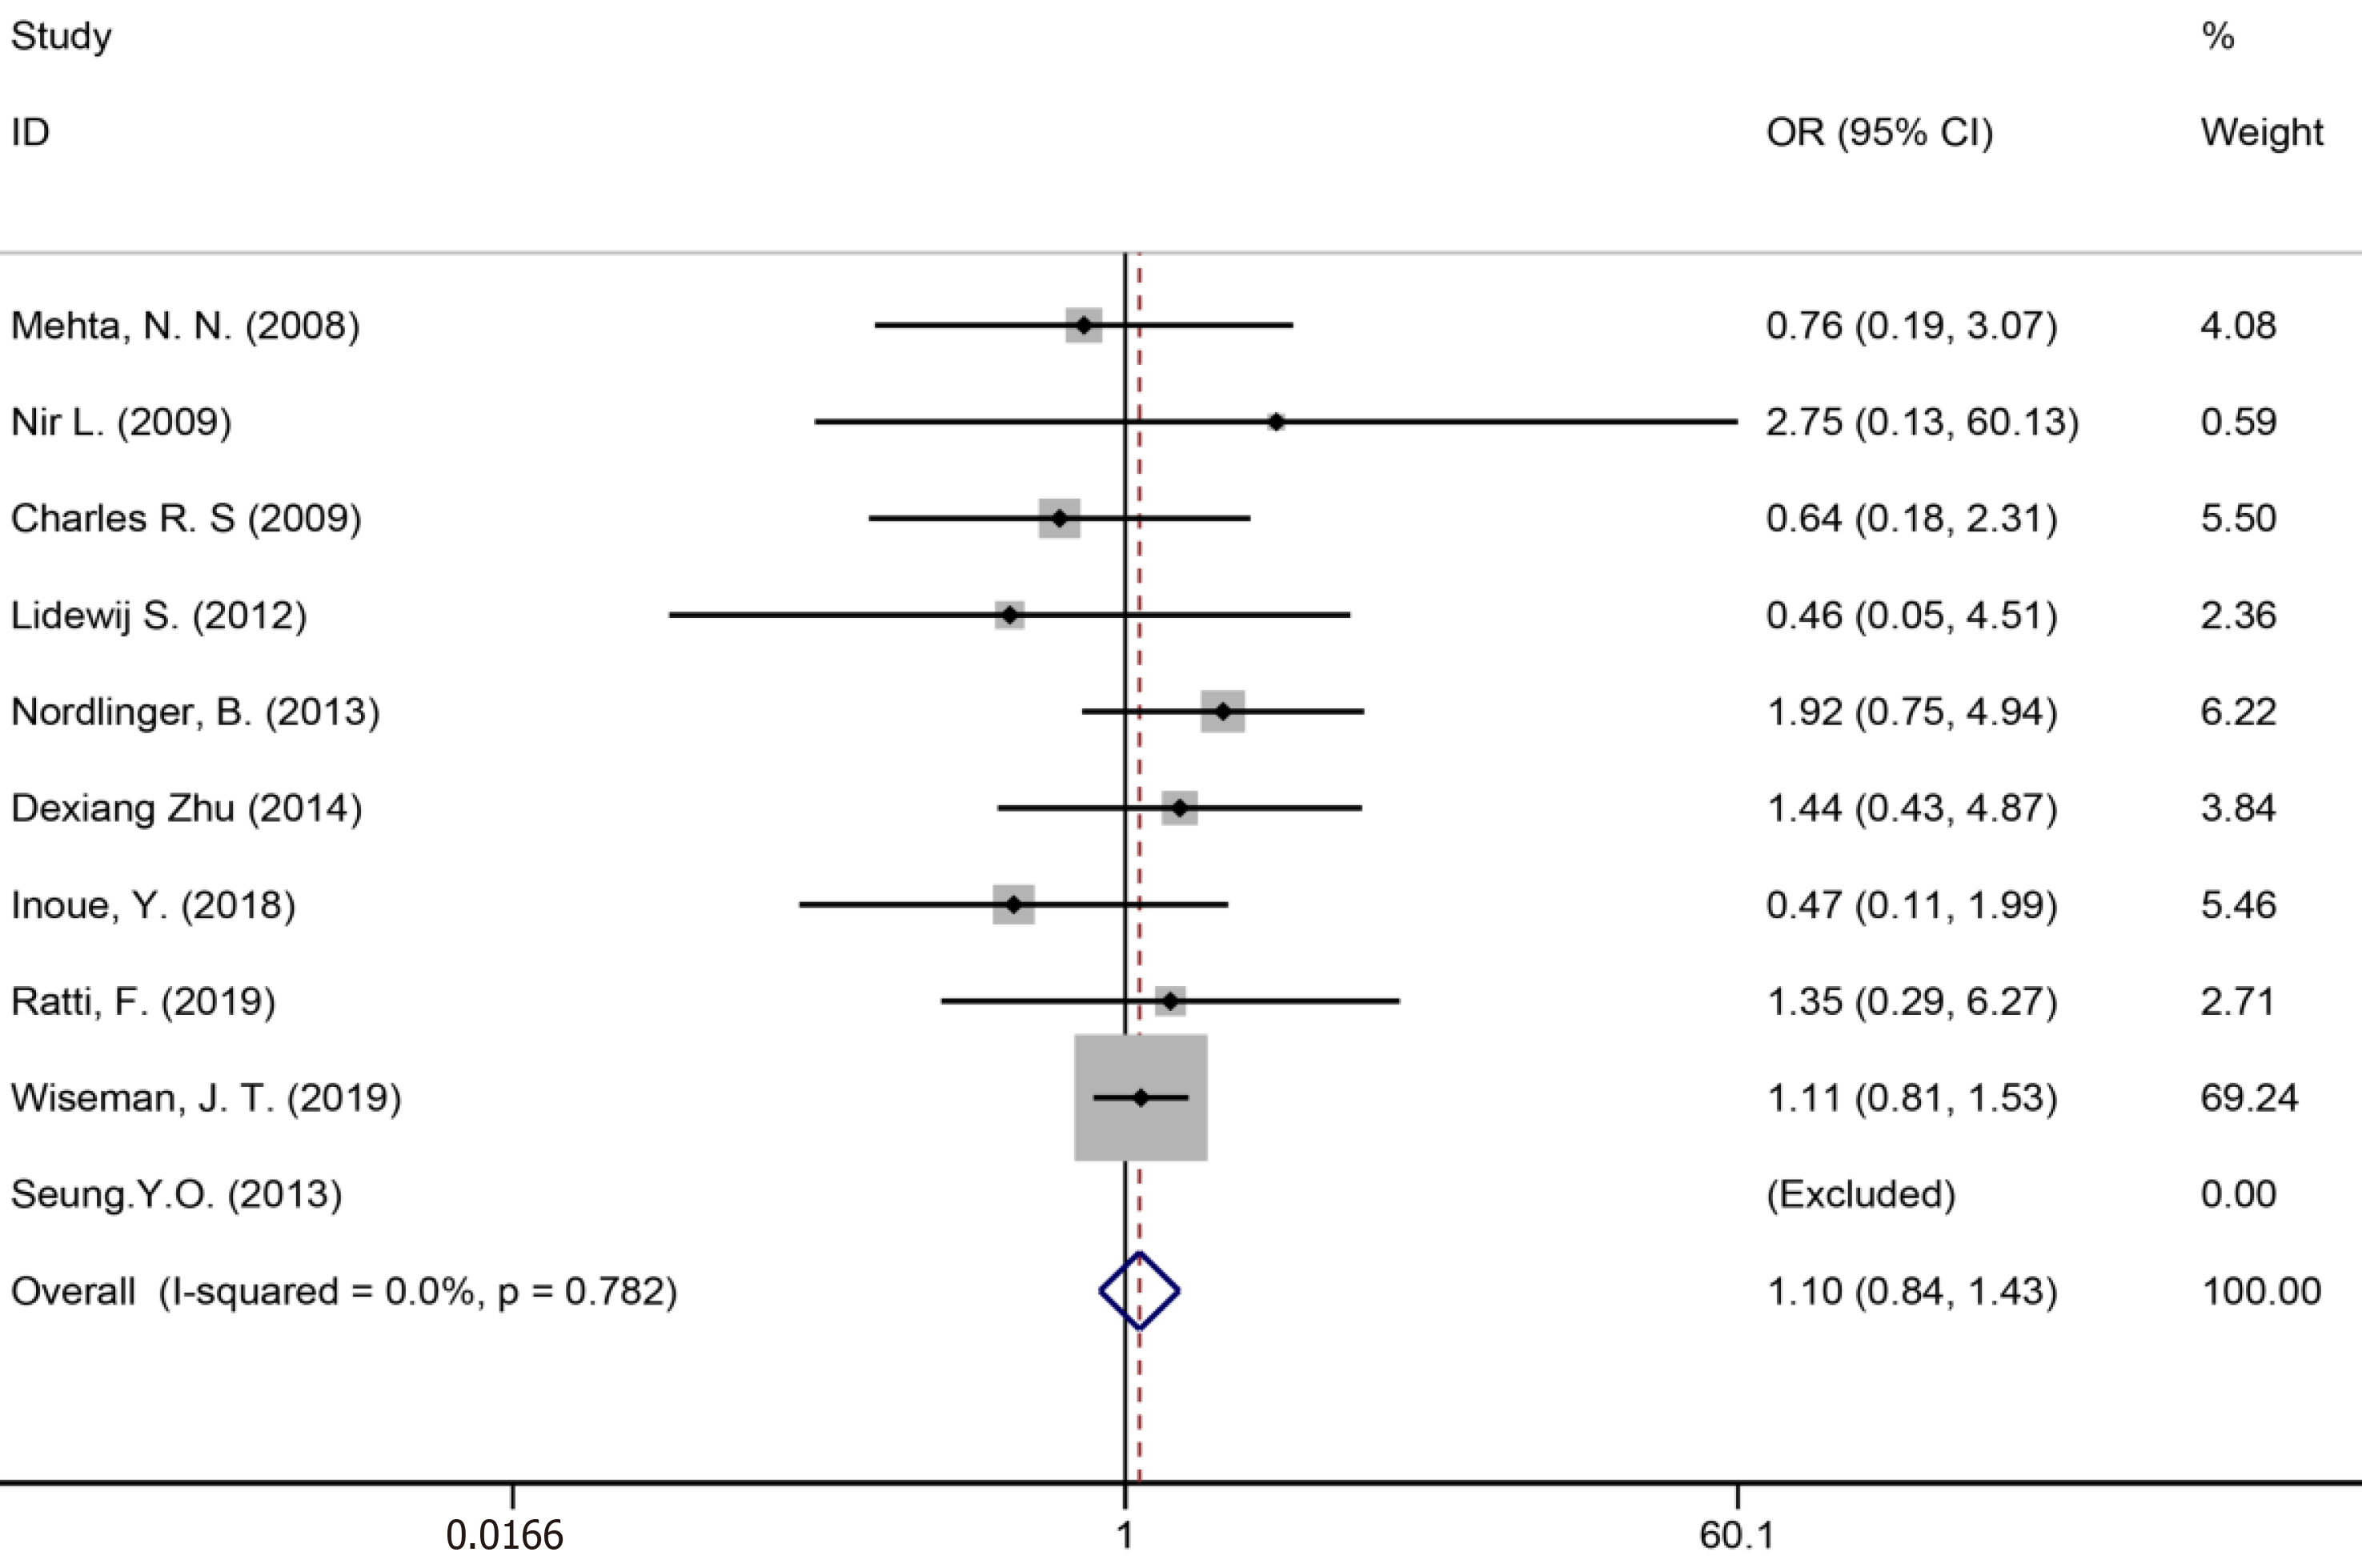
Figure 16 Surgical site infections for all patients and two groups.
Figure 17 Liver failure for all patients and two groups.
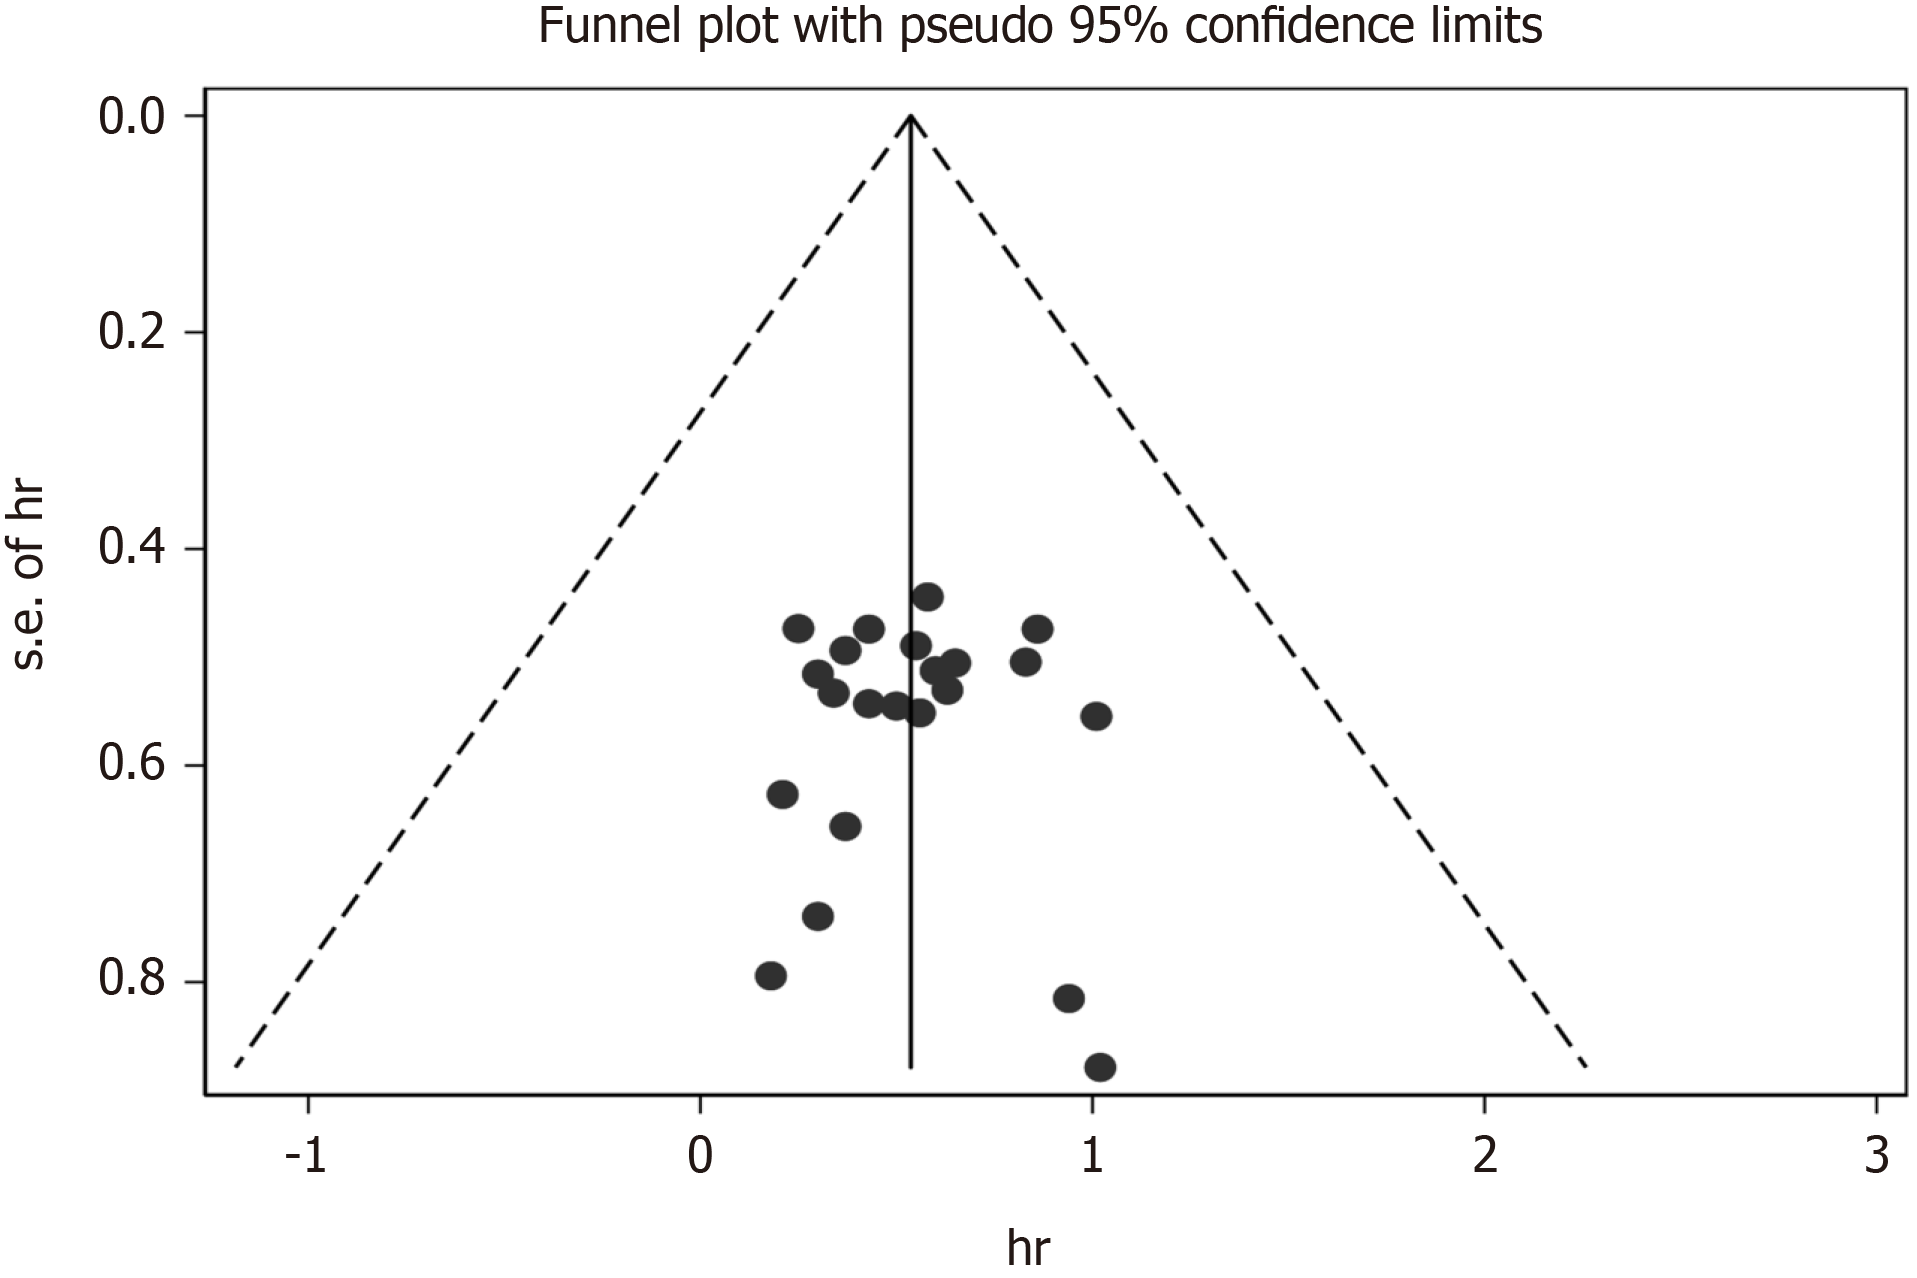
Figure 18 Funnel plot for potential publication bias of overall survival.
- Citation: Zhang Y, Ge L, Weng J, Tuo WY, Liu B, Ma SX, Yang KH, Cai H. Neoadjuvant chemotherapy for patients with resectable colorectal cancer liver metastases: A systematic review and meta-analysis. World J Clin Cases 2021; 9(22): 6357-6379
- URL: https://www.wjgnet.com/2307-8960/full/v9/i22/6357.htm
- DOI: https://dx.doi.org/10.12998/wjcc.v9.i22.6357


