Copyright
©The Author(s) 2021.
World J Clin Cases. Aug 6, 2021; 9(22): 6234-6243
Published online Aug 6, 2021. doi: 10.12998/wjcc.v9.i22.6234
Published online Aug 6, 2021. doi: 10.12998/wjcc.v9.i22.6234
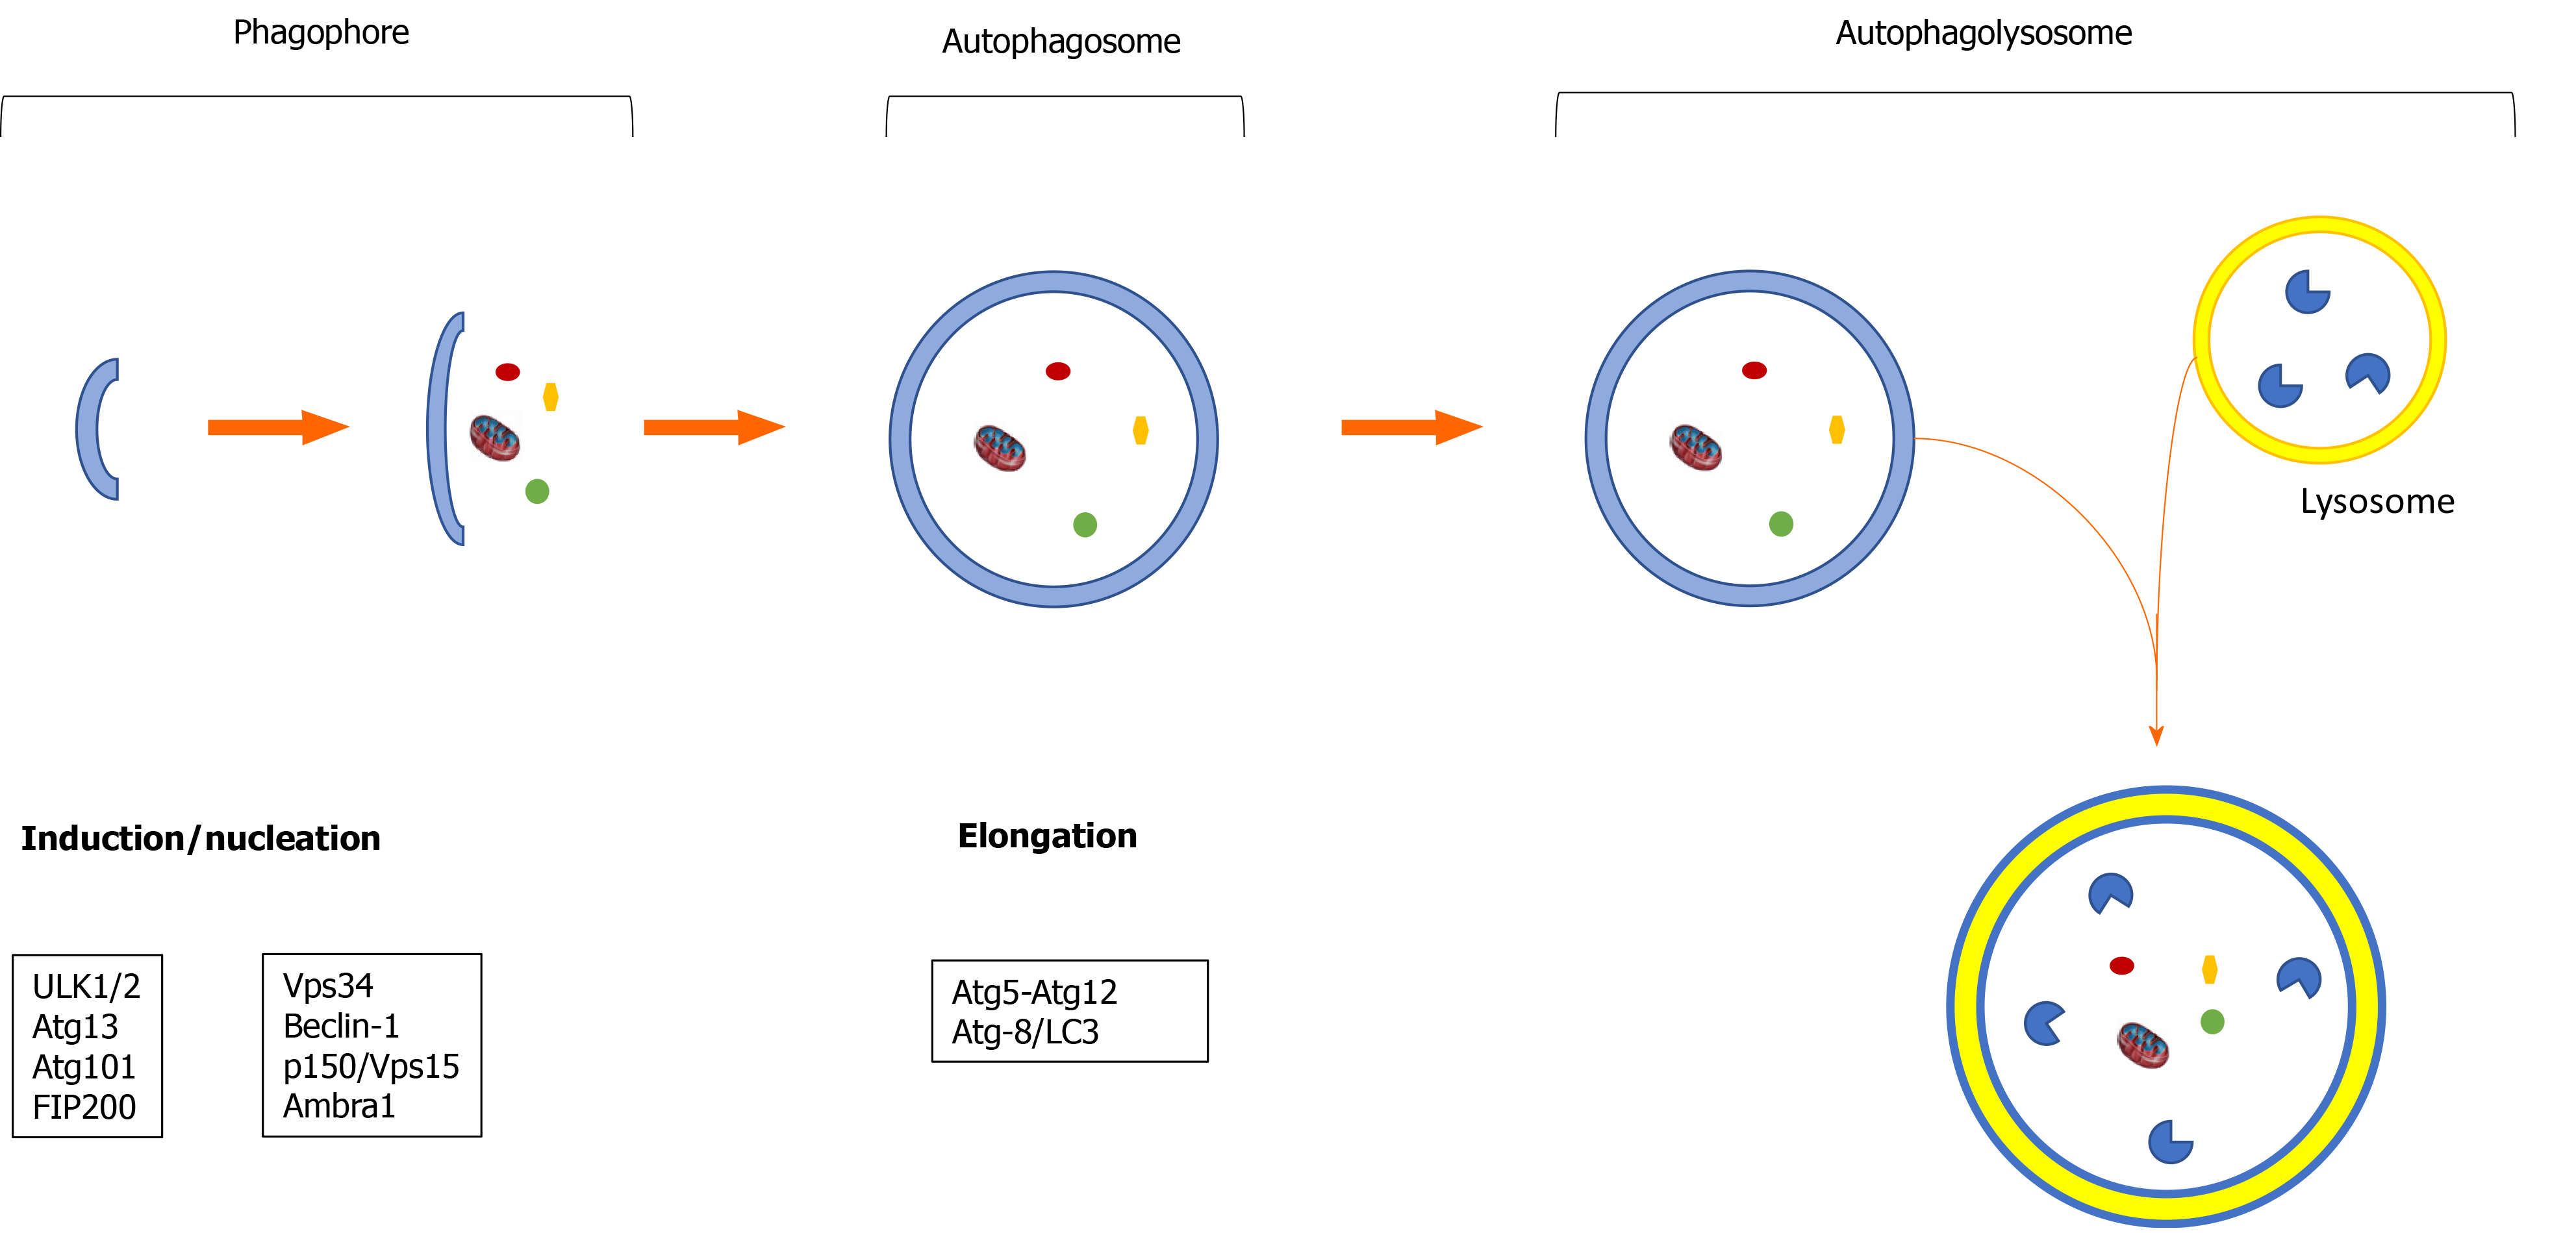
Figure 1 The autophagolysosome formation.
Schematic representation of the pathways involved in the processes of induction/nucleation, elongation and final formation of the autophagolysosome. LC3: Light chain 3.
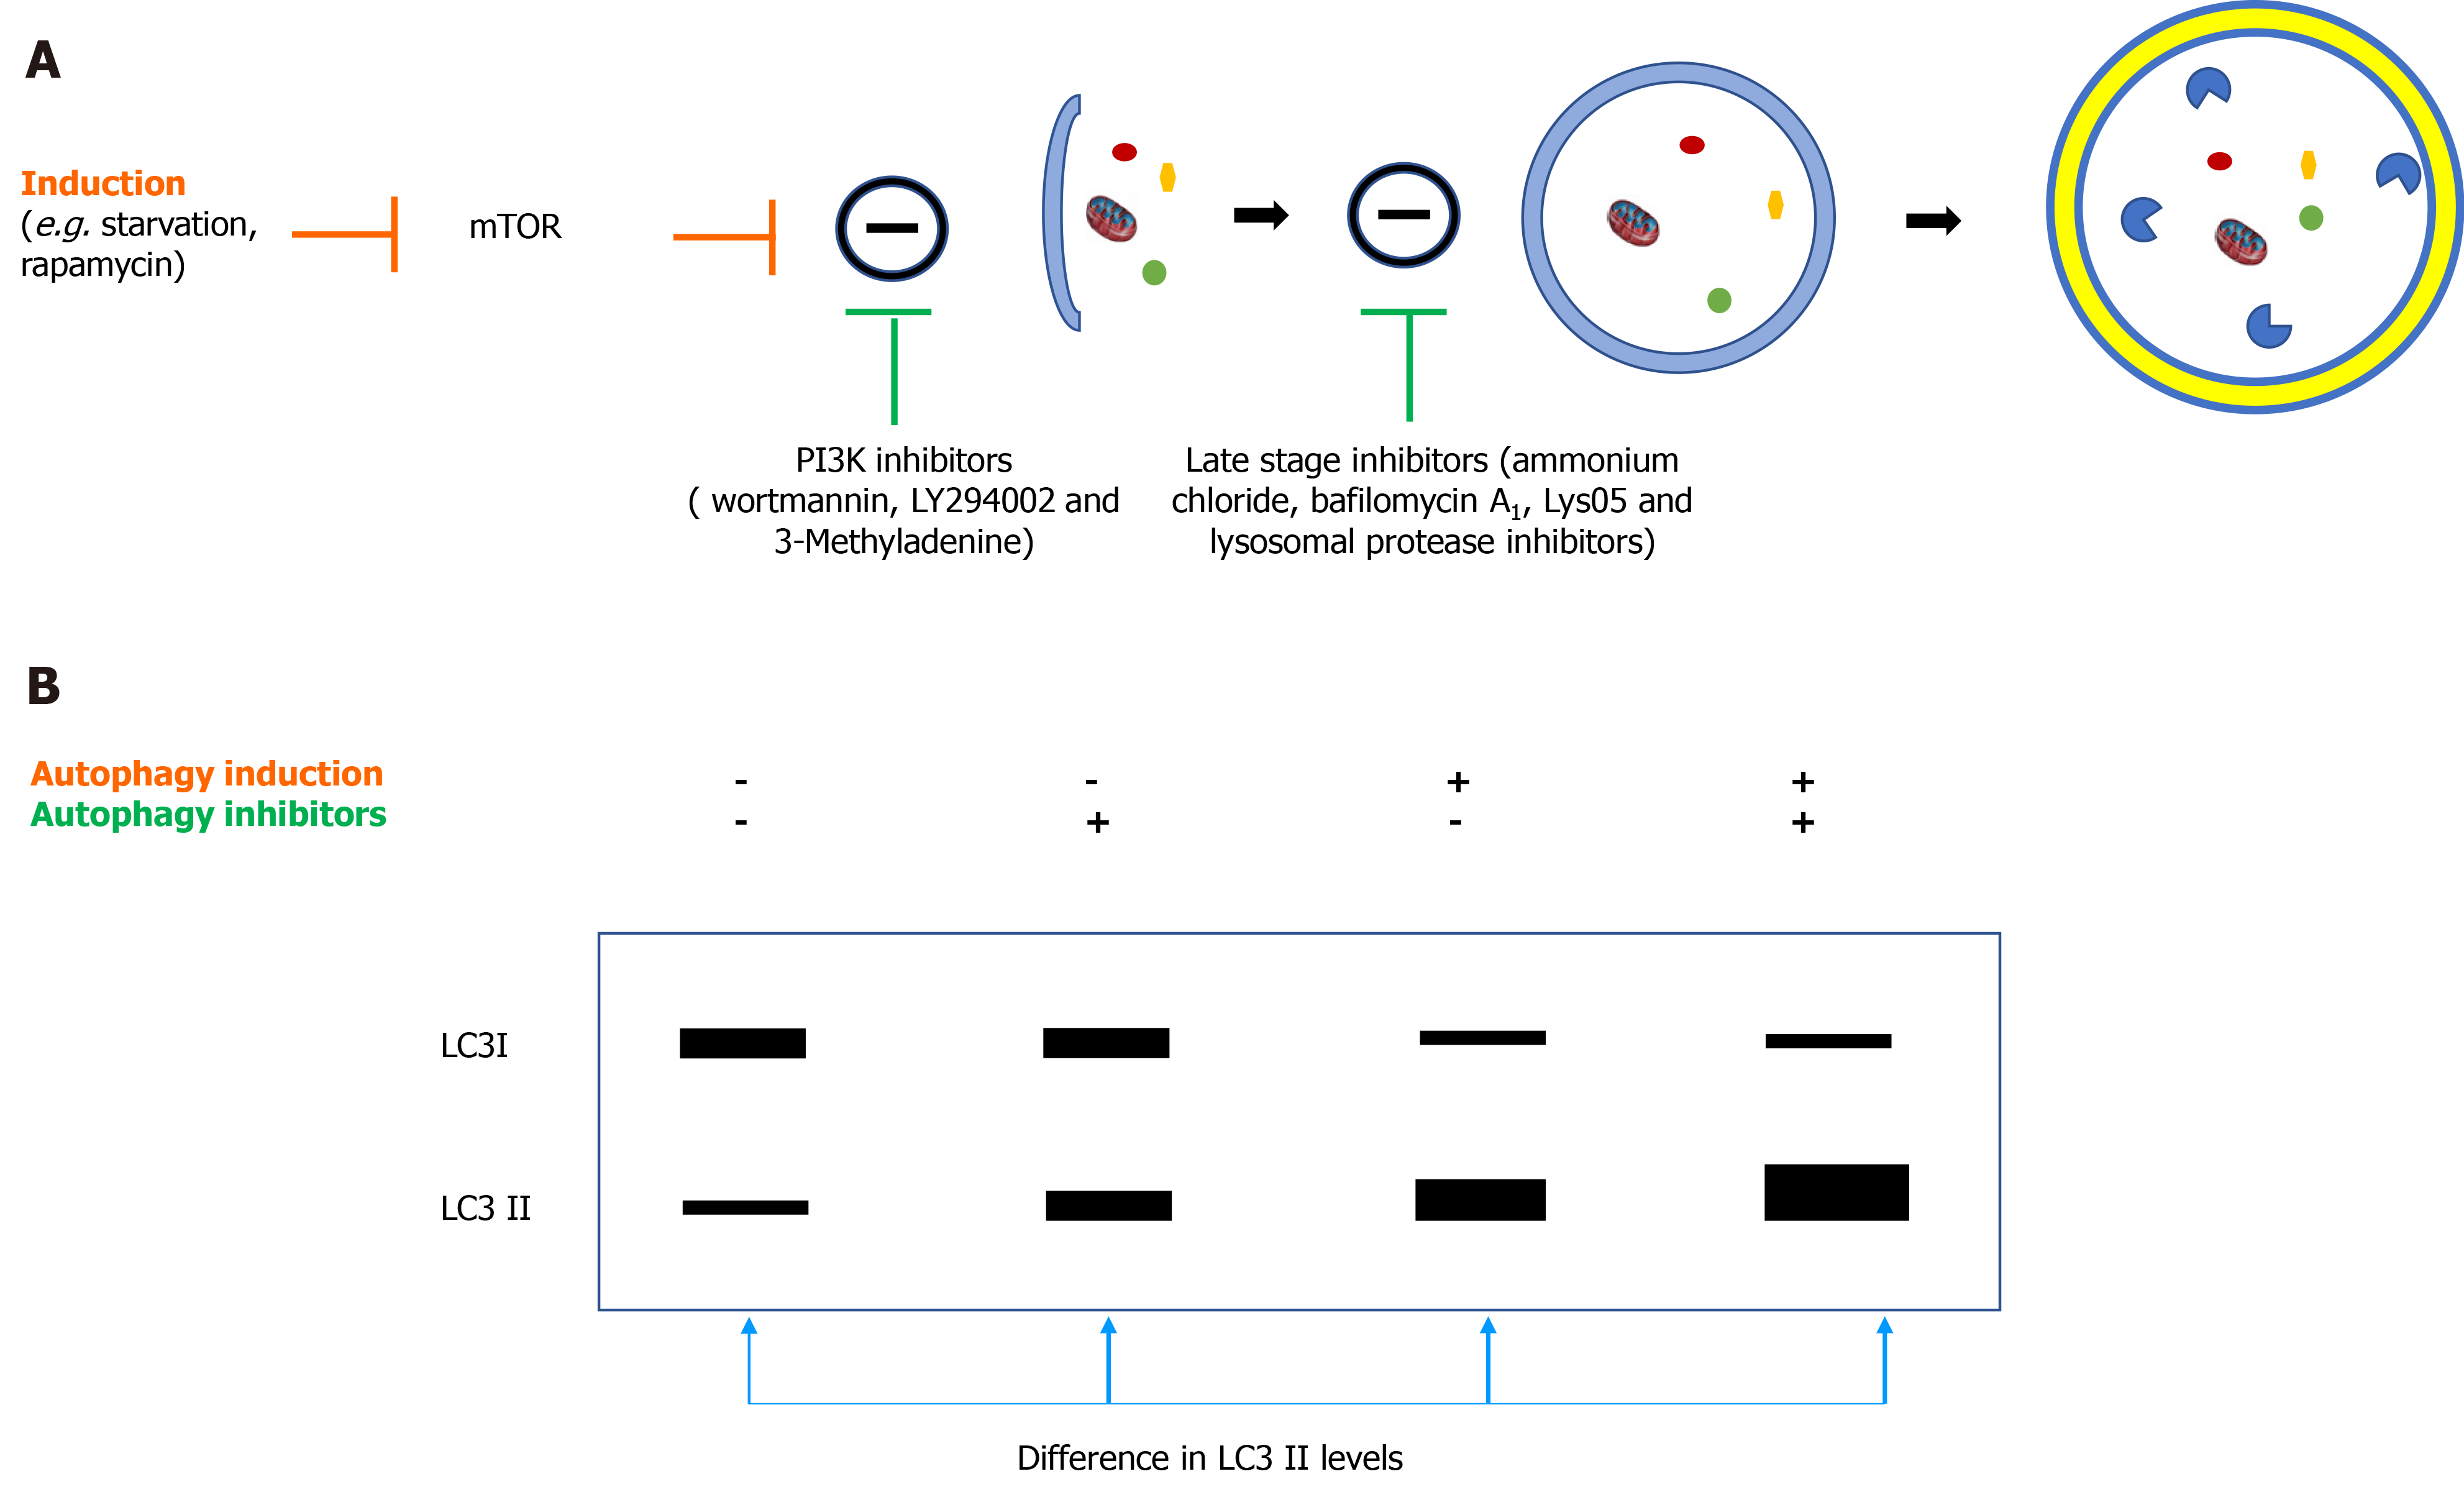
Figure 2 Effects of induction/inhibition on autophagy.
A: Autophagic flow and sites of action of inducers/inhibitors; B: Protein expression of light chain 3 (LC3) measured with the conversion of LC3-I (cytosolic form) to LC3-II (membrane-bound conjugated form). LC3: Light chain 3; mTOR: Mammalian target of rapamycin.
- Citation: Ninfole E, Pinto C, Benedetti A, Marzioni M, Maroni L. Role of autophagy in cholangiocarcinoma: Pathophysiology and implications for therapy. World J Clin Cases 2021; 9(22): 6234-6243
- URL: https://www.wjgnet.com/2307-8960/full/v9/i22/6234.htm
- DOI: https://dx.doi.org/10.12998/wjcc.v9.i22.6234


