Copyright
©The Author(s) 2021.
World J Clin Cases. Jul 26, 2021; 9(21): 5860-5872
Published online Jul 26, 2021. doi: 10.12998/wjcc.v9.i21.5860
Published online Jul 26, 2021. doi: 10.12998/wjcc.v9.i21.5860
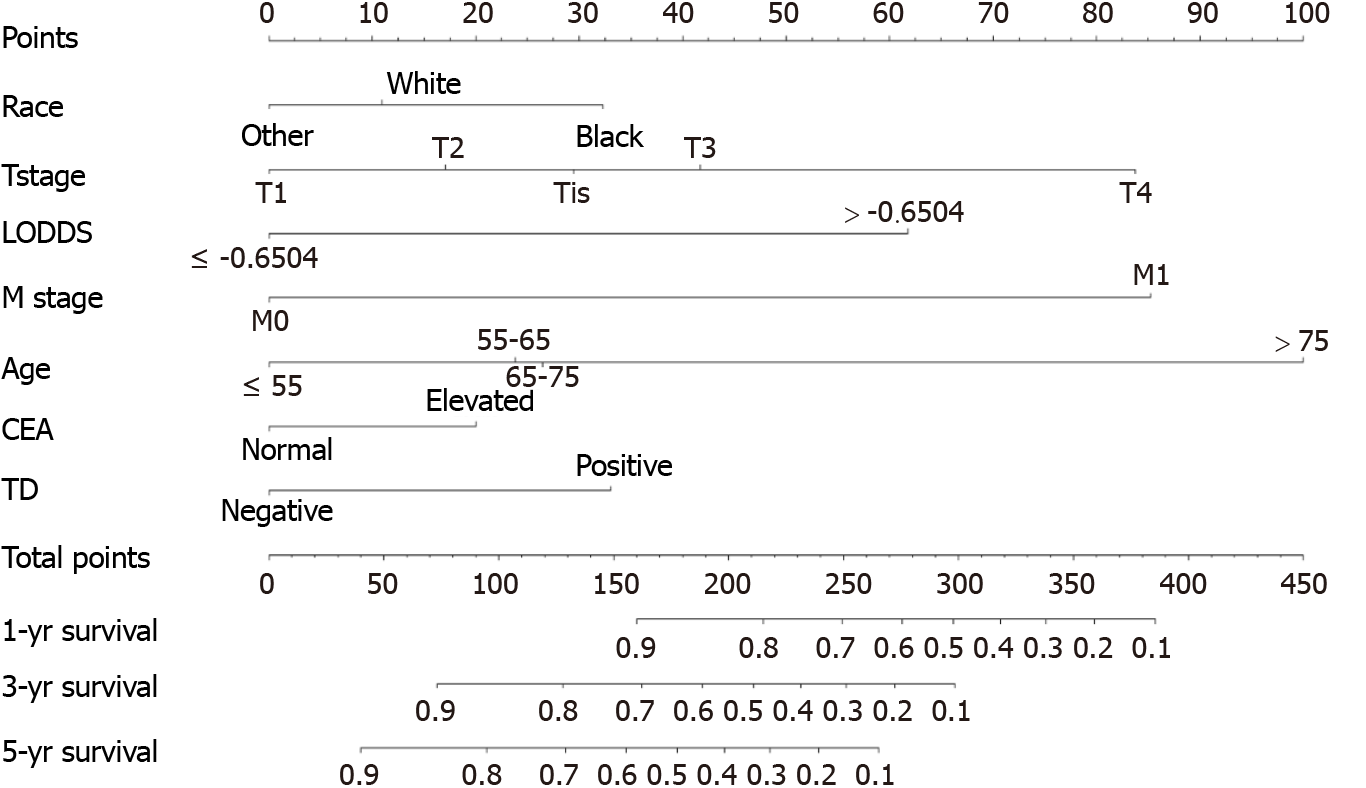
Figure 1 Nomogram for predicting overall survival rate of colorectal cancer patients after surgery.
The nomogram incorporated race, T stage, log odds of positive lymph nodes, M stage, age, carcinoembryonic antigen, and tumor deposit. It predicted the overall survival at 1, 3, and 5 years after surgery. CEA: Carcinoembryonic antigen; LODDS: Log odds of positive lymph nodes; TD: Tumor deposit.
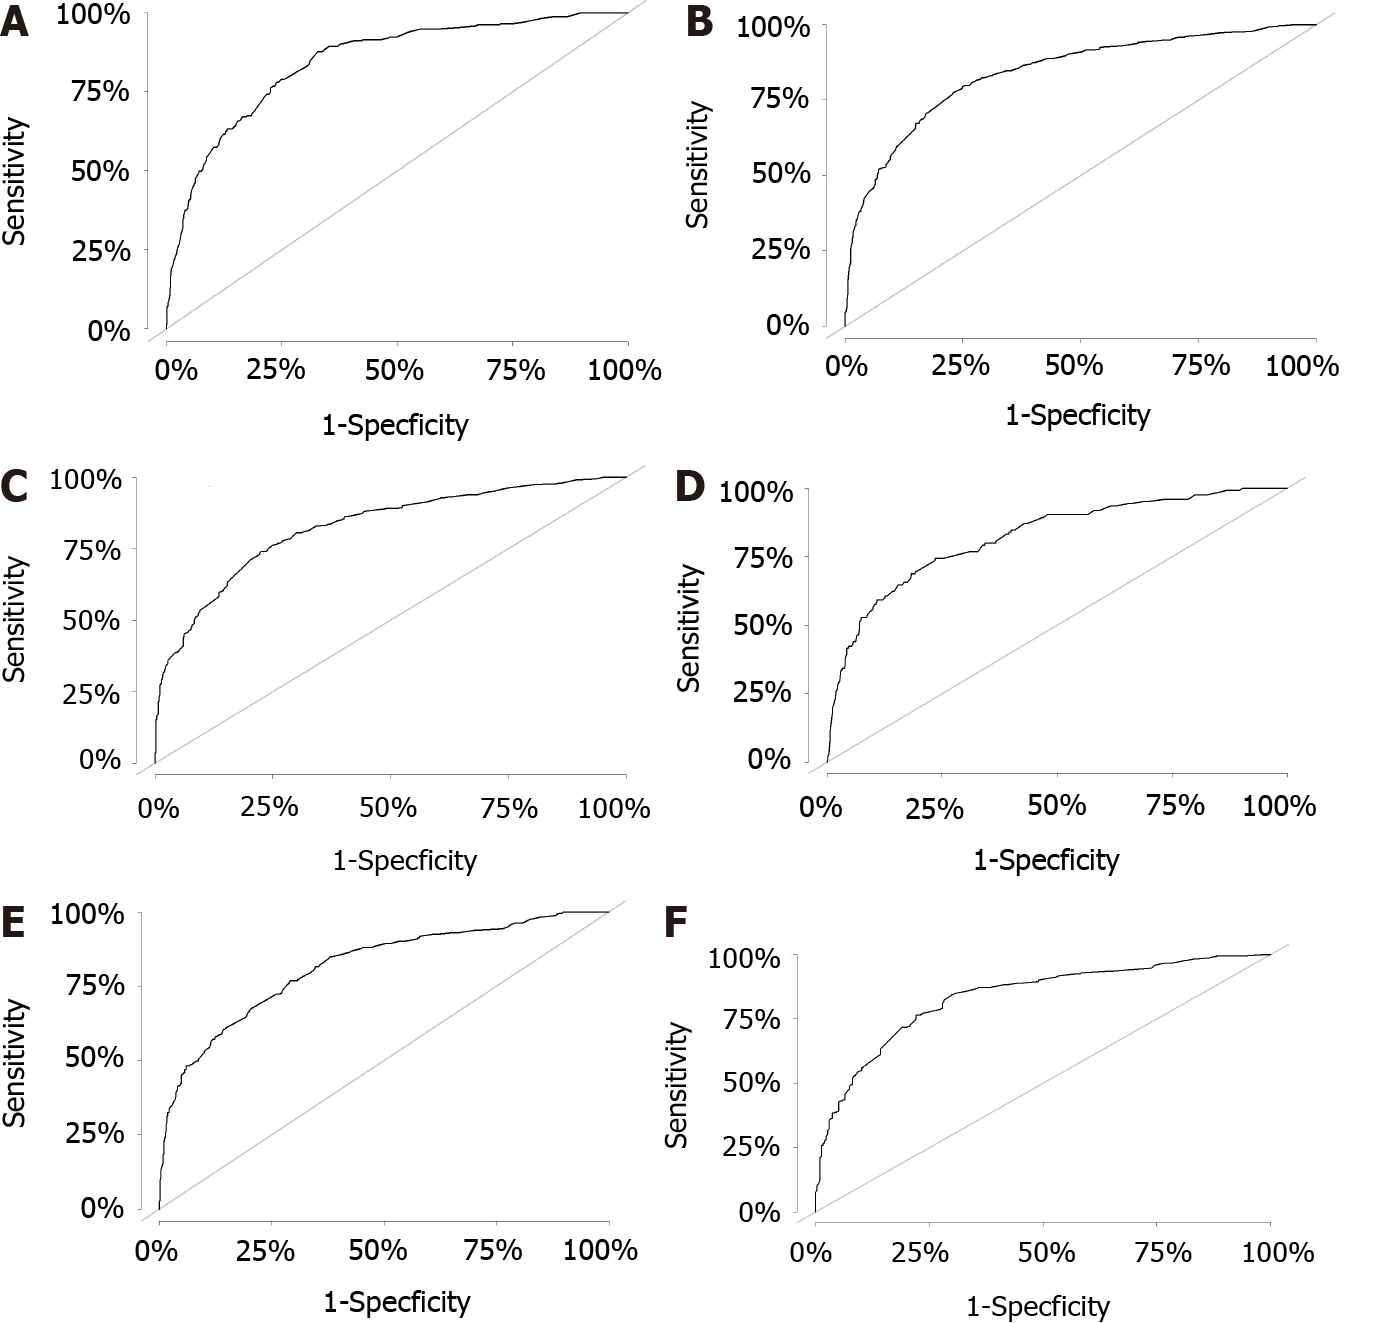
Figure 2 Area under the receiver operating characteristic curve.
A: 1-year overall survival (OS) rate predicted by the nomogram in the training set; B: 3-year OS rate predicted by the nomogram in the training set; C: 5-year OS rate predicted by the nomogram in the training set; D: 1-year OS rate predicted by the nomogram in the validation set; E: 3-year OS rate predicted by the nomogram in the validation set; F: 5-year OS rate predicted by the nomogram in the validation set.
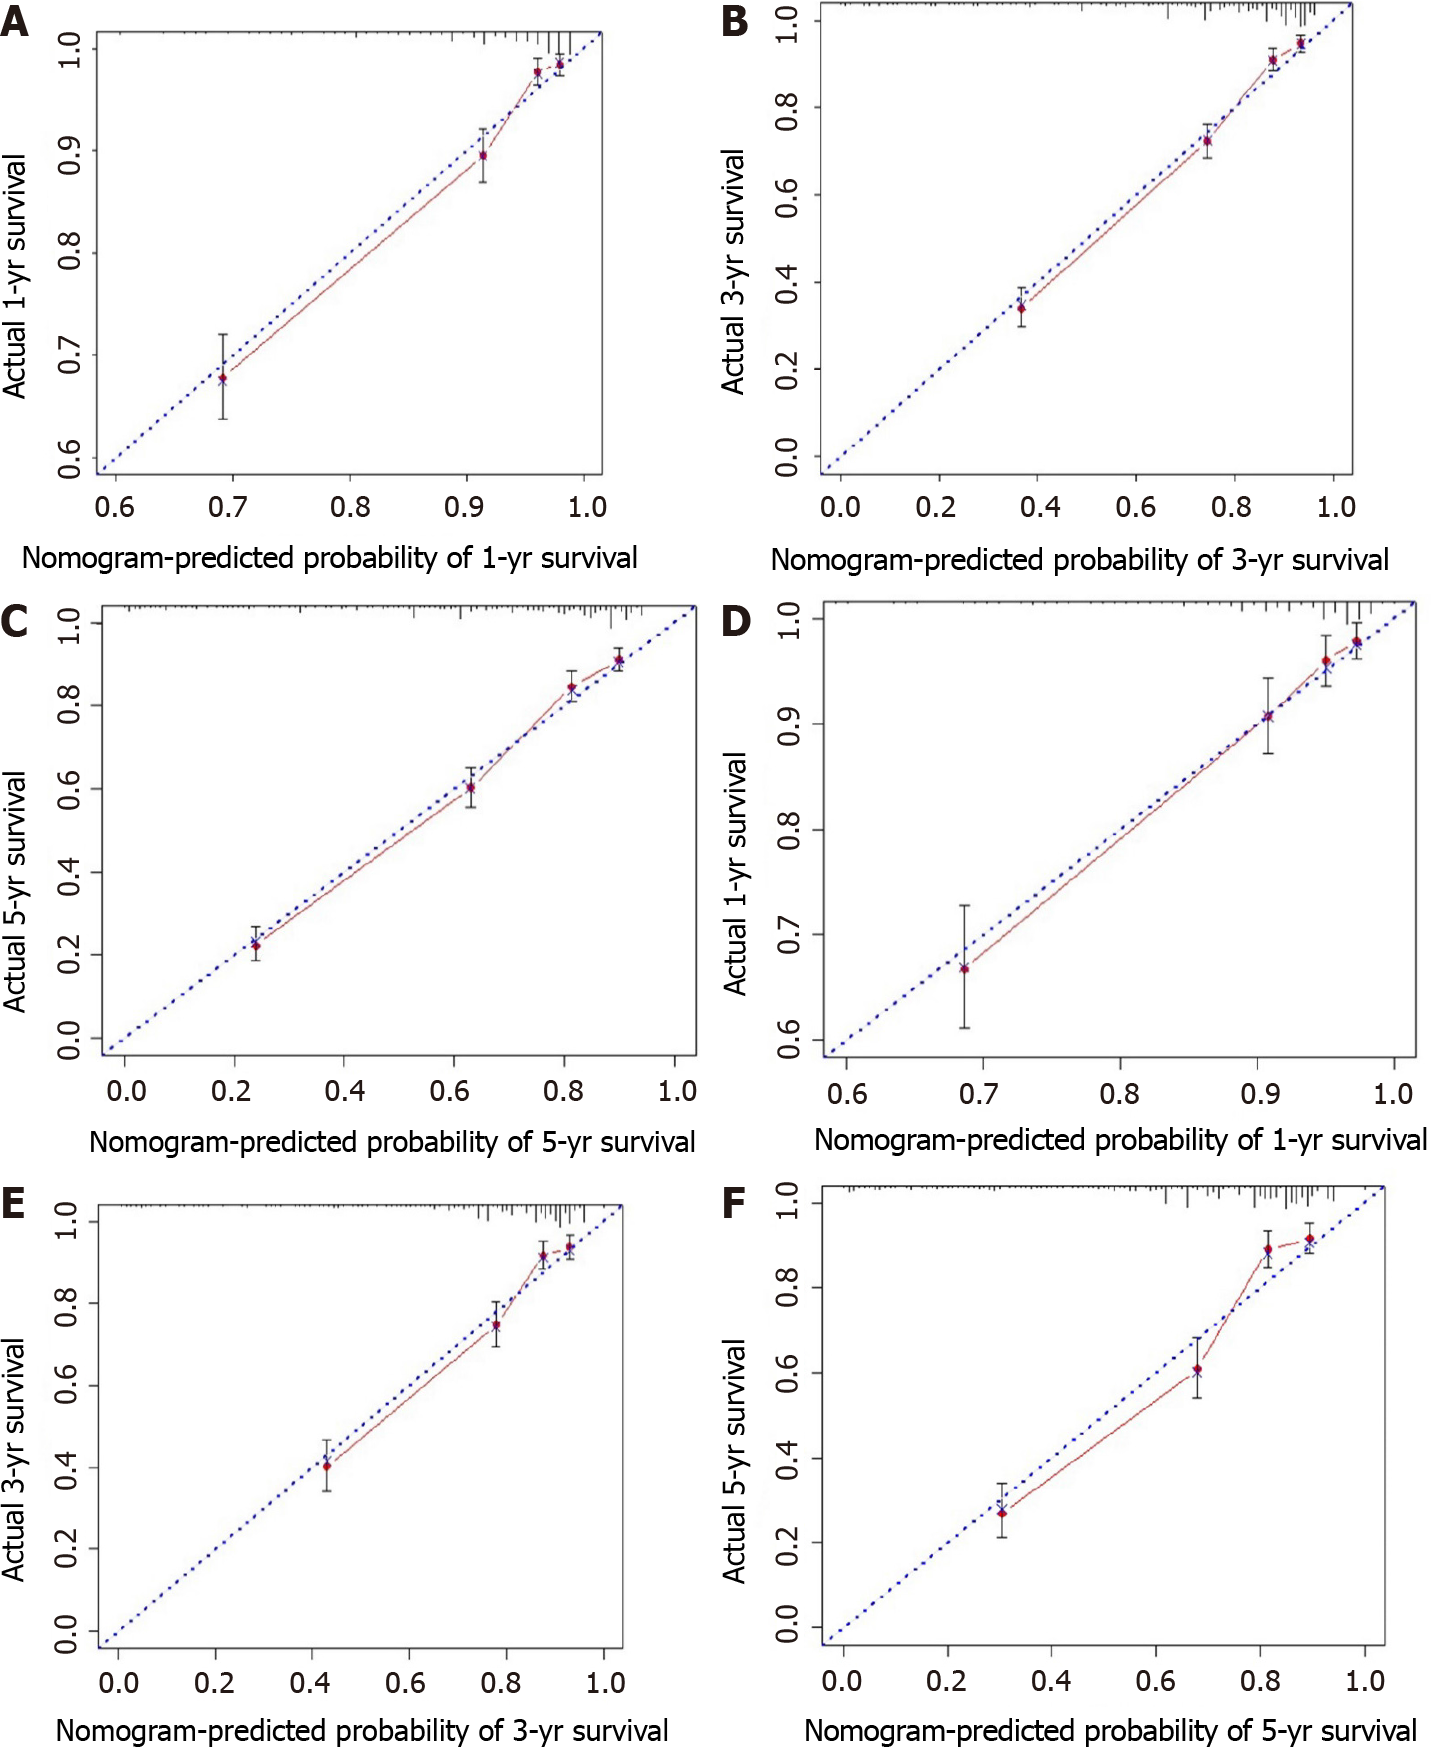
Figure 3 Calibration curves of the nomogram for predicting the overall survival.
A: At 1 year in the training set; B: At 3 years in the training set; C: At 5 years in the training set; D: At 1 year in the validation set; E: At 3 years in the validation set; F: At 5 years in the validation set.
- Citation: Li BW, Ma XY, Lai S, Sun X, Sun MJ, Chang B. Development and validation of a prognostic nomogram for colorectal cancer after surgery. World J Clin Cases 2021; 9(21): 5860-5872
- URL: https://www.wjgnet.com/2307-8960/full/v9/i21/5860.htm
- DOI: https://dx.doi.org/10.12998/wjcc.v9.i21.5860


