Copyright
©The Author(s) 2021.
World J Clin Cases. Jul 26, 2021; 9(21): 5830-5839
Published online Jul 26, 2021. doi: 10.12998/wjcc.v9.i21.5830
Published online Jul 26, 2021. doi: 10.12998/wjcc.v9.i21.5830
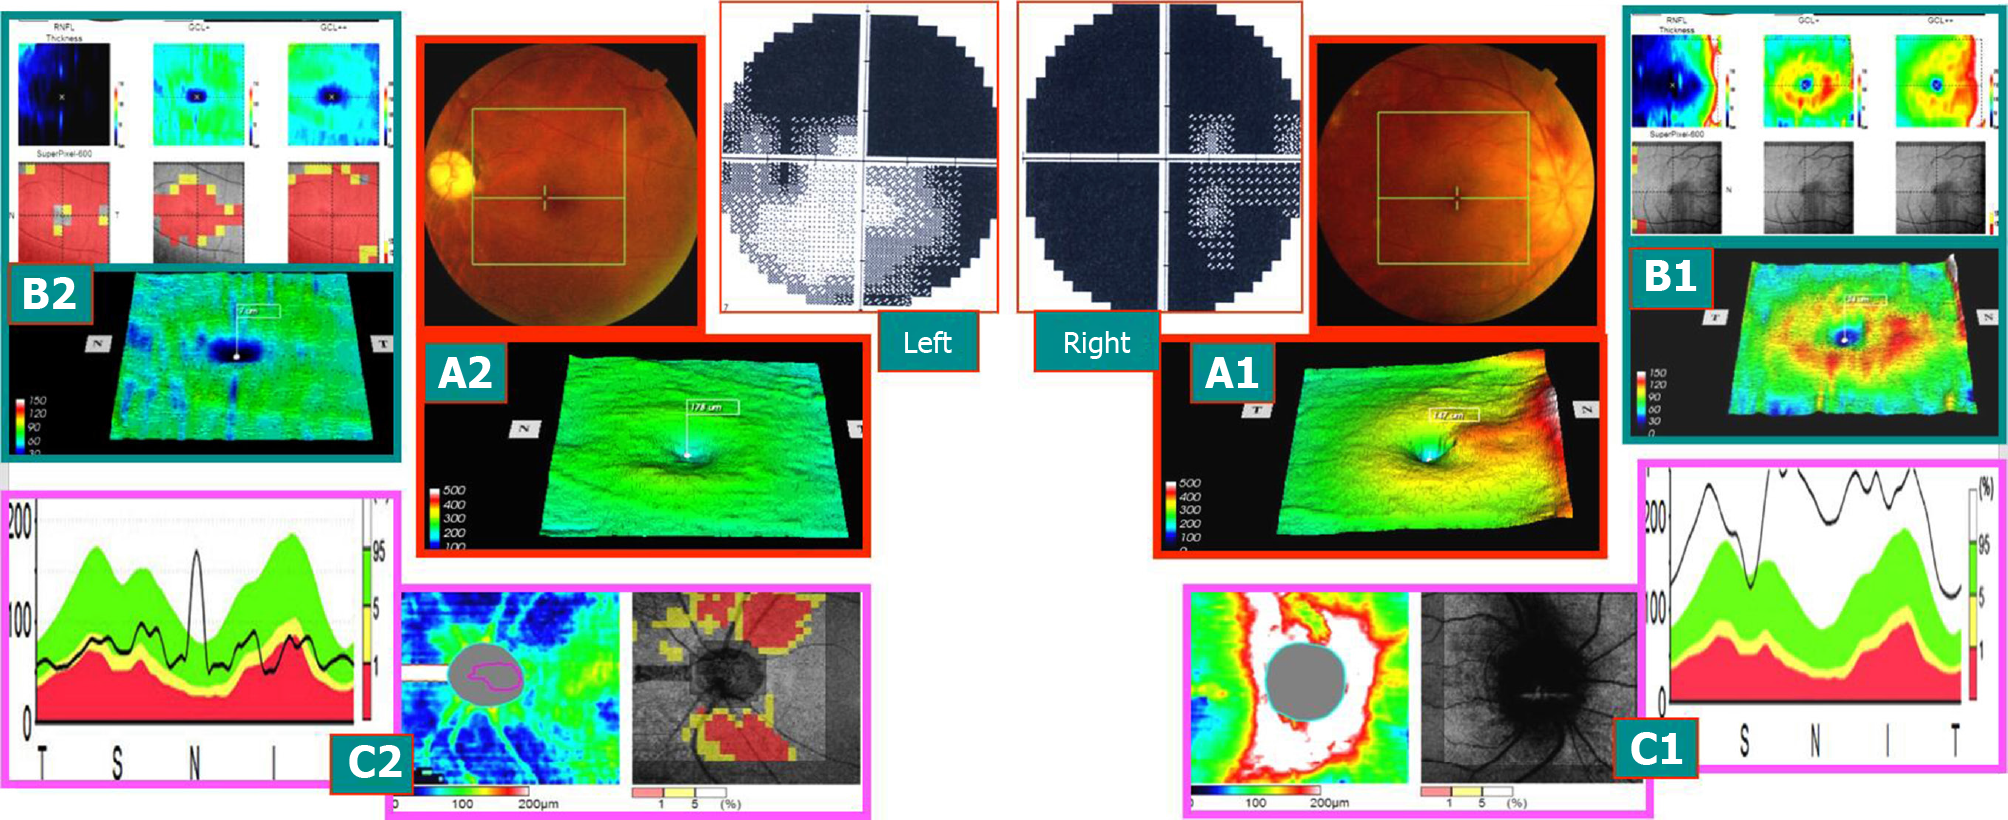
Figure 1 With visual acuity of 0.
1 and 0.5 on May 12, 2014 (typical case 1: early onset). Right eye: 1 wk after onset, subnormal eyes of early onset (within 3 wk of onset) and visual field defect of the acute stage. The left eye had attacks more than a year ago, and the disease is now stable (stable atrophy stage) and visual field defect of stable atrophy phase. A: The retinal thickness of the macular area in the eyes, and the right eye had color fundus. Edema of optic disc with hemorrhage, edema affected retinal thickening in the macular area, and an intense yellow ring was observed around the macula (A1). In the left eye, the color fundus phase had the light color of the optic disc, indicating the atrophy of the optic nerve (A2). The macular retinal thickness phase lost the yellow ring around the central fovea; B: Binocular macular ganglion cell complex (mGCC) thickness topographic map and meaningful lesion probability map and the right eye revealed the ring of mGCC, indicating red thickening and swelling period but slightly on the above part and retinal nerve fiber layer (right) of the lesion probability map. GCC (middle), GCC++ showed normal phenotype (B1). (B2) shows that peripheral mGCC ring shape of the macular center disappeared, which was in accordance with the findings in (A2). The probability figure of the lesion showed the central macular red atrophy thinning area, and retinal nerve fiber layer and ganglion cell layer++ (retinal nerve fiber layer + retinal ganglion cells + inner plexus layer) were almost all red thinning areas. Ganglion cell layer + (retinal ganglion cells + inner plexus layer) was only severely damaged in the central fovea of the macula; C: The thickness of the nerve fibers around the optic disc of the eyes and the probability of the lesion in the eyes. The right eye indicated that the optic disc had edema, and the peripheral nerve fibers were swollen and thicker than that of the normal high limit. The mGCC swelling of the fundus in this stage was thicker than that of the normal fundus, which could not be explained due to severe horizontal visual field defects in the upper and lower parts. This suggested that visual field changes occur before mGCC atrophy. The swollen mGCC was a mixture of functional and nonfunctional cells, and a small fraction of the visual field disappeared that could be restored with a healing process (C1). The left eye showed that the nerve fibers around the optic disc were shrunk and thinned, and the arch area of the superior and temporal vessels of the optic disc was severe, which was consistent with the changes in the horizontal defect of the upper and lower side of the left visual field (even less perfect at the lower level) (C2).
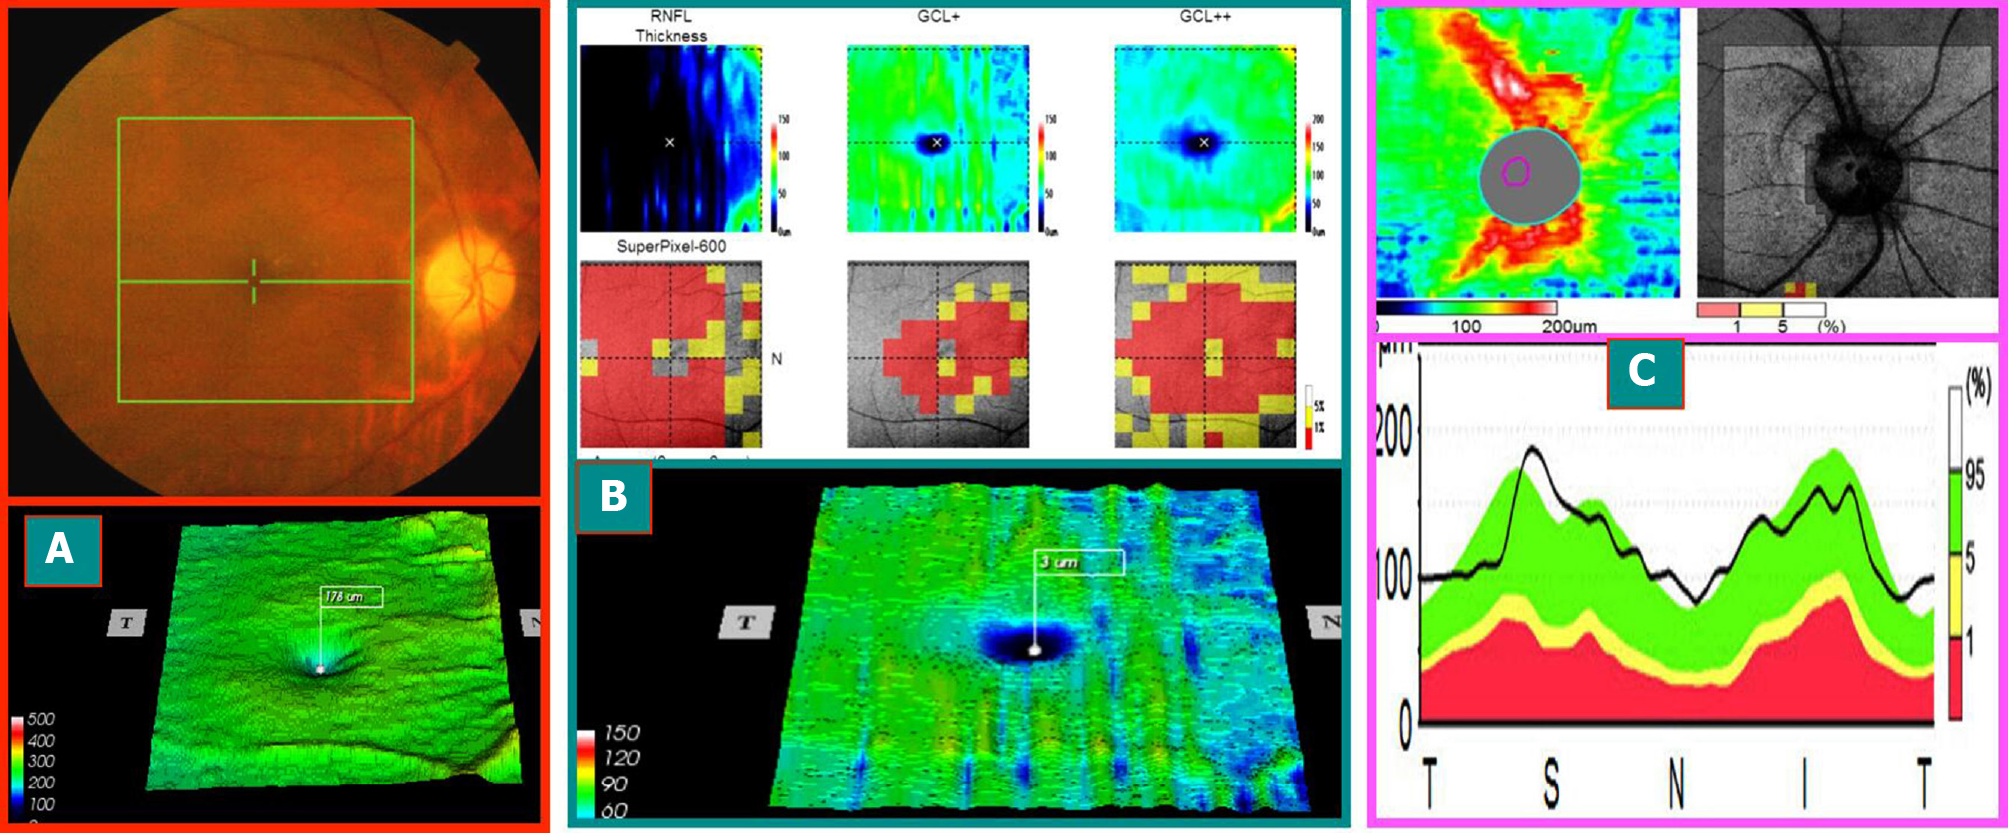
Figure 2 The mid-stage progression of the right eye and segregation phase (optical coherence tomography image at 1 mo after the onset of this case) (On June 9, 2014, typical case 1).
A: The optical disk was lighter, the boundary was distinct, and the circular area around the fovea of the macula had disappeared (obviously different from that of Figure 1A1); B: Macular ganglion cell complex ring disappeared, and three probabilistic maps (retinal nerve fiber layer, retinal ganglion cells + inner plexus layer, retinal nerve fiber layer + retinal ganglion cells + inner plexus layer) showed central red damage, which coincided with that of (A); C: The nerve fibers around the optic disc were swollen and thickened, and a few were beyond the normal high limit. The macular ganglion cell complex shrank and thinned. However, the nerve fibers around the optic disc were still swollen (swelling of the axons of the superficial ganglion cells), which occurred only 3 wk after onset and is known as the stage of progression-separation phenomenon in the middle stage of the onset. Moreover, the patient’s vision and visual field improved with treatment during this period.
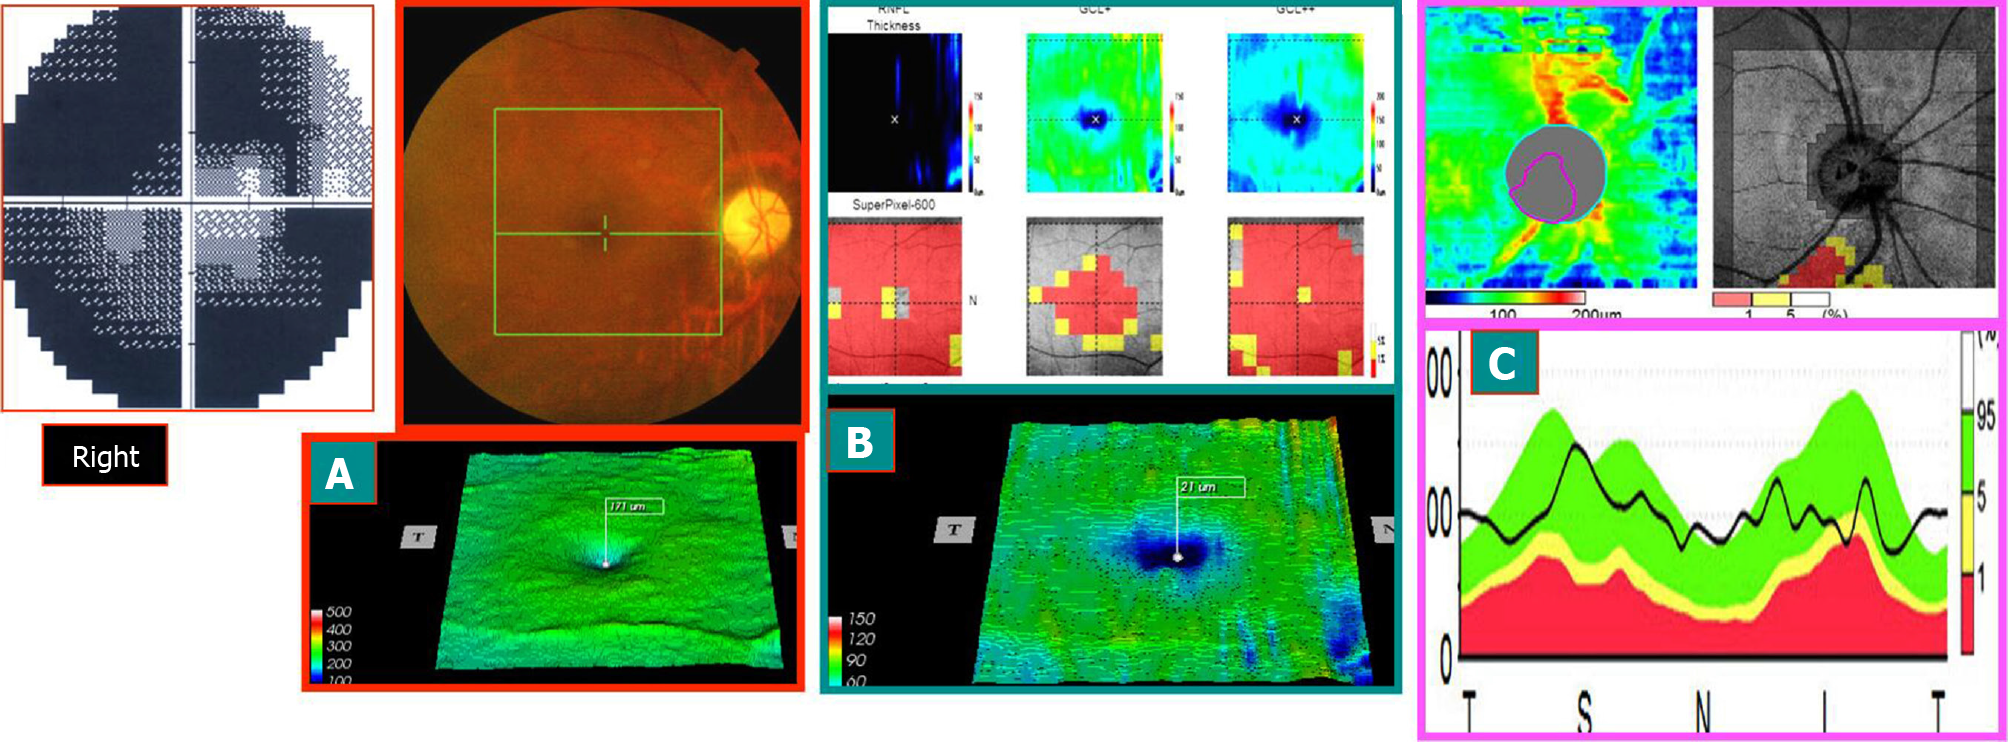
Figure 3 August 11, 2014, the stable atrophy of right eye in the late stage of onset (3 mo after onset): visual acuity was 0.
5 (typical case 1). A and B: Compared to Figure 2A and 2B, more shrinking and thinning were observed; C: Compared to Figure 2C, the nerve fibers around the optic disc were shrunk and thinned, especially in the lower part. This was consistent with the visual field showing that the horizontal defect above was more severe than the horizontal defect at the bottom. Right eye visual field: compared to that of the early stage of onset, the central area expanded. Hence, the visual acuity increased. The visual field of the left eye did not change before and after treatment.
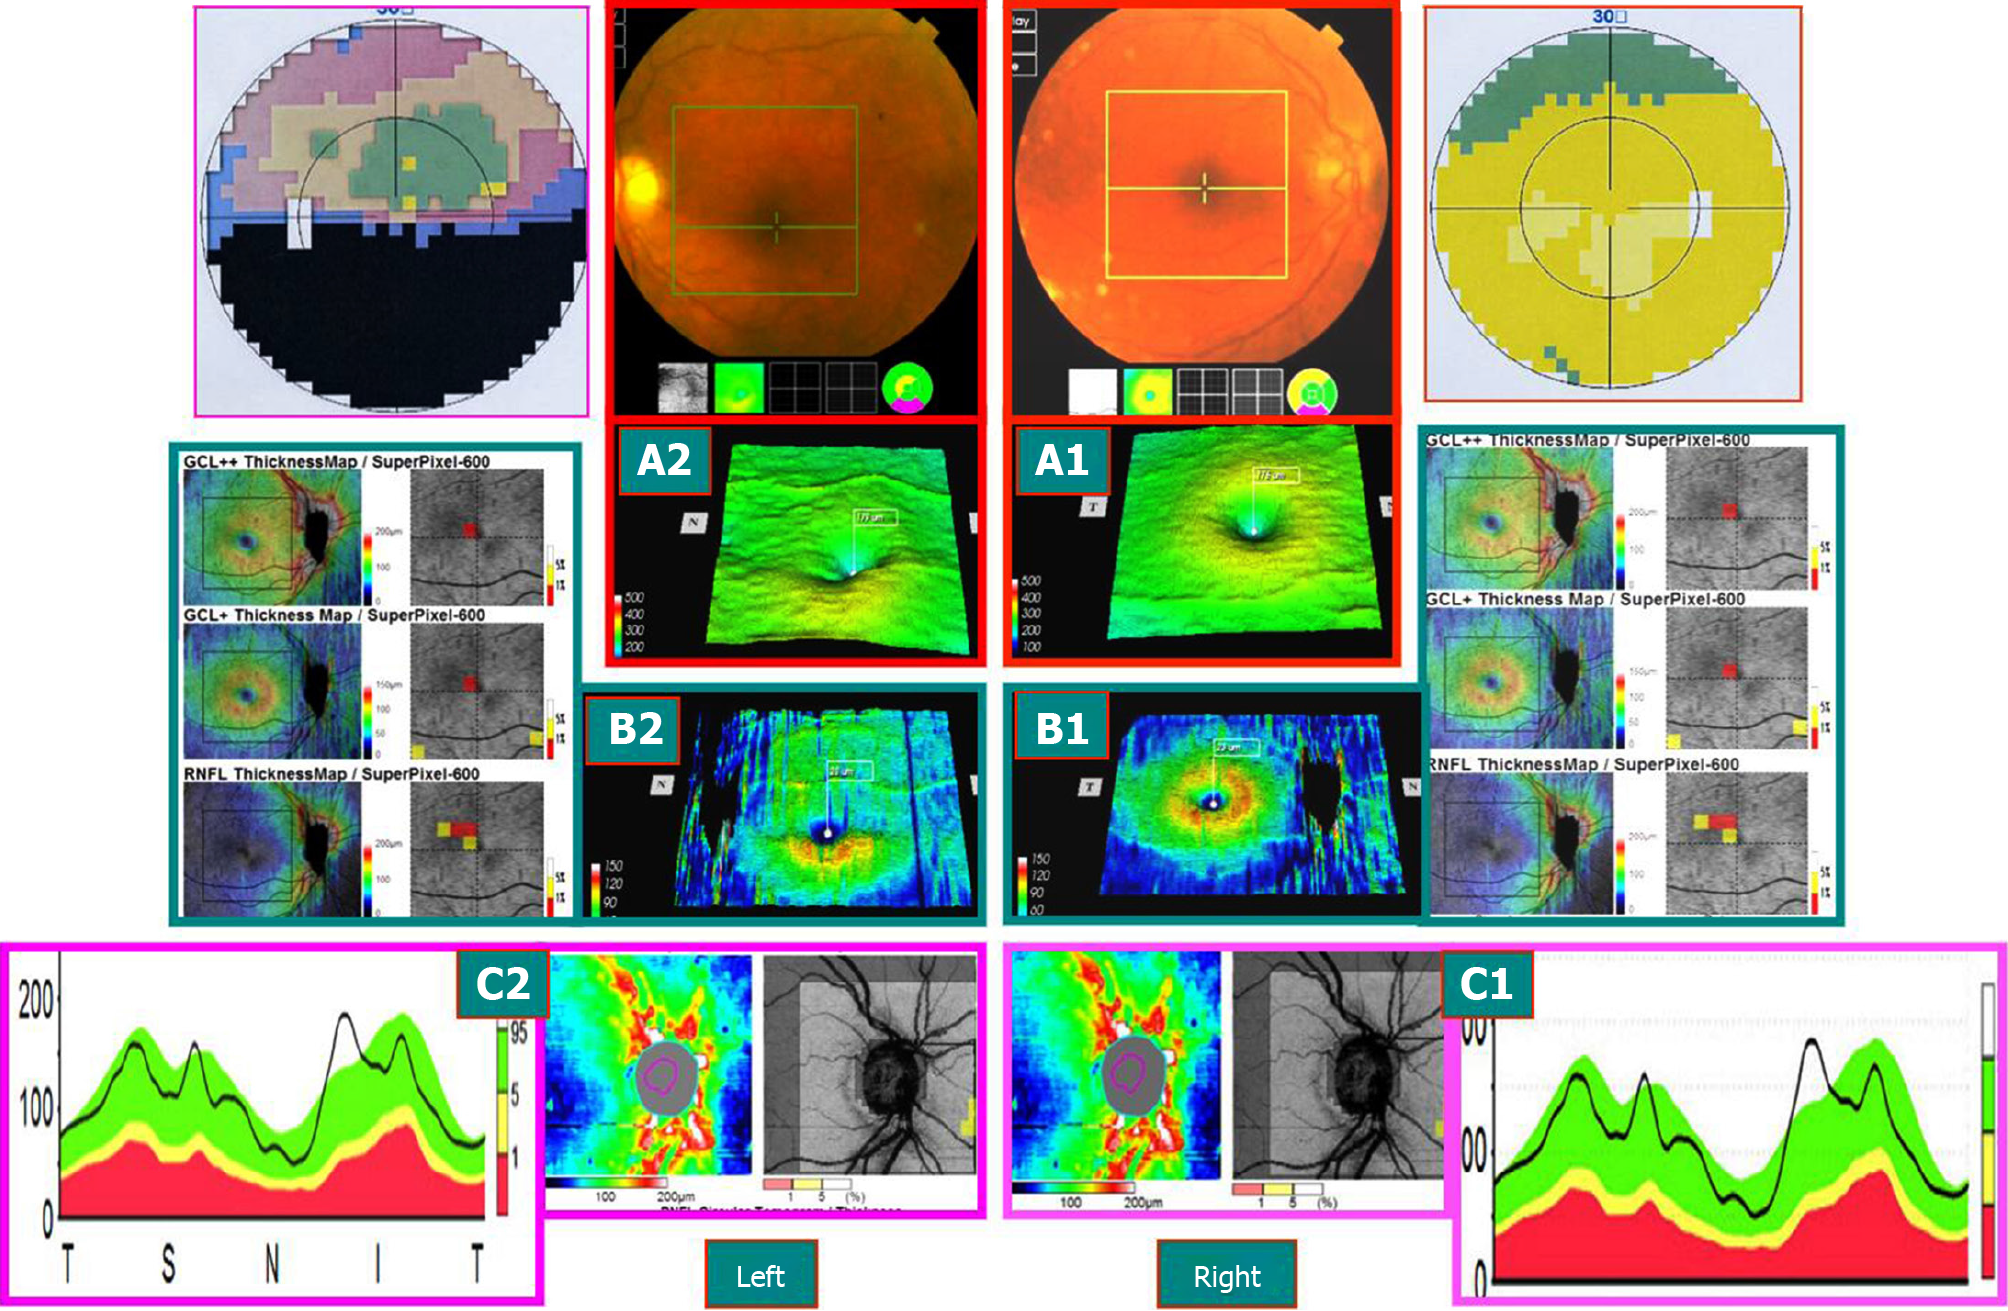
Figure 4 Sjögren’s syndrome patient on September 3, 2014 (typical case 2).
Hormones and immunosuppressants were administered to control the stability of the condition, and both eyes were subnormal by 3D-optical coherence tomography examination on December 31, 2013. A-C: Preclinical or latent subnormal eye of the right eye. The mGCC (A1 and B1) and the thickness of the nerve fibers around the optic disc (C1) were swollen and thickened, and no clinical symptoms were found. Late atrophy of the left eye AION disease (2 mo after onset): The mGCC delineated by horizontal sutures above the macular area were shrunk (A2 and B2), and optic disc showed a superior temporal nerve fiber atrophy (C2), which was consistent with that of the horizontal defect below the visual field. However, the mGCC under the macula of the left eye and thickness of the nerve fibers beneath the optic disc were still swollen and thickened (A2-C2). However, some nerve tract defects were noted above the field of vision, suggesting that the time may not be stable and might alter with the treatment.
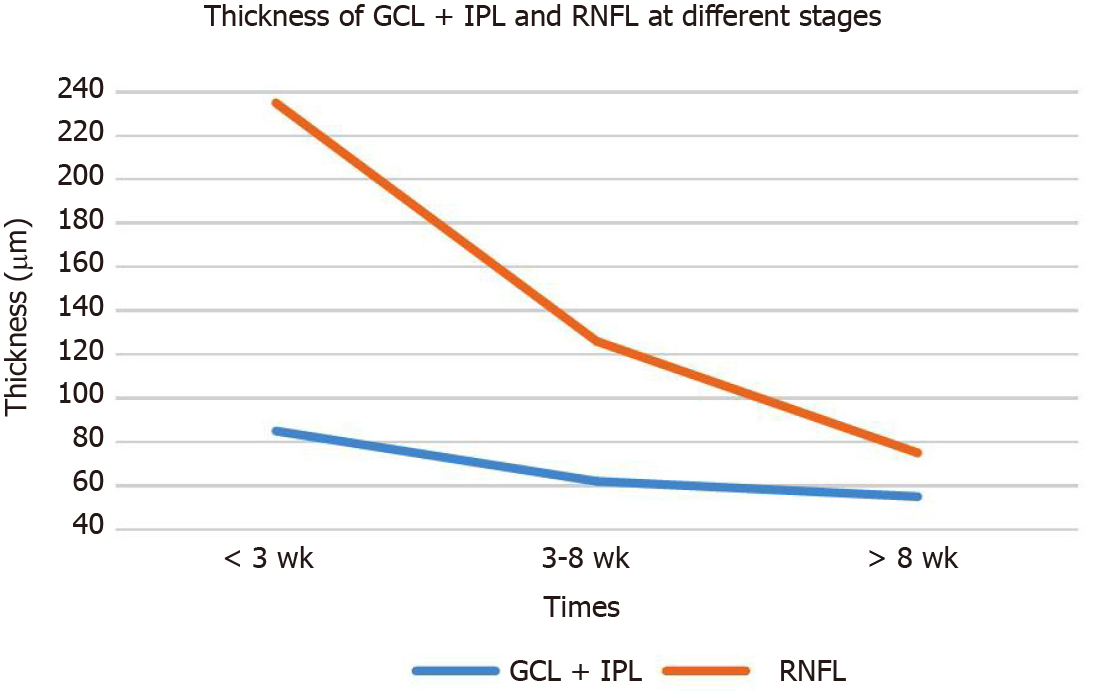
Figure 5 Thickness of ganglion cell layer + inner plexus layer and retinal nerve fiber layer at different stages.
GCL: Ganglion cell layer; IPL: Inner plexus layer; RNFL: Retinal nerve fiber layer.
- Citation: Zhang W, Sun XQ, Peng XY. Macular ganglion cell complex injury in different stages of anterior ischemic optic neuropathy. World J Clin Cases 2021; 9(21): 5830-5839
- URL: https://www.wjgnet.com/2307-8960/full/v9/i21/5830.htm
- DOI: https://dx.doi.org/10.12998/wjcc.v9.i21.5830


