Copyright
©The Author(s) 2021.
World J Clin Cases. Jul 16, 2021; 9(20): 5724-5729
Published online Jul 16, 2021. doi: 10.12998/wjcc.v9.i20.5724
Published online Jul 16, 2021. doi: 10.12998/wjcc.v9.i20.5724
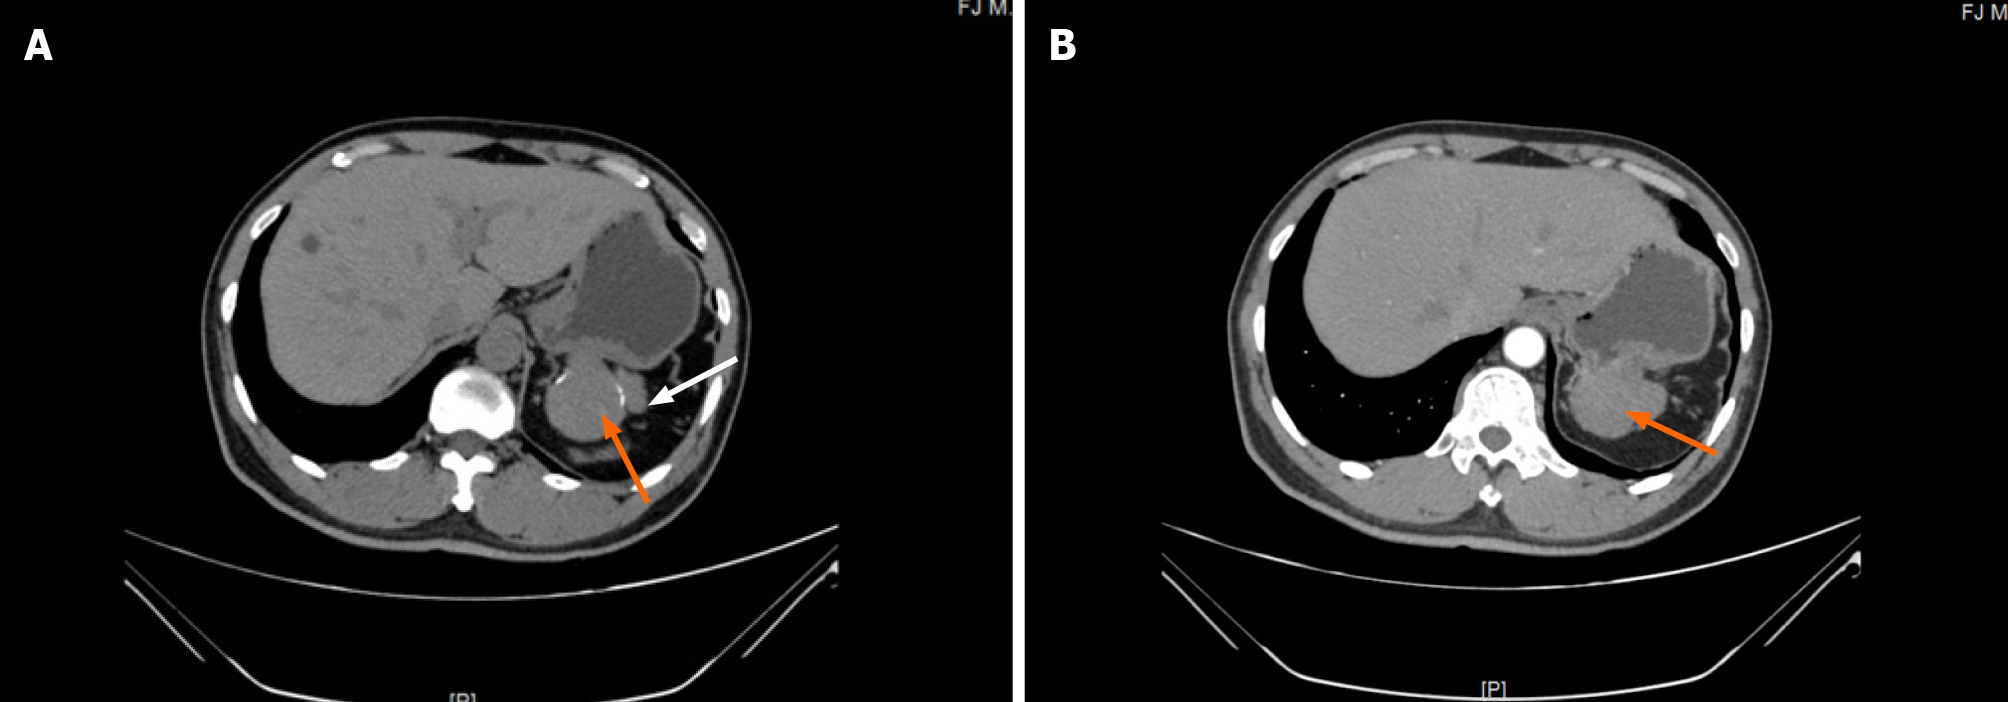
Figure 1 Preoperative abdominal computed tomography scan of the stomach mass.
A: Computed tomography (CT) plain scan revealed an approximately 5.64 cm × 4.00 cm irregular soft tissue density (orange arrow) that was not clearly defined from the stomach and pancreas (white arrow). B: Contrast-enhanced CT (arterial phase) revealed that there was slight inhomogeneous enhancement (orange arrow).
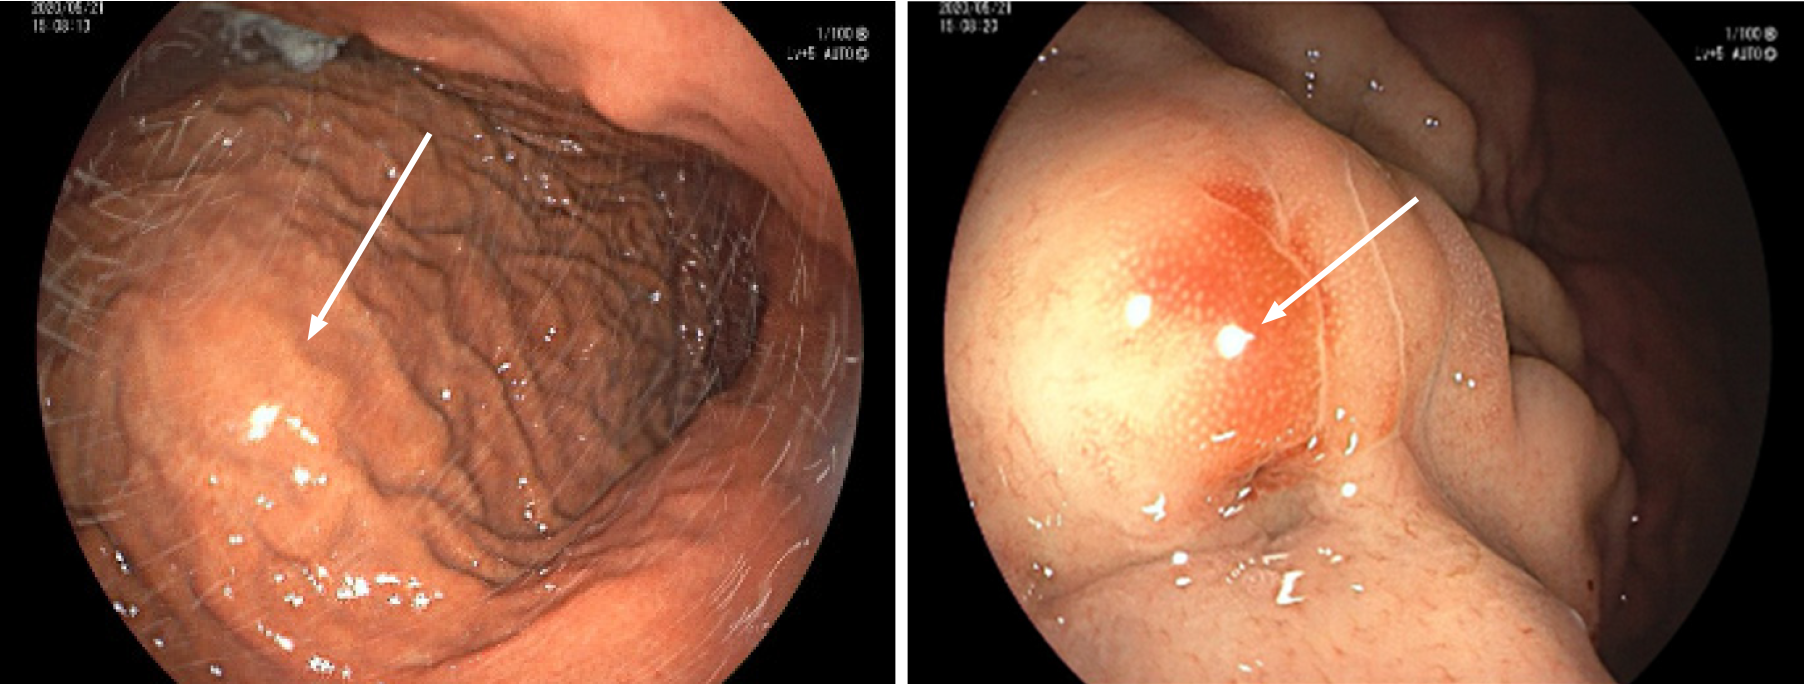
Figure 2 Gastroscopic images.
Gastroscopy showed an approximately 3.0 cm × 3.0 cm mucosal eminence at the posterior wall of the upper segment of the gastric (white arrow).
Figure 3 Photos of splenosis.
A: Intraoperative image. A mass of about 5.0 cm × 3.0 cm was observed between the left upper stomach and the pancreas (white arrow); B: Postoperative specimen.
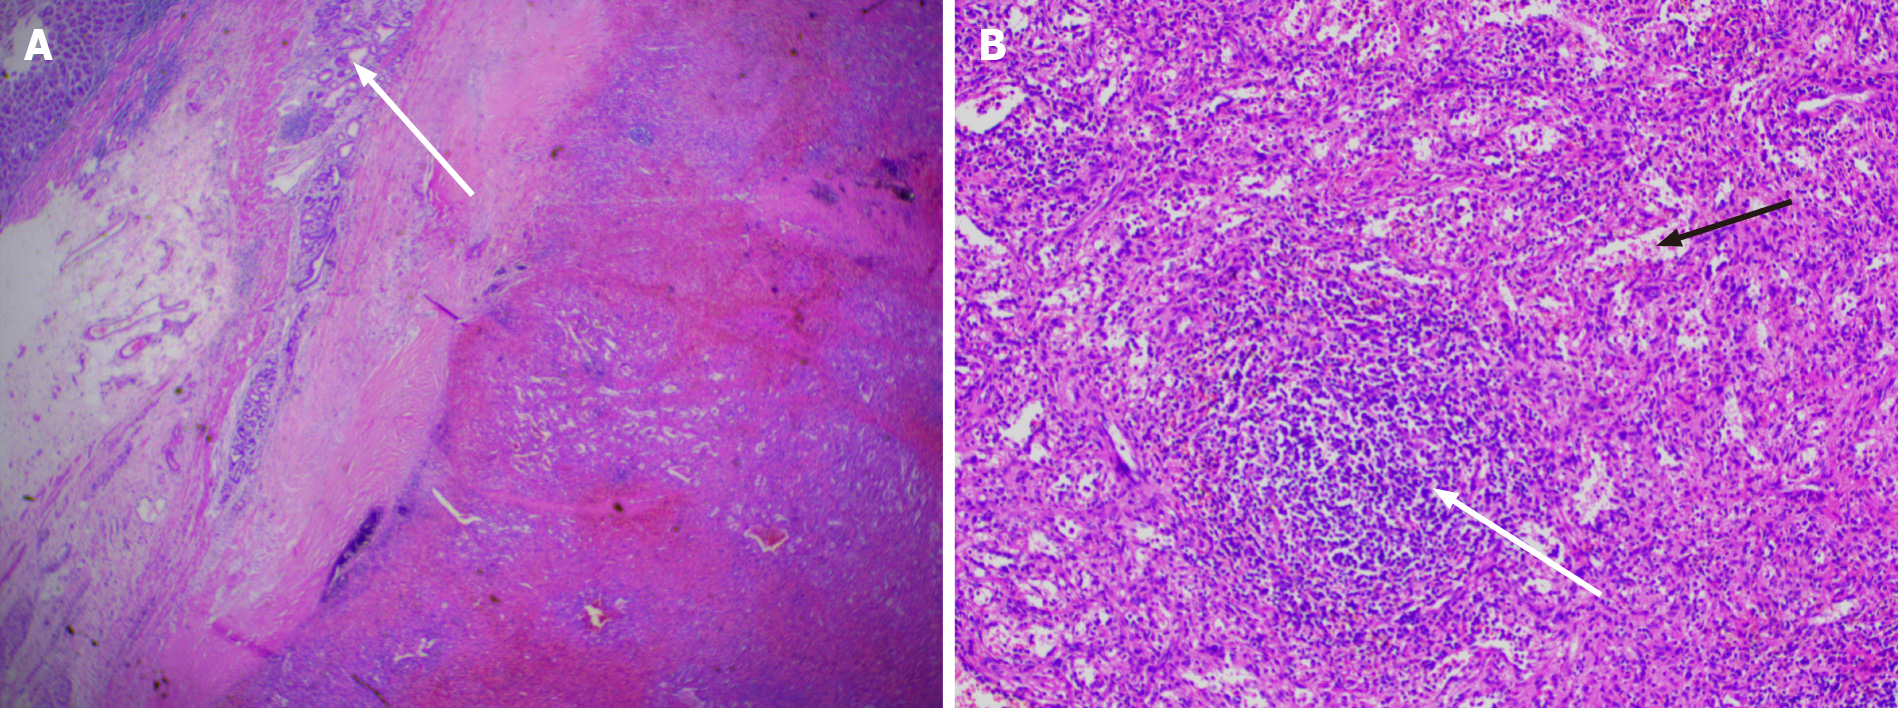
Figure 4 Photomicrographs (hematoxylin and eosin staining).
A: Gastric mucosal epithelium (white arrow) can be seen around the spleen tissue (magnification, × 20); B: Splenic sinus (black arrow), splenic cord, and splenic corpuscle (white arrow) are clearly visible (magnification, × 100).
- Citation: Zheng HD, Xu JH, Sun YF. Splenosis masquerading as gastric stromal tumor: A case report. World J Clin Cases 2021; 9(20): 5724-5729
- URL: https://www.wjgnet.com/2307-8960/full/v9/i20/5724.htm
- DOI: https://dx.doi.org/10.12998/wjcc.v9.i20.5724


