Copyright
©The Author(s) 2021.
World J Clin Cases. Jun 26, 2021; 9(18): 4823-4828
Published online Jun 26, 2021. doi: 10.12998/wjcc.v9.i18.4823
Published online Jun 26, 2021. doi: 10.12998/wjcc.v9.i18.4823
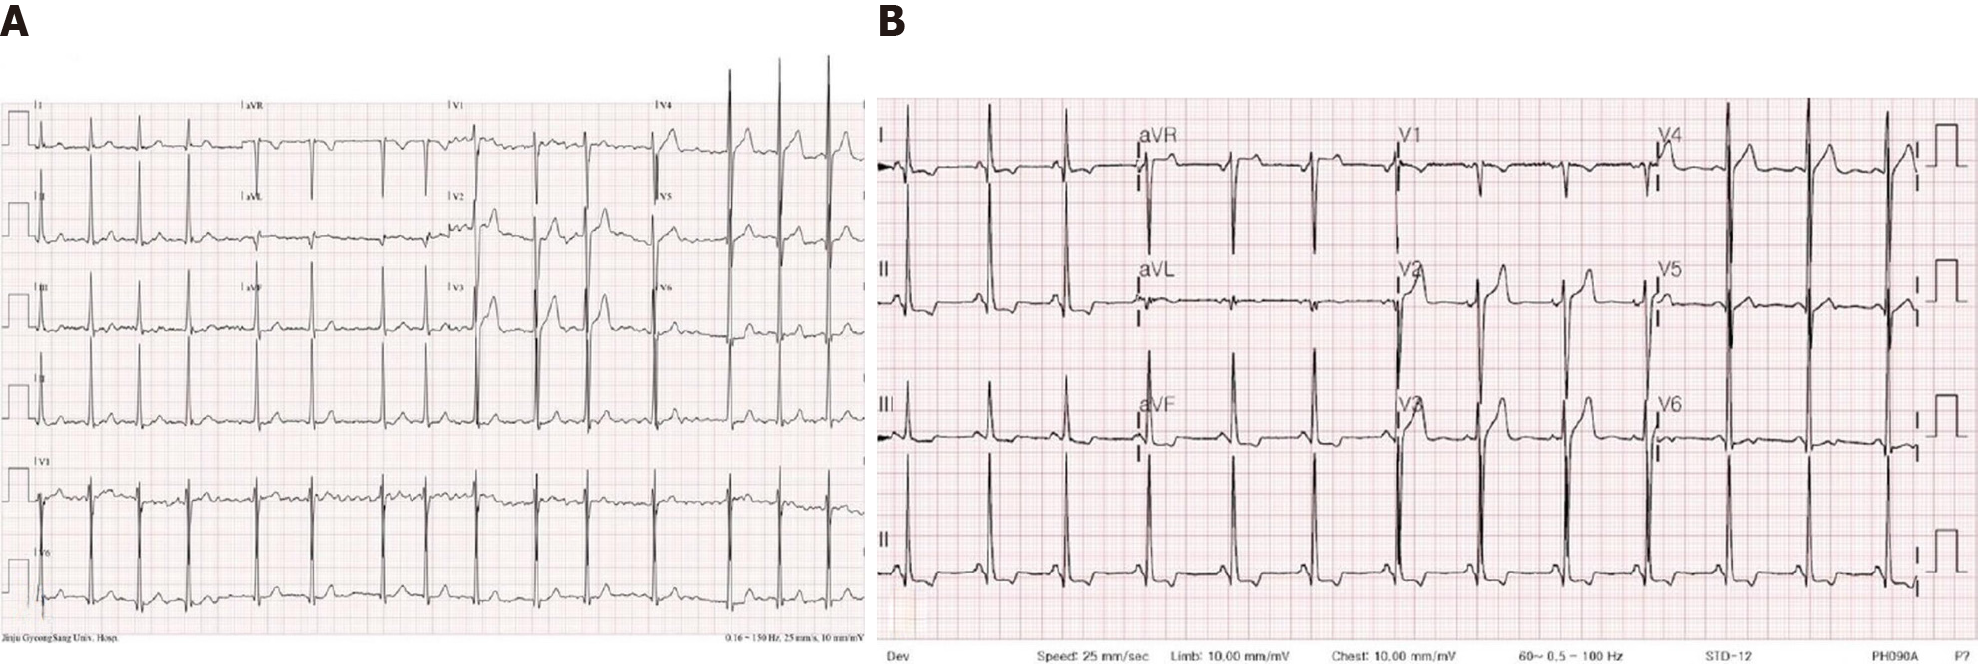
Figure 1 The patient’s electrocardiogram before and after rhythm conversion.
A: The electrocardiogram (ECG) shows atrial fibrillation with left ventricular hypertrophy upon admission; B: After spontaneous rhythm conversion to normal sinus rhythm, the surface ECG reveals a short PR interval (120 ms) and an unmeasurable Pend-Q interval.
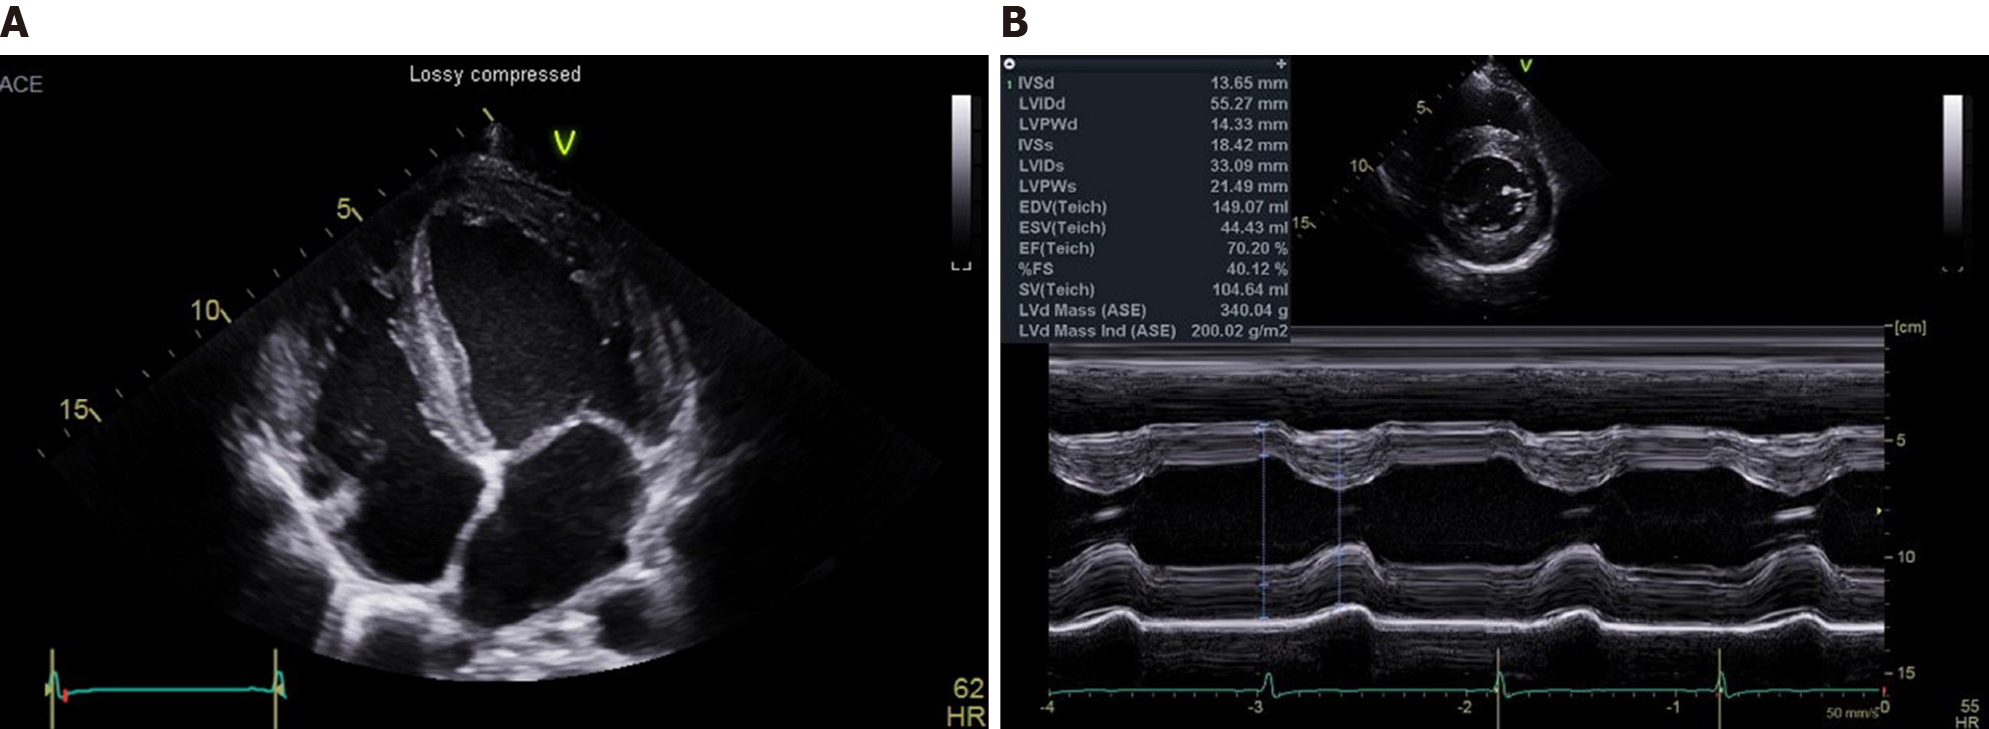
Figure 2 Echocardiographic images in the patient with Fabry disease.
A: The apical 4-chambers view reveals brighten endocardium, slightly thickened mitral valves, and thickened left atrial wall; B: M-mode shows thickened left ventricular walls (up to 14 mm).
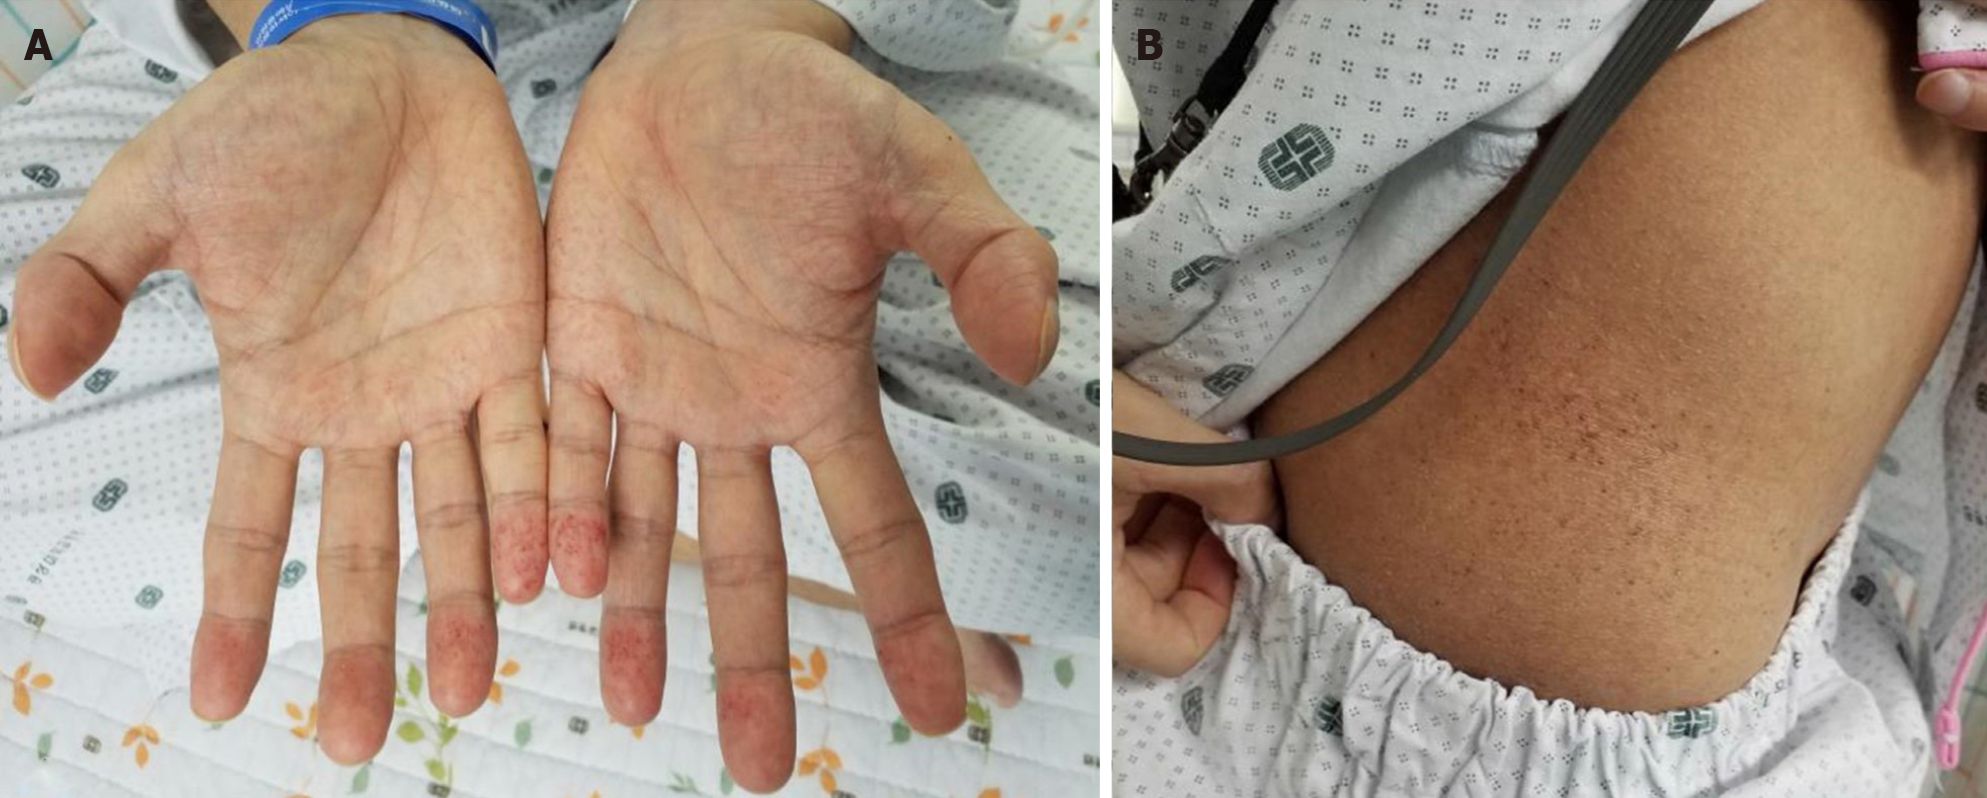
Figure 3 Cutaneous manifestations in the patient.
Angiokeratomas (small, numerous, and dark red/purple spots) on both hands and flank are observed. A: Hands; B: Flank.
- Citation: Kim H, Kang MG, Park HW, Park JR, Hwang JY, Kim K. Anderson-Fabry disease presenting with atrial fibrillation as earlier sign in a young patient: A case report. World J Clin Cases 2021; 9(18): 4823-4828
- URL: https://www.wjgnet.com/2307-8960/full/v9/i18/4823.htm
- DOI: https://dx.doi.org/10.12998/wjcc.v9.i18.4823


