Copyright
©The Author(s) 2021.
World J Clin Cases. Jun 26, 2021; 9(18): 4654-4667
Published online Jun 26, 2021. doi: 10.12998/wjcc.v9.i18.4654
Published online Jun 26, 2021. doi: 10.12998/wjcc.v9.i18.4654
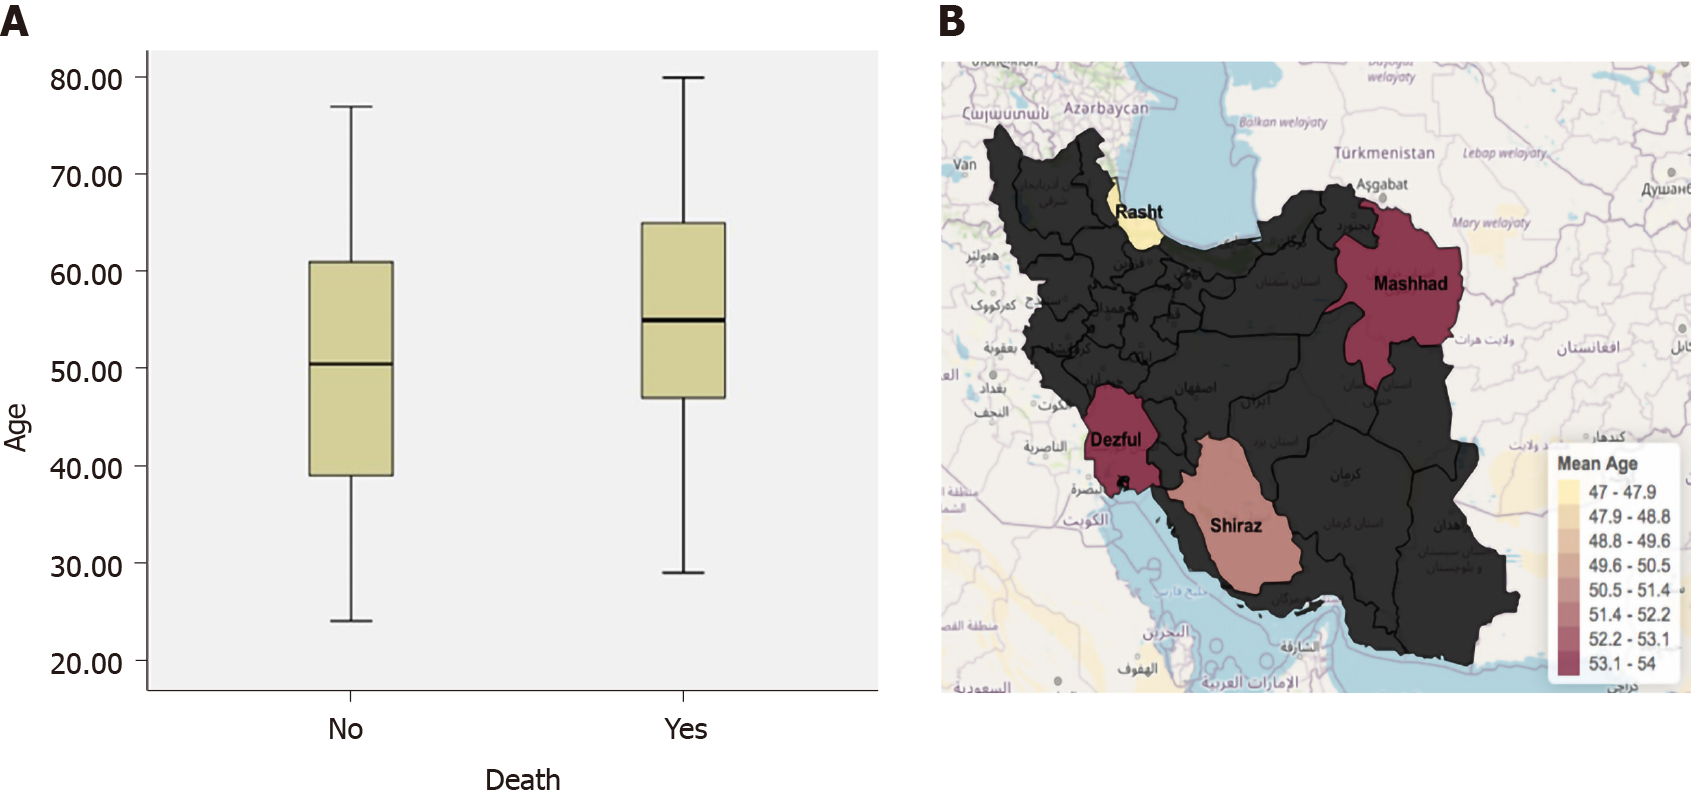
Figure 1 There were age differences in this cohort of coronavirus disease 2019 patients in 4 different cities.
A: Association between age and mortality; B: Heat map with comparison of mean average age in selected studies from different cities (Northwest has the highest age).
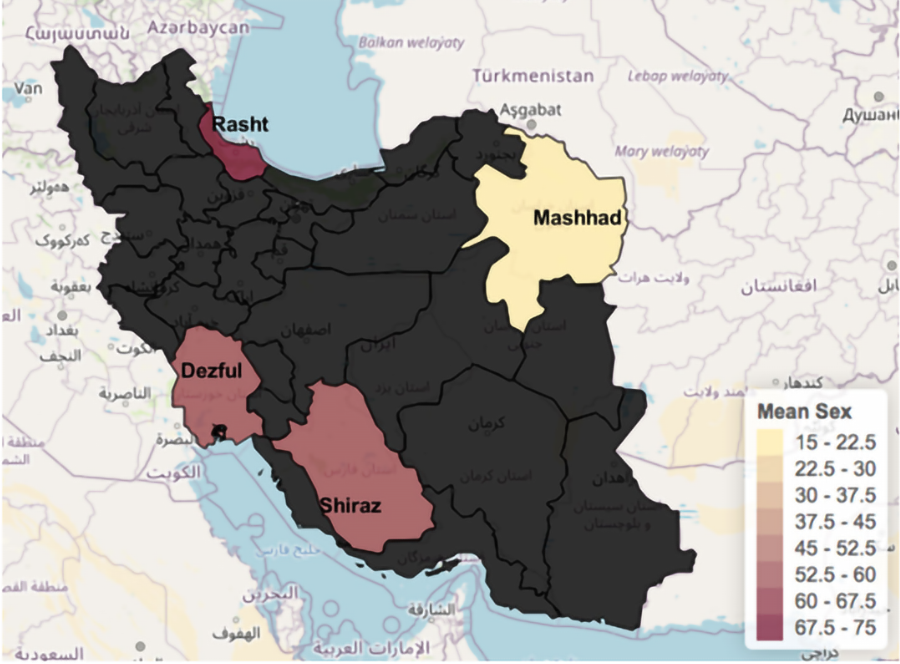
Figure 2 Heat map with comparison of sex distribution of patients selected from different cities.
The younger patients were in northeast.
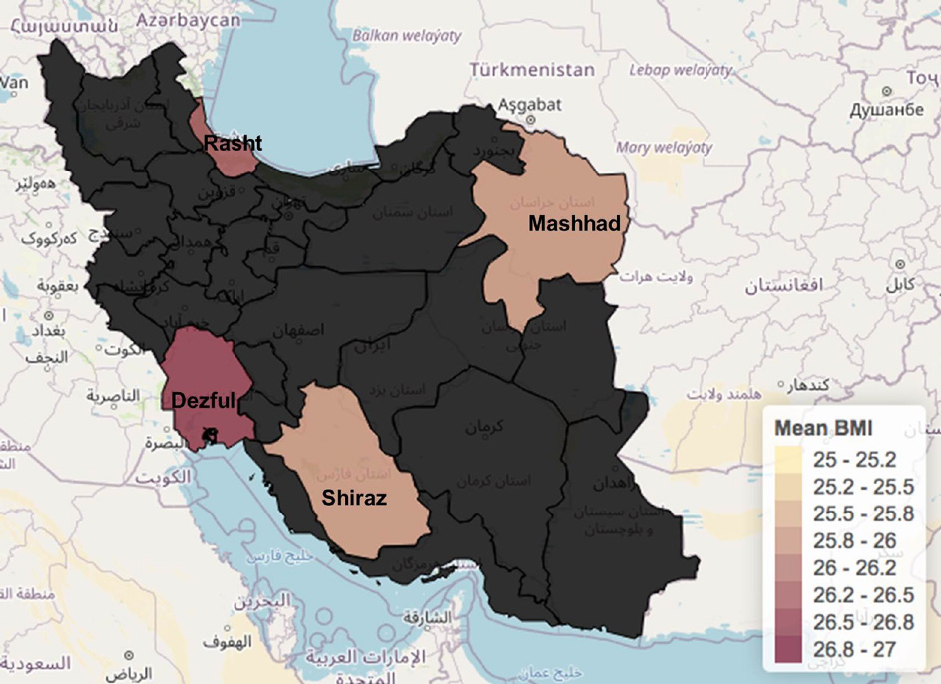
Figure 3 Heat map with comparison of mean body mass index in selected studies from different cities.
North (Rashat) had the highest overweight.
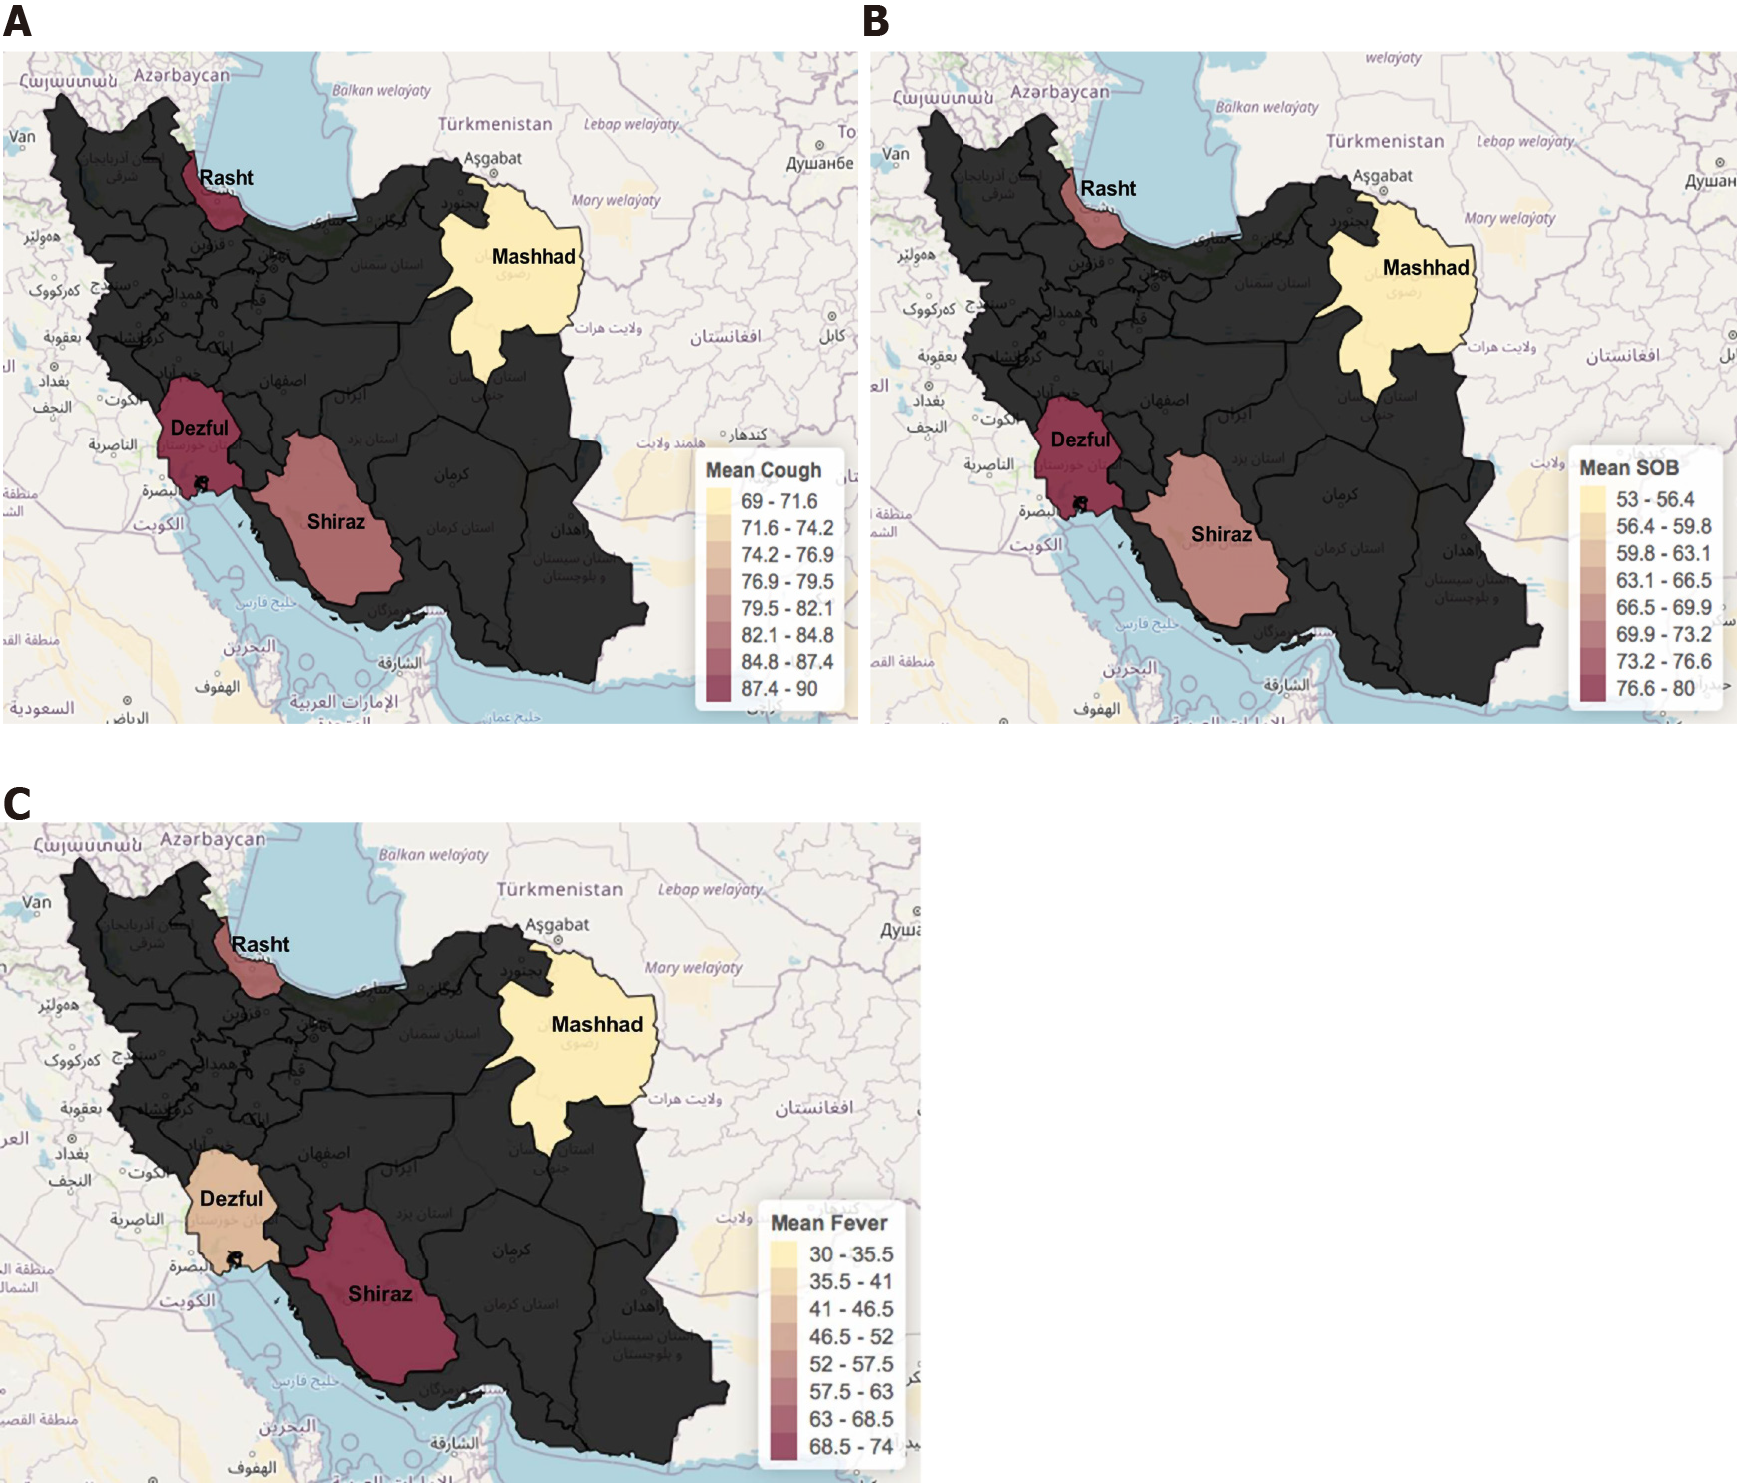
Figure 4 Comparison of (%) mean cough, shortness of breath, and fever symptom in selected studies from different cities.
Northeast had lower number of these symptoms. A: Cough; B: Shortness of breath; C: Fever symptom.
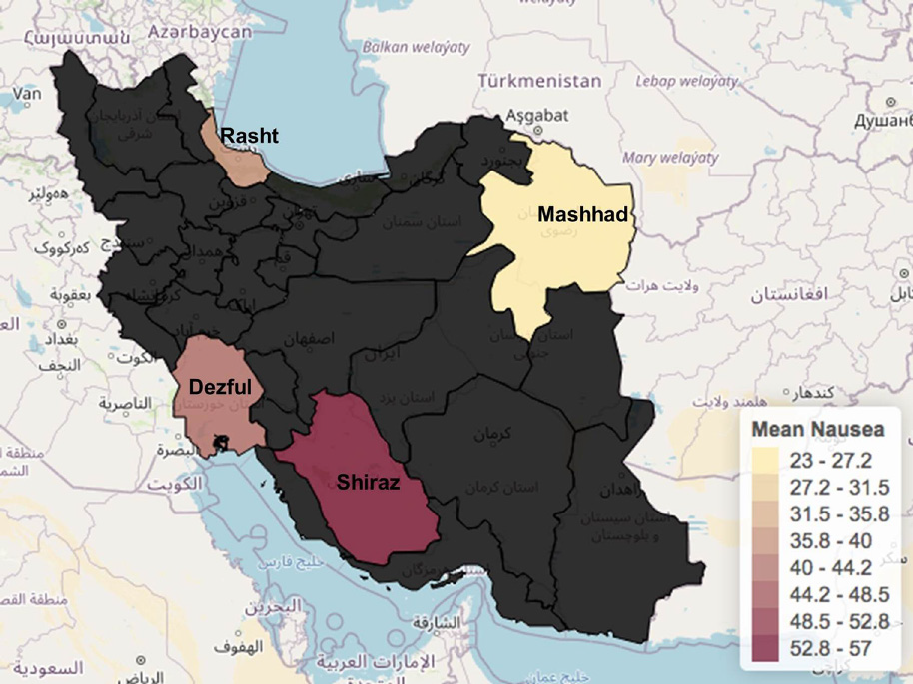
Figure 5 Comparison of mean nausea prevalence in patients from different cities.
Northeast had lower number of these symptoms.
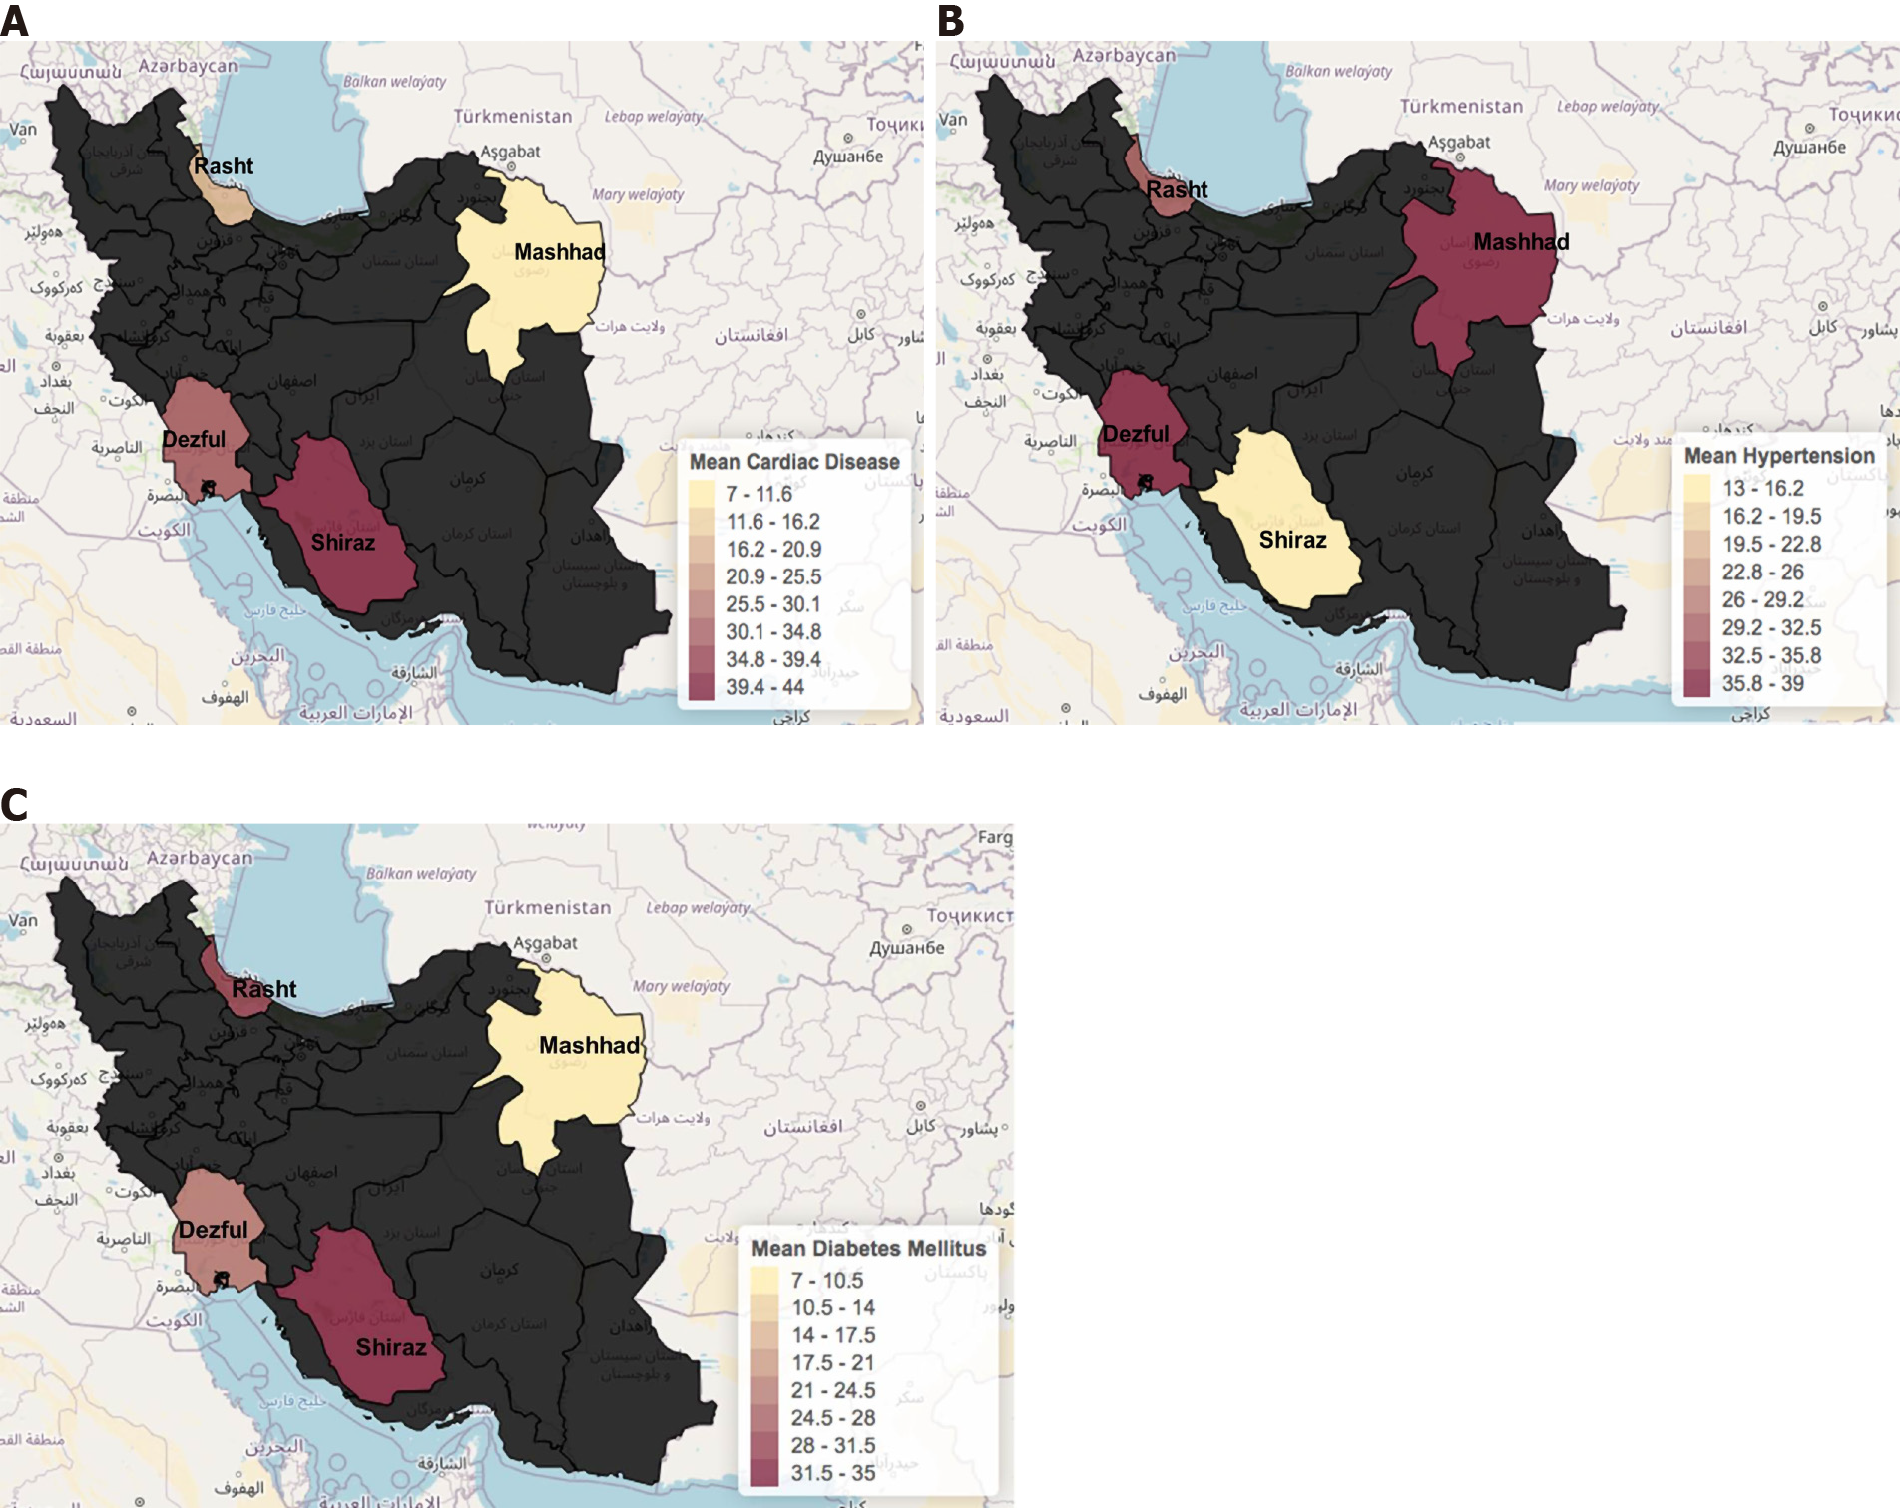
Figure 6 Comparison of (%) mean cardiac disease, hypertension, and diabetes in patients from Iran.
A: Cardiac disease; B: Hypertension; C: Diabetes.
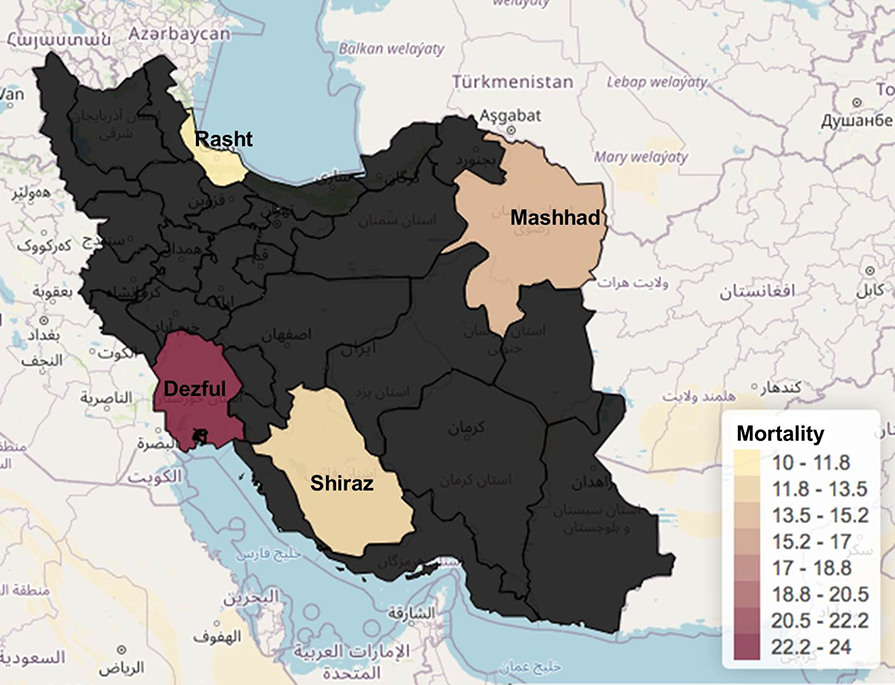
Figure 7 Heat map with comparison of mean mortality rate in selected studies from different cities.
North (Rasht) reported the lowest death rate with 10%.
- Citation: Mokarram P, Dalivand MM, Pizuorno A, Aligolighasemabadi F, Sadeghdoust M, Sadeghdoust E, Aduli F, Oskrochi G, Brim H, Ashktorab H. Clinical characteristics, gastrointestinal manifestations and outcomes of COVID-19 patients in Iran; does the location matters? World J Clin Cases 2021; 9(18): 4654-4667
- URL: https://www.wjgnet.com/2307-8960/full/v9/i18/4654.htm
- DOI: https://dx.doi.org/10.12998/wjcc.v9.i18.4654


