Copyright
©The Author(s) 2021.
World J Clin Cases. May 26, 2021; 9(15): 3607-3622
Published online May 26, 2021. doi: 10.12998/wjcc.v9.i15.3607
Published online May 26, 2021. doi: 10.12998/wjcc.v9.i15.3607
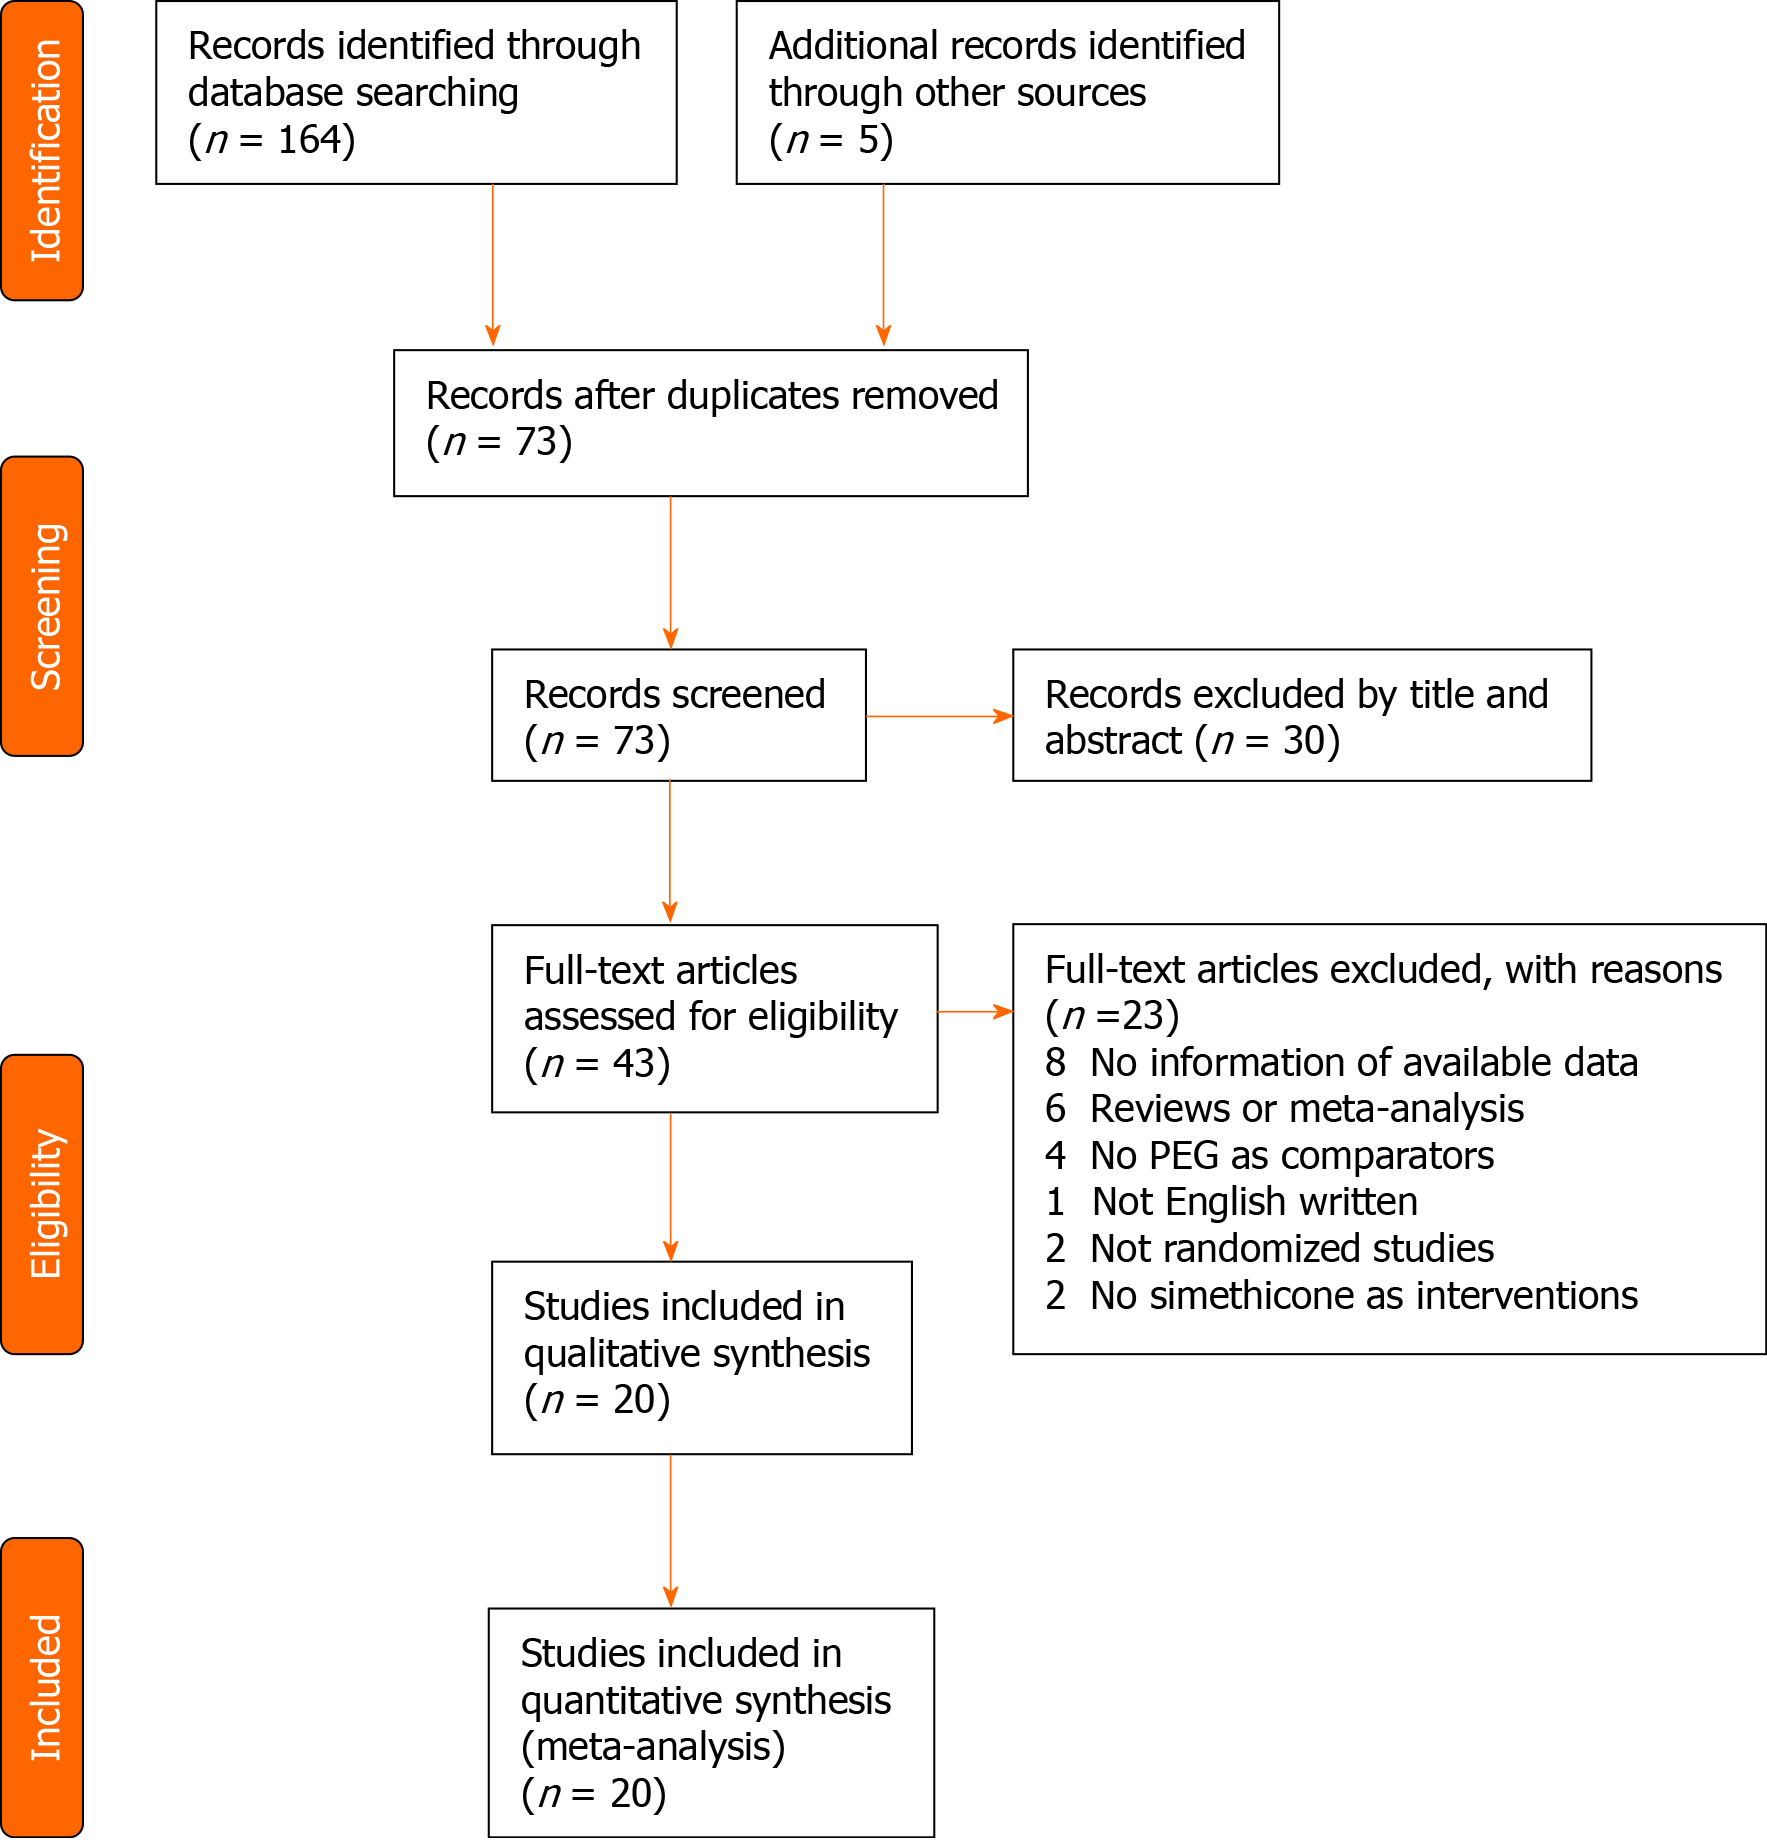
Figure 1 Flowchart of the study selection.
PEG: Polyethylene glycol.
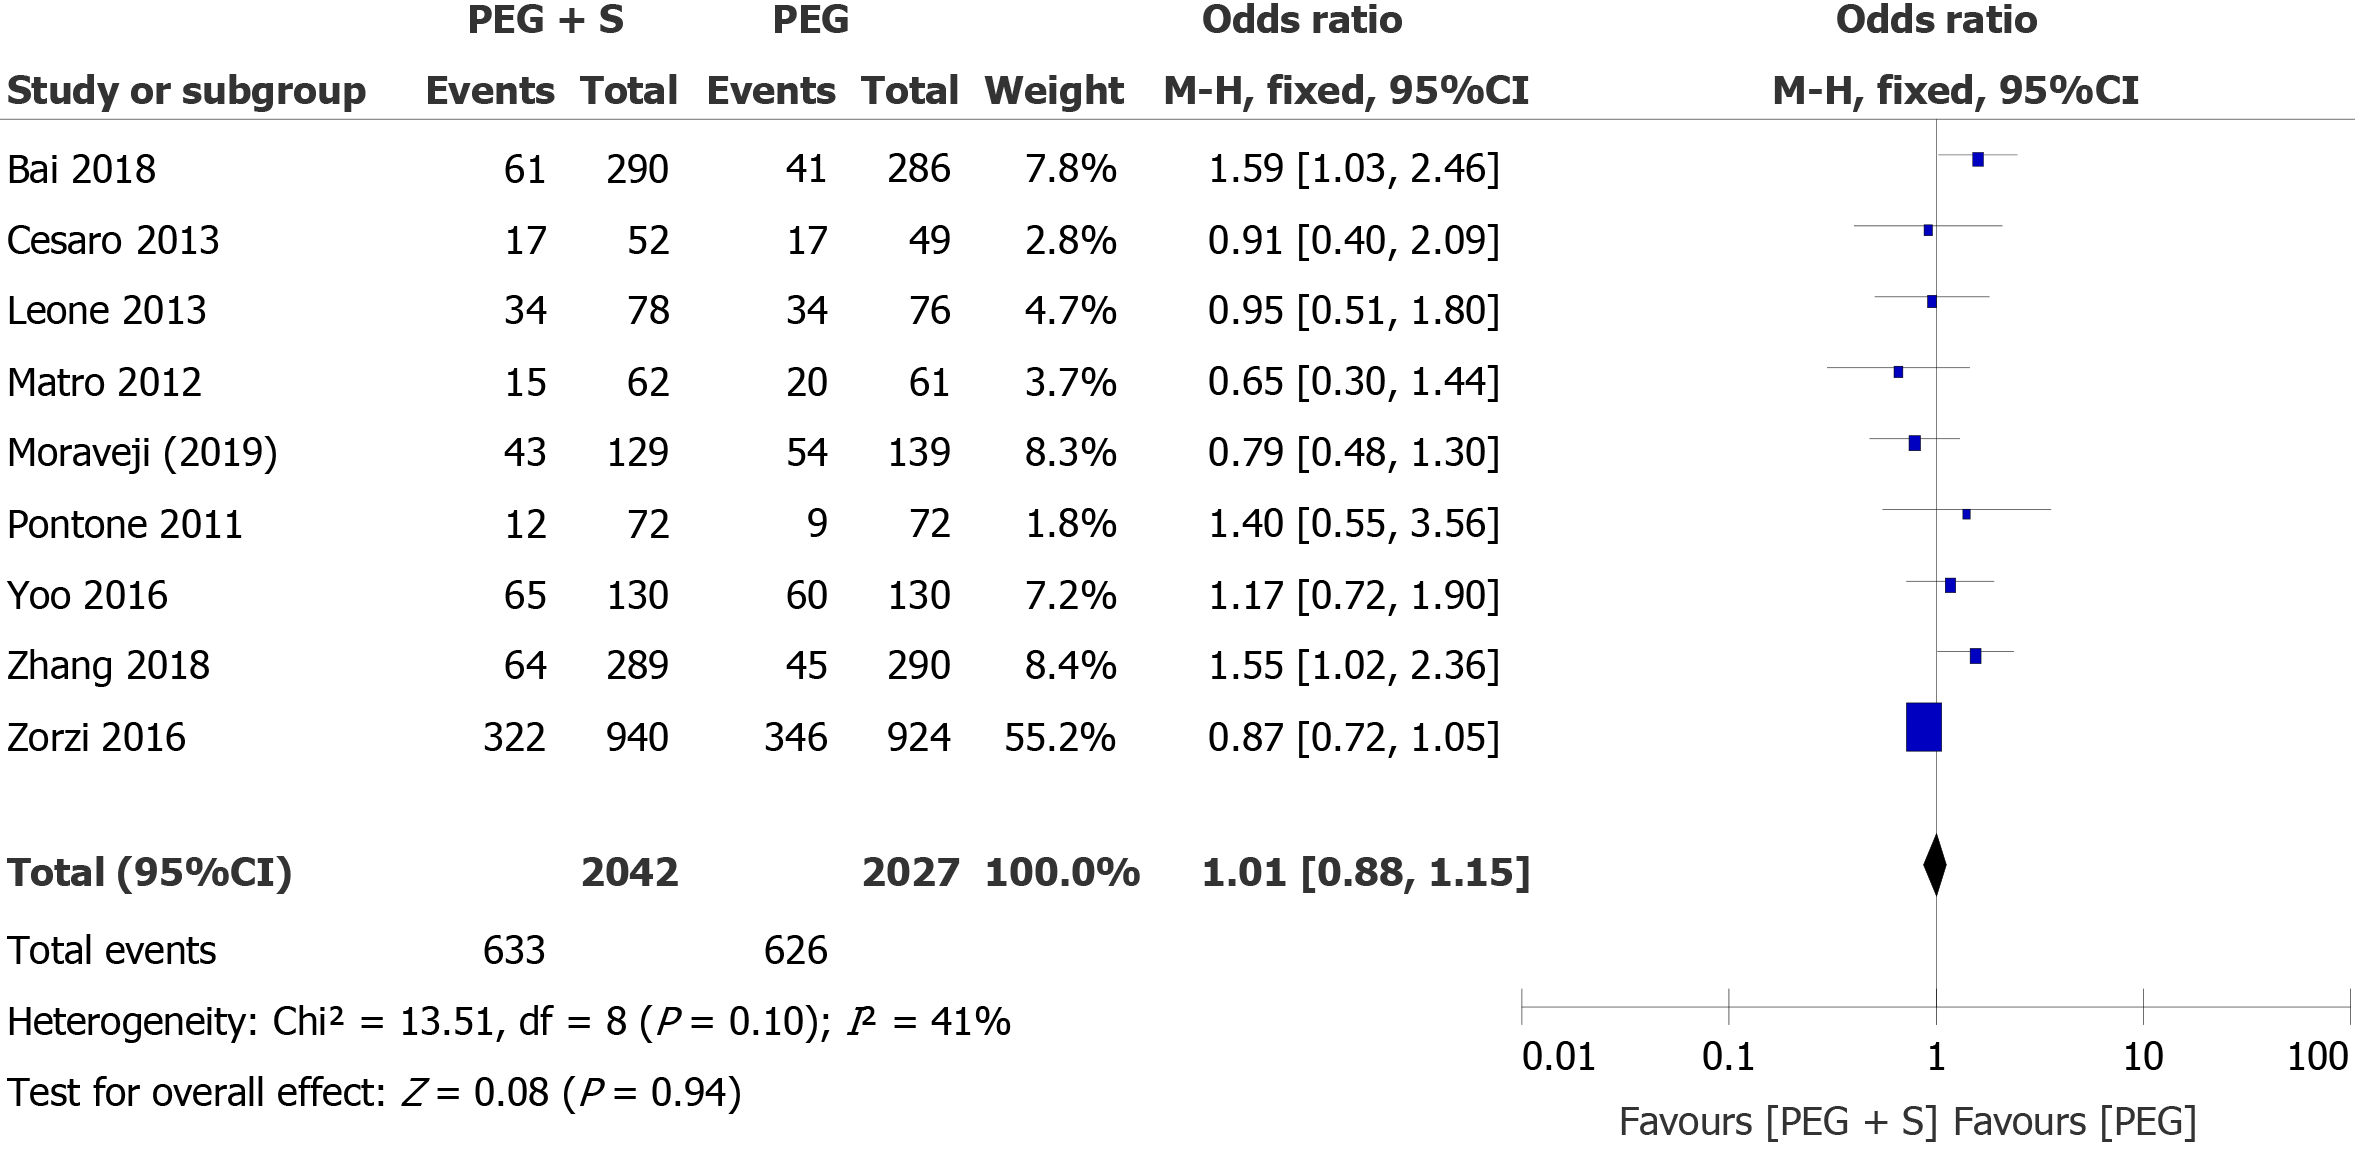
Figure 2 Forest plot of the effect of simethicone on overall adenoma detection rate.
CI: Confidence interval; PEG: Polyethylene glycol; PEG+S: Polyethylene glycol plus simethicone.
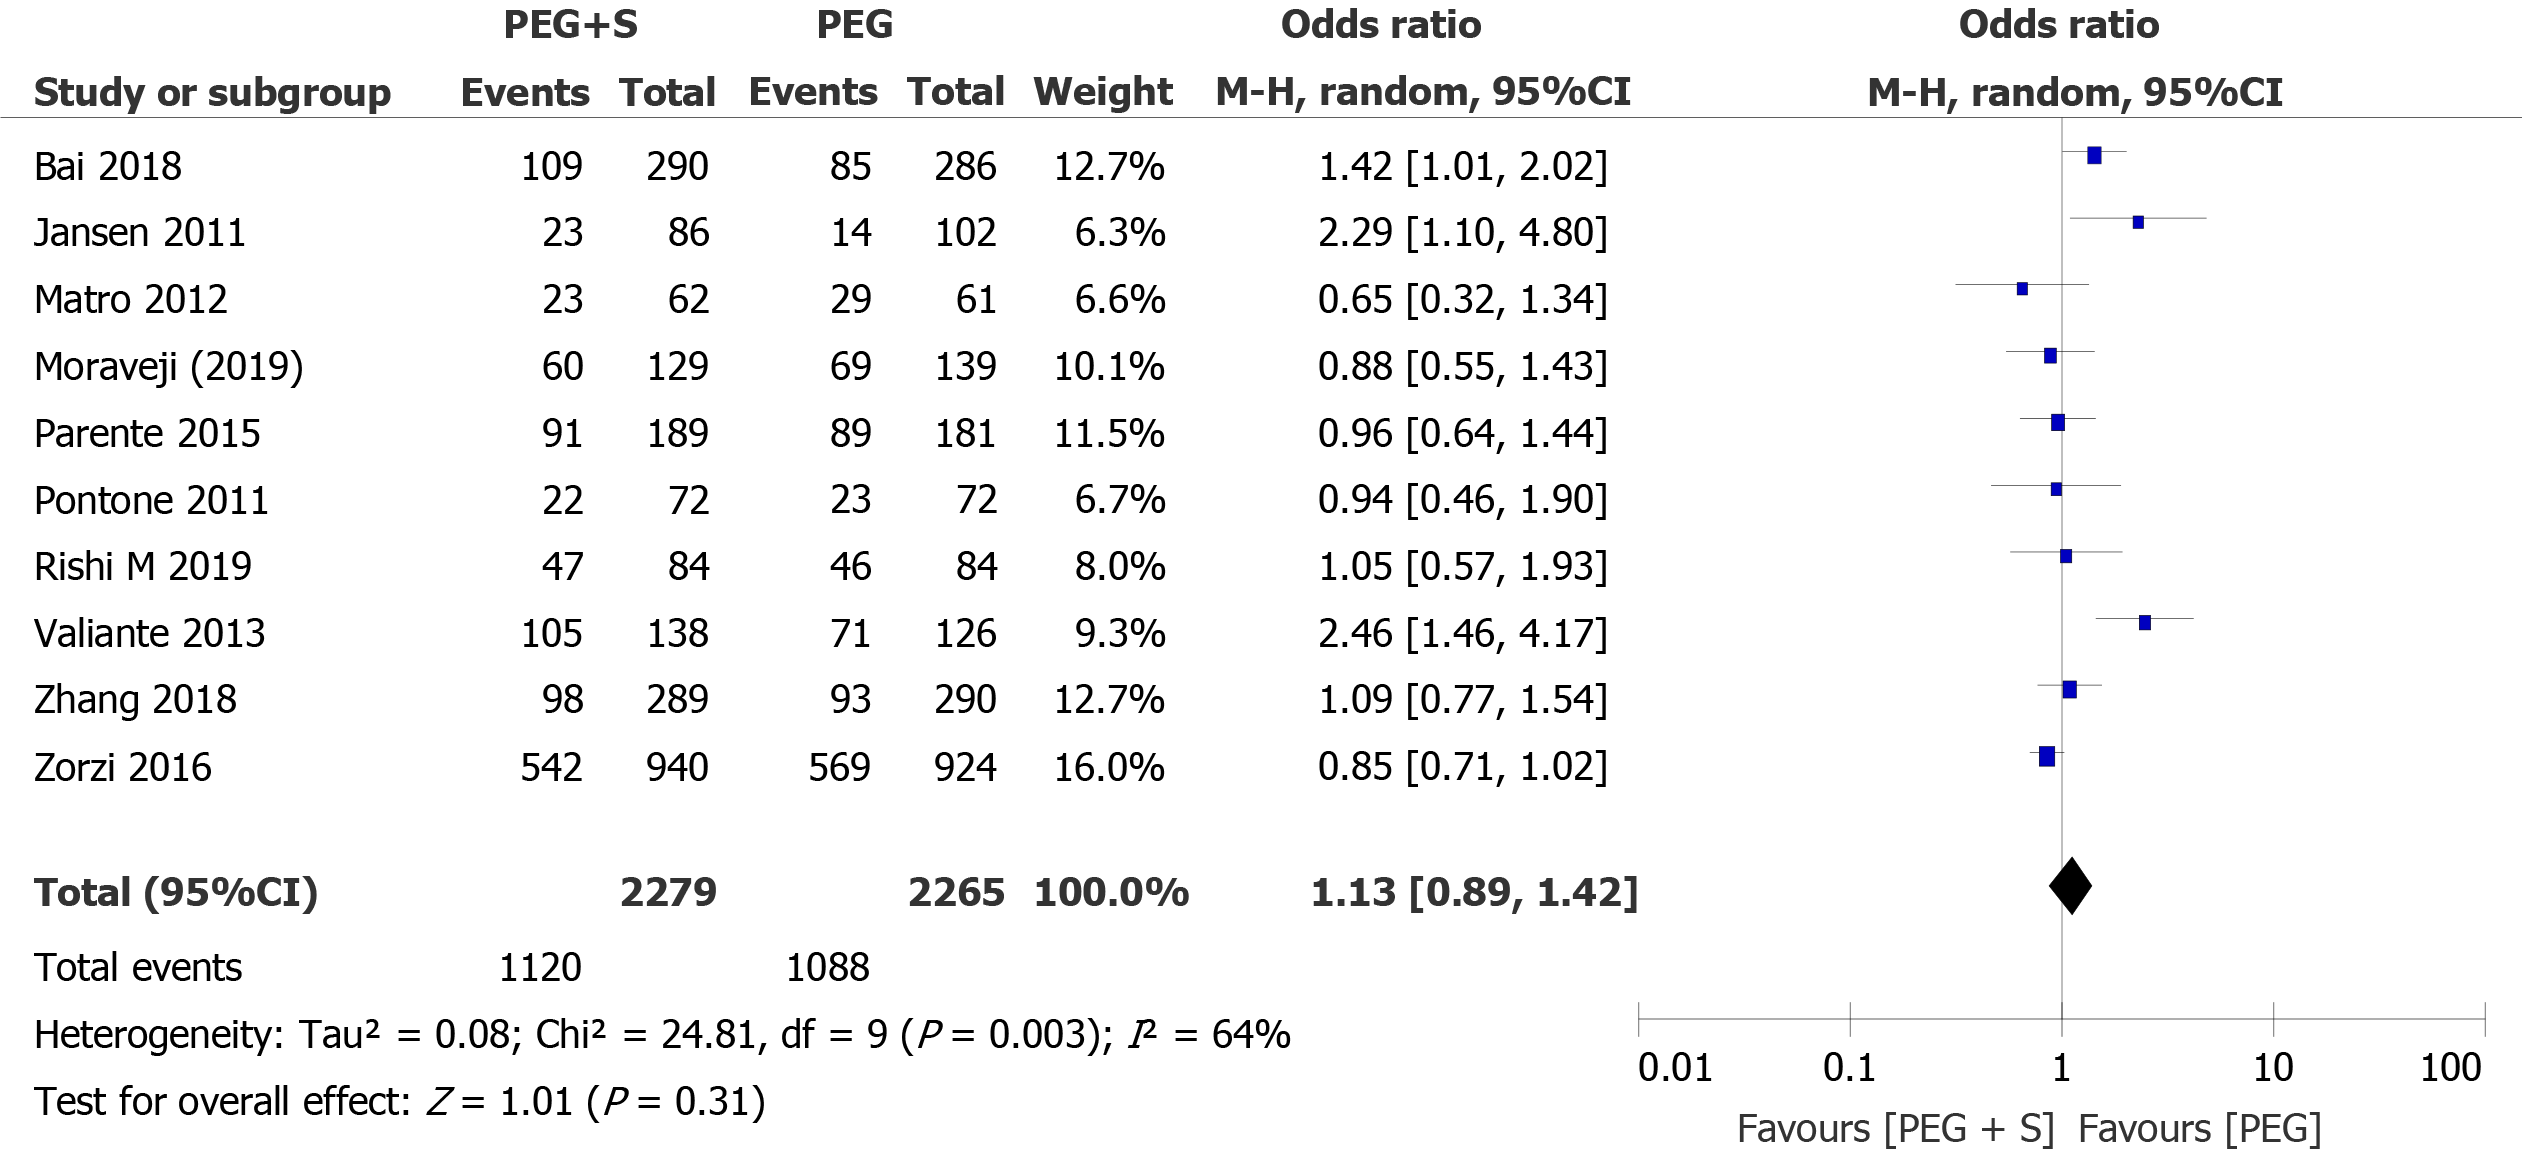
Figure 3 Forest plot of the effect of simethicone on overall polyp detection rate.
CI: Confidence interval; PEG: Polyethylene glycol; PEG+S: Polyethylene glycol plus simethicone.
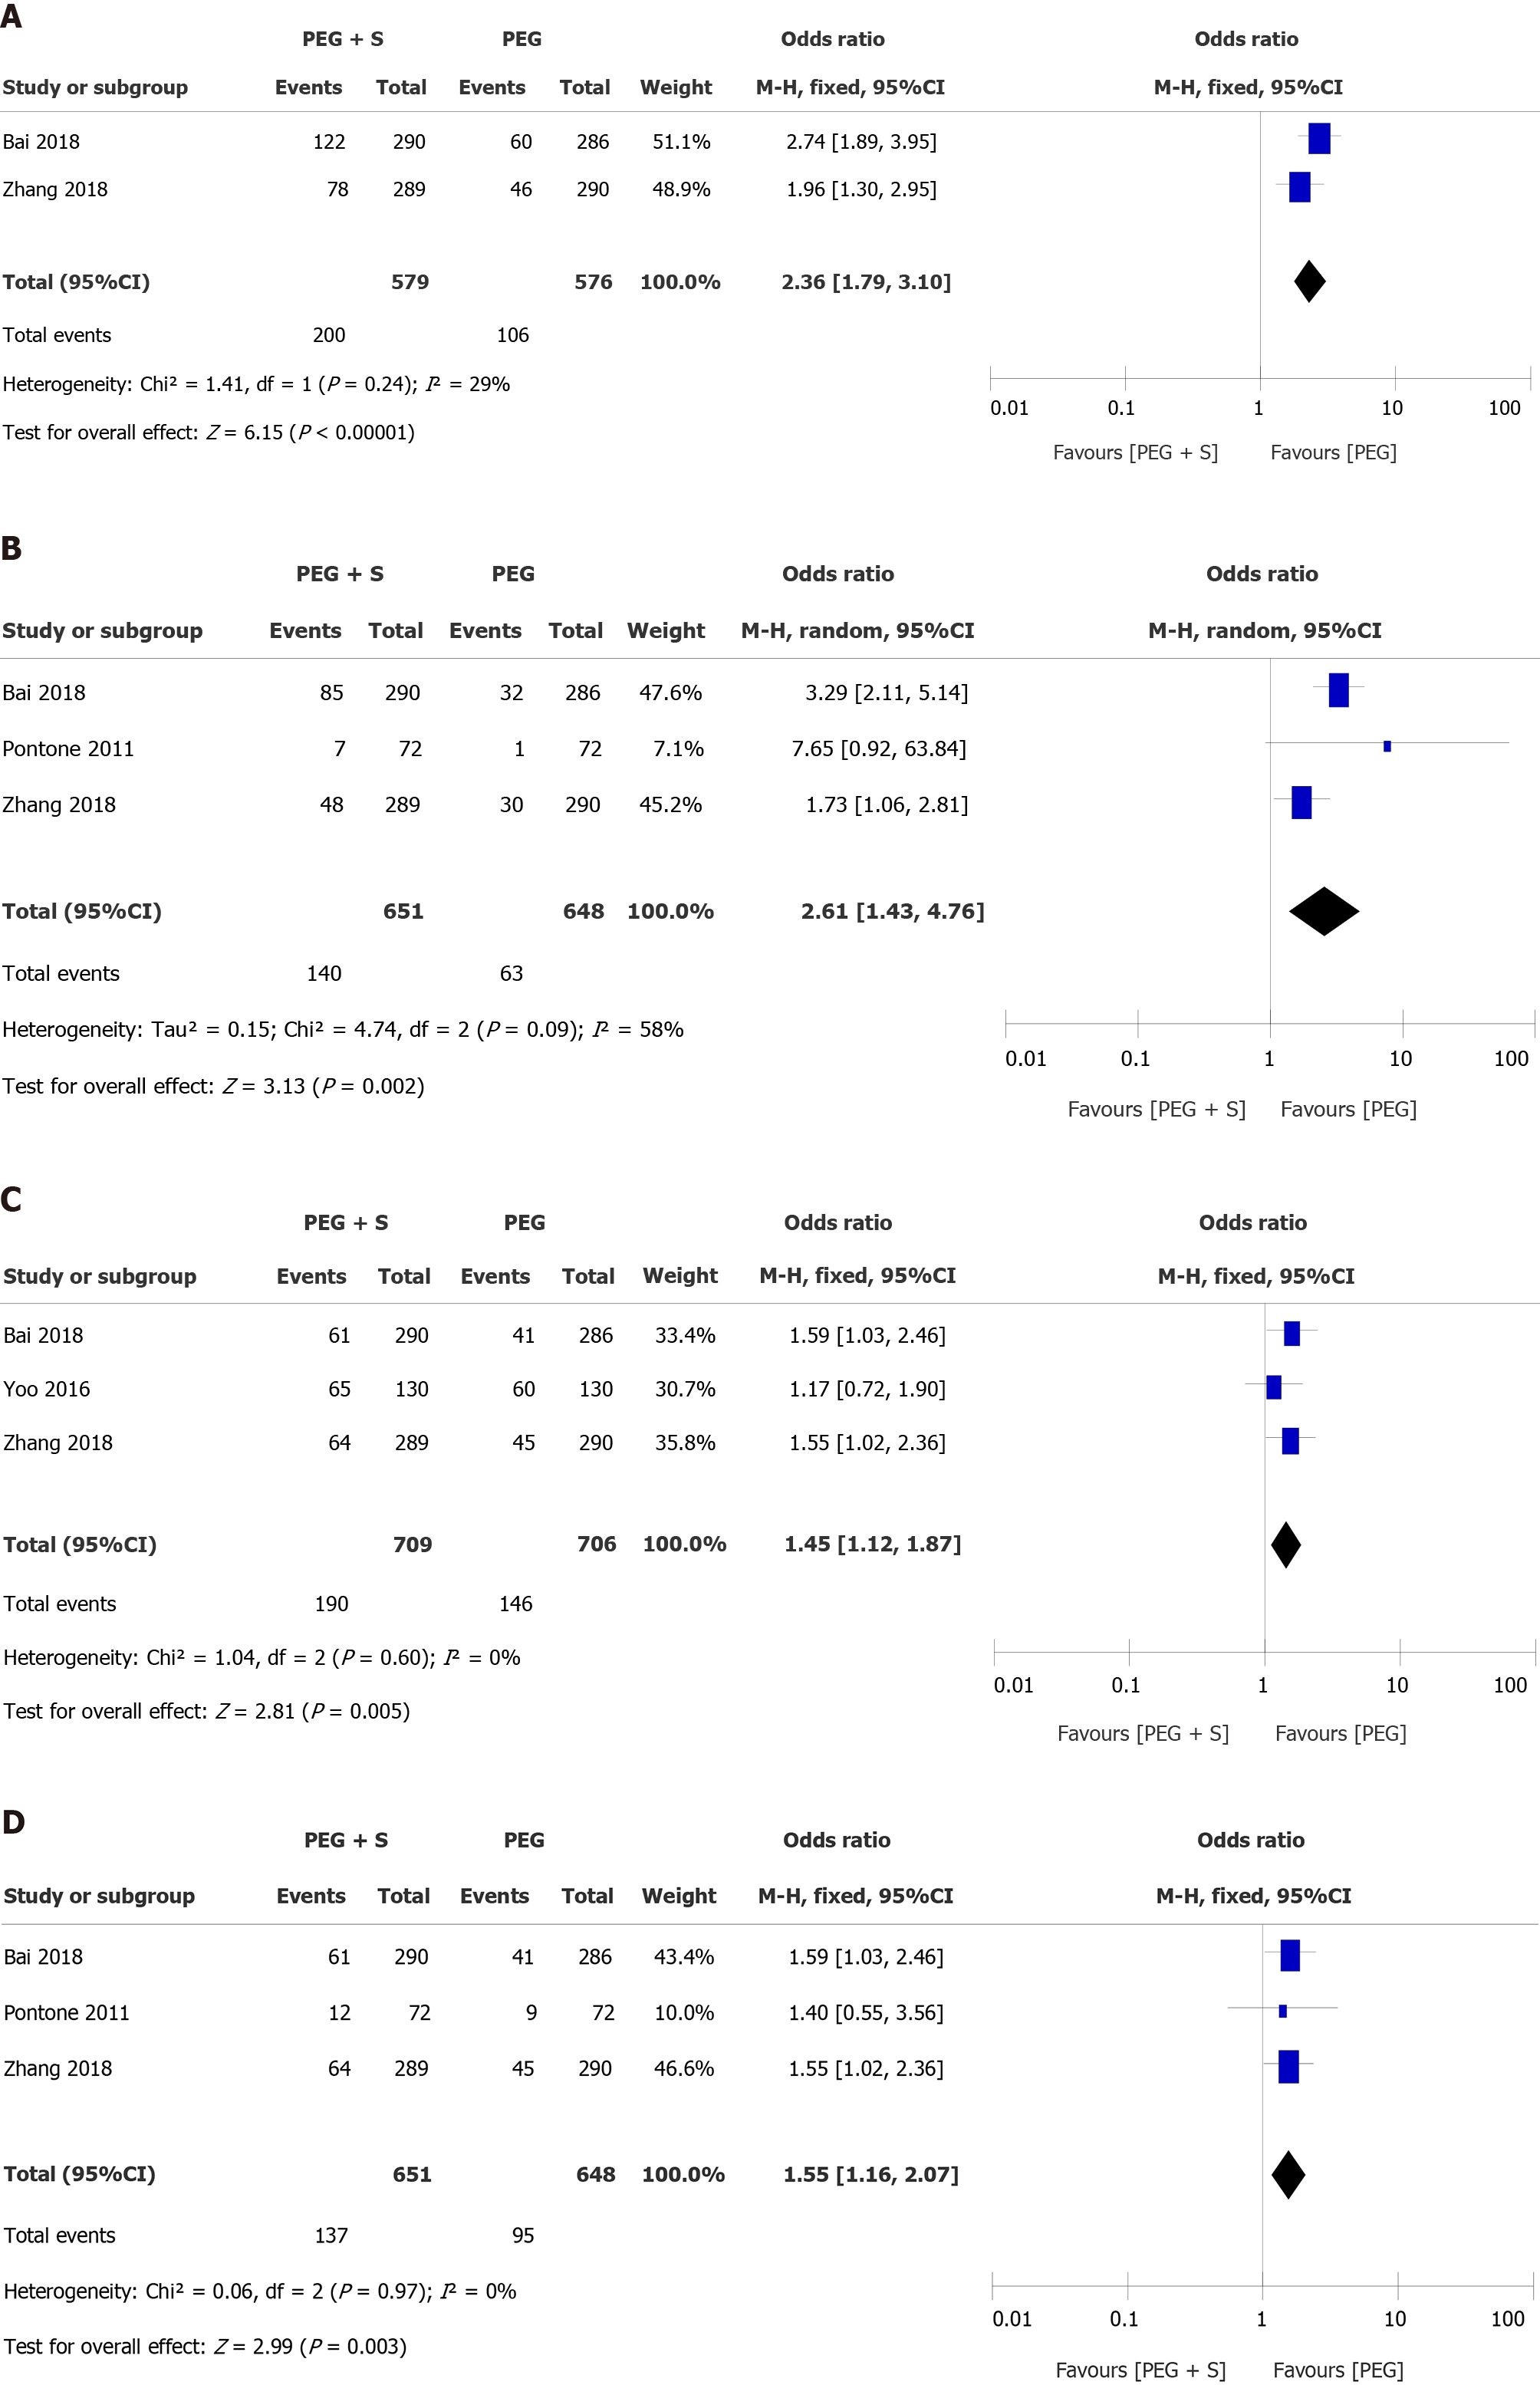
Figure 4 Forest plots of subgroup analysis.
A: Forest plot of subgroup analysis of the effect of simethicone on adenoma detection rate (ADR) in trials with small adenomas (< 1 cm); B: Forest plot of subgroup analysis of the effect of simethicone on ADR in trials with right-side adenomas; C: Forest plot of subgroup analysis of the effect of simethicone on ADR in trials of the population from Asia; D: Forest plot of subgroup analysis of the effect of simethicone on ADR in trials with the baseline ADR < 25%. CI: Confidence interval; PEG: Polyethylene glycol; PEG+S: Polyethylene glycol plus simethicone.
- Citation: Zhang H, Gong J, Ma LS, Jiang T, Zhang H. Effect of antifoaming agent on benign colorectal tumors in colonoscopy: A meta-analysis. World J Clin Cases 2021; 9(15): 3607-3622
- URL: https://www.wjgnet.com/2307-8960/full/v9/i15/3607.htm
- DOI: https://dx.doi.org/10.12998/wjcc.v9.i15.3607


