Copyright
©The Author(s) 2021.
World J Clin Cases. May 26, 2021; 9(15): 3531-3545
Published online May 26, 2021. doi: 10.12998/wjcc.v9.i15.3531
Published online May 26, 2021. doi: 10.12998/wjcc.v9.i15.3531
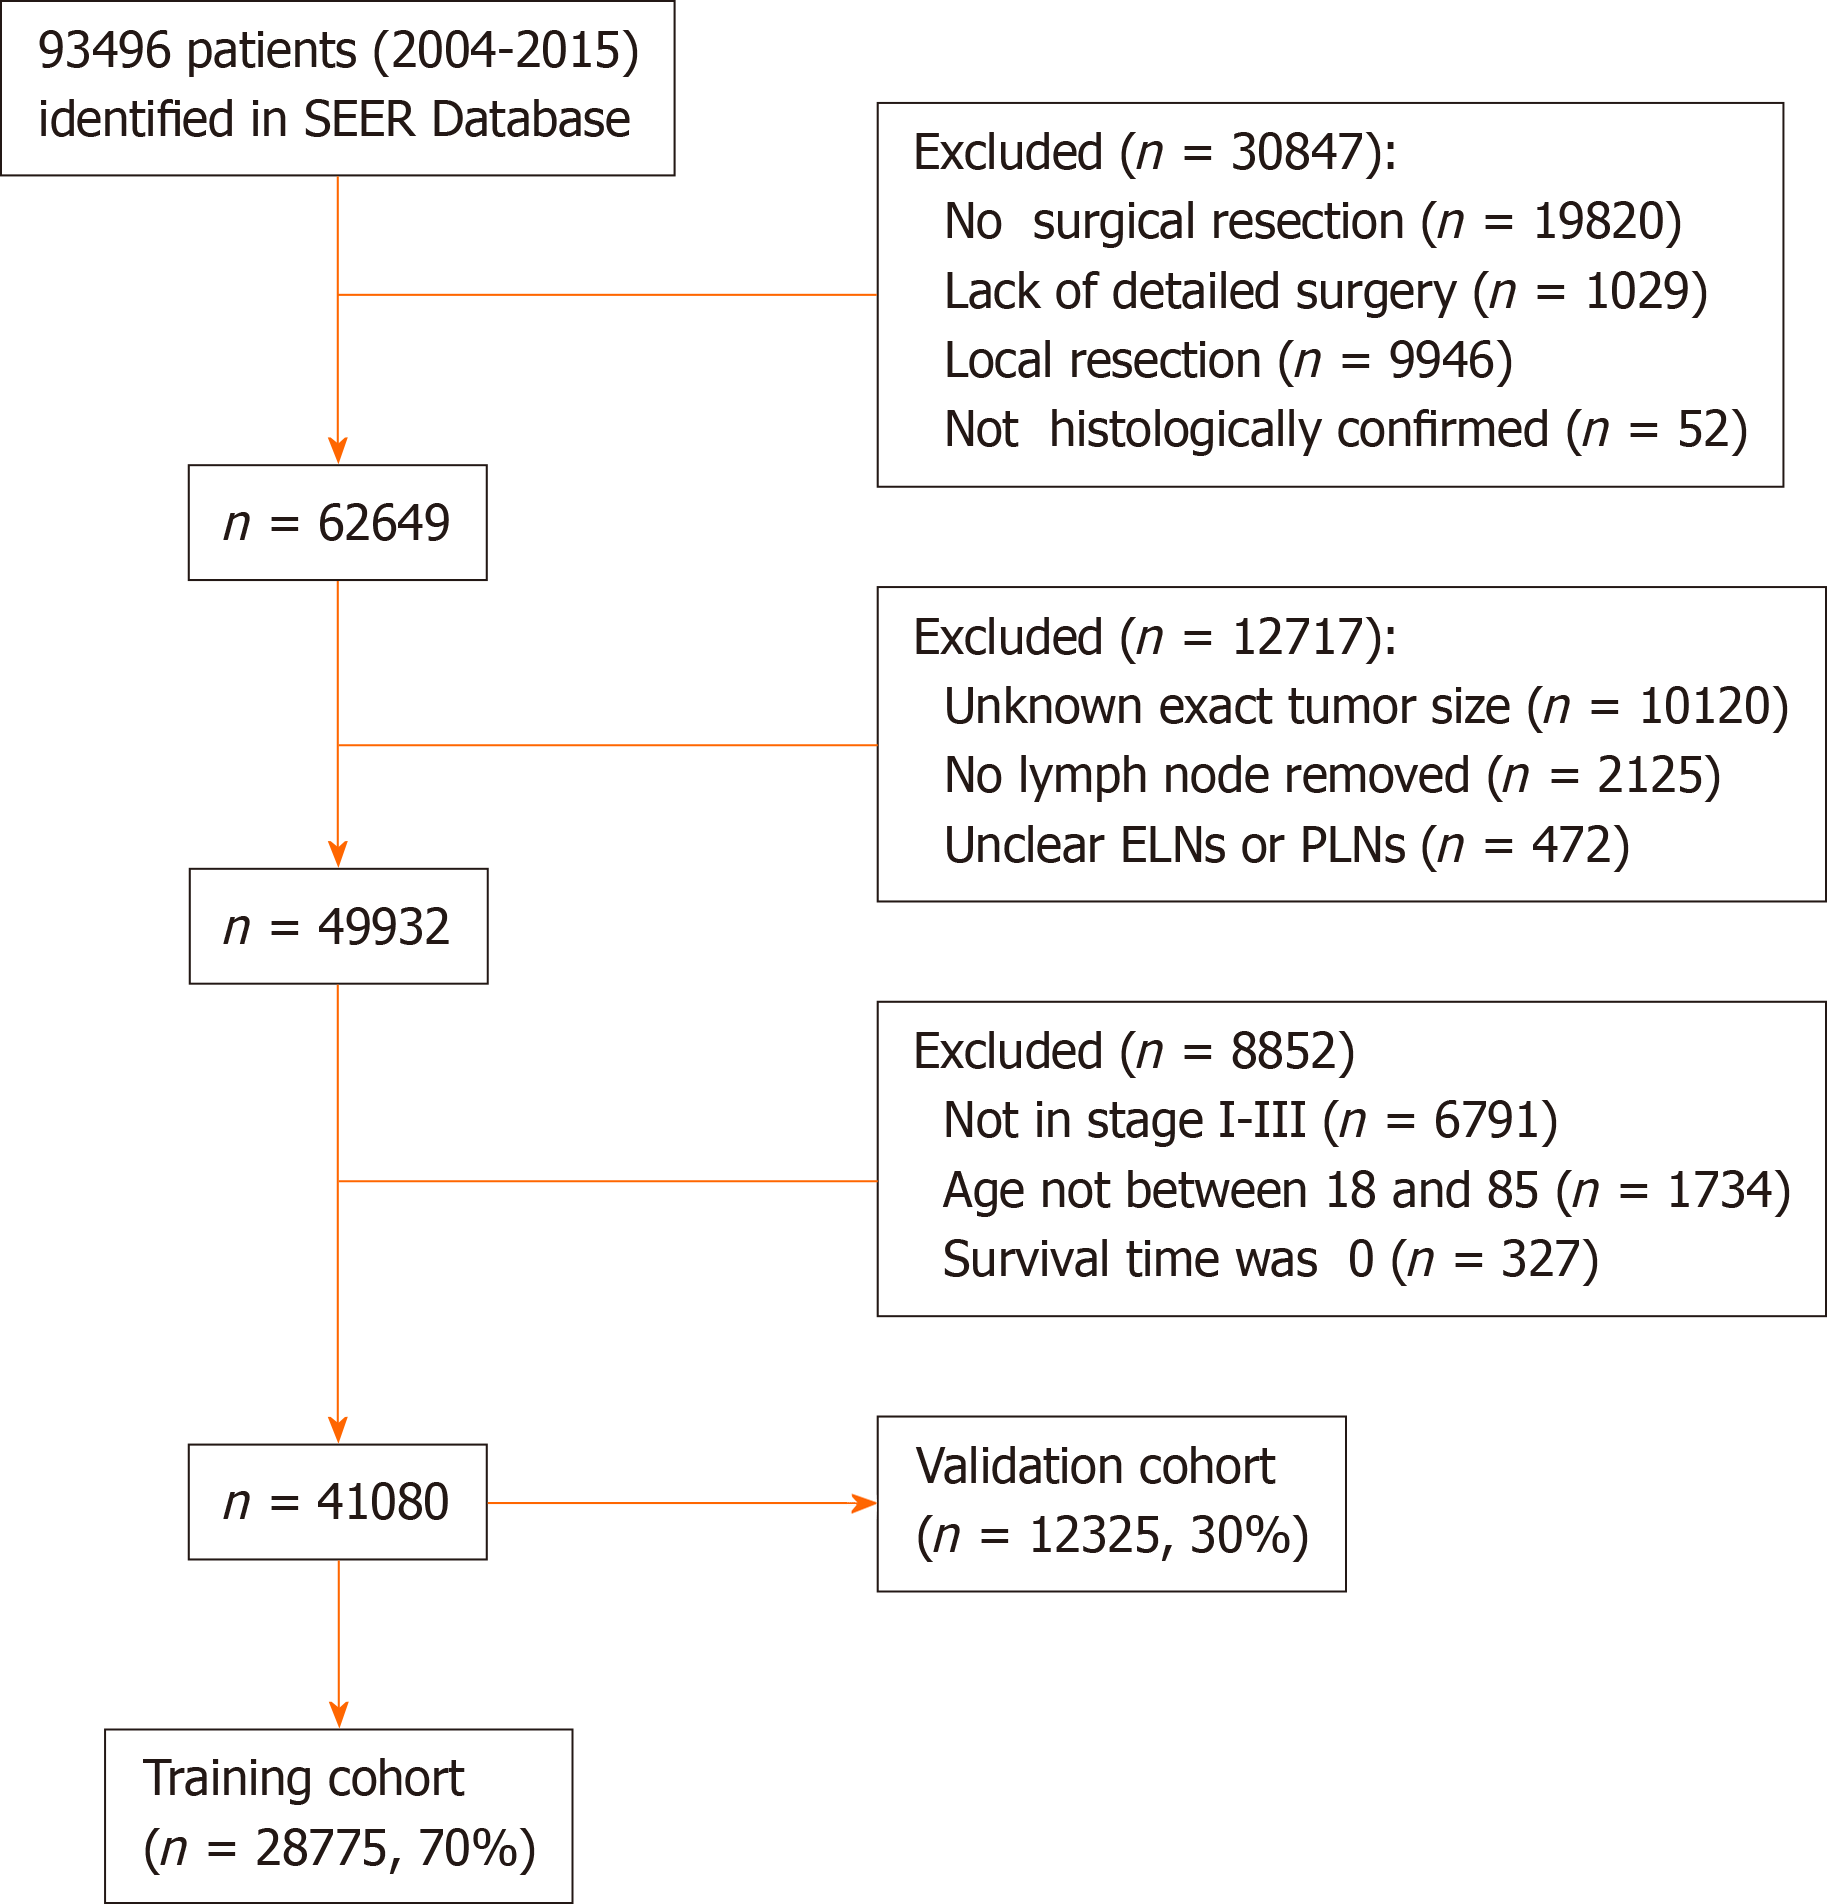
Figure 1 Flowchart of patient selection.
SEER: Surveillance, Epidemiology, and End Results Program; ELNs: Examined lymph nodes; PLNs: Positive lymph nodes.
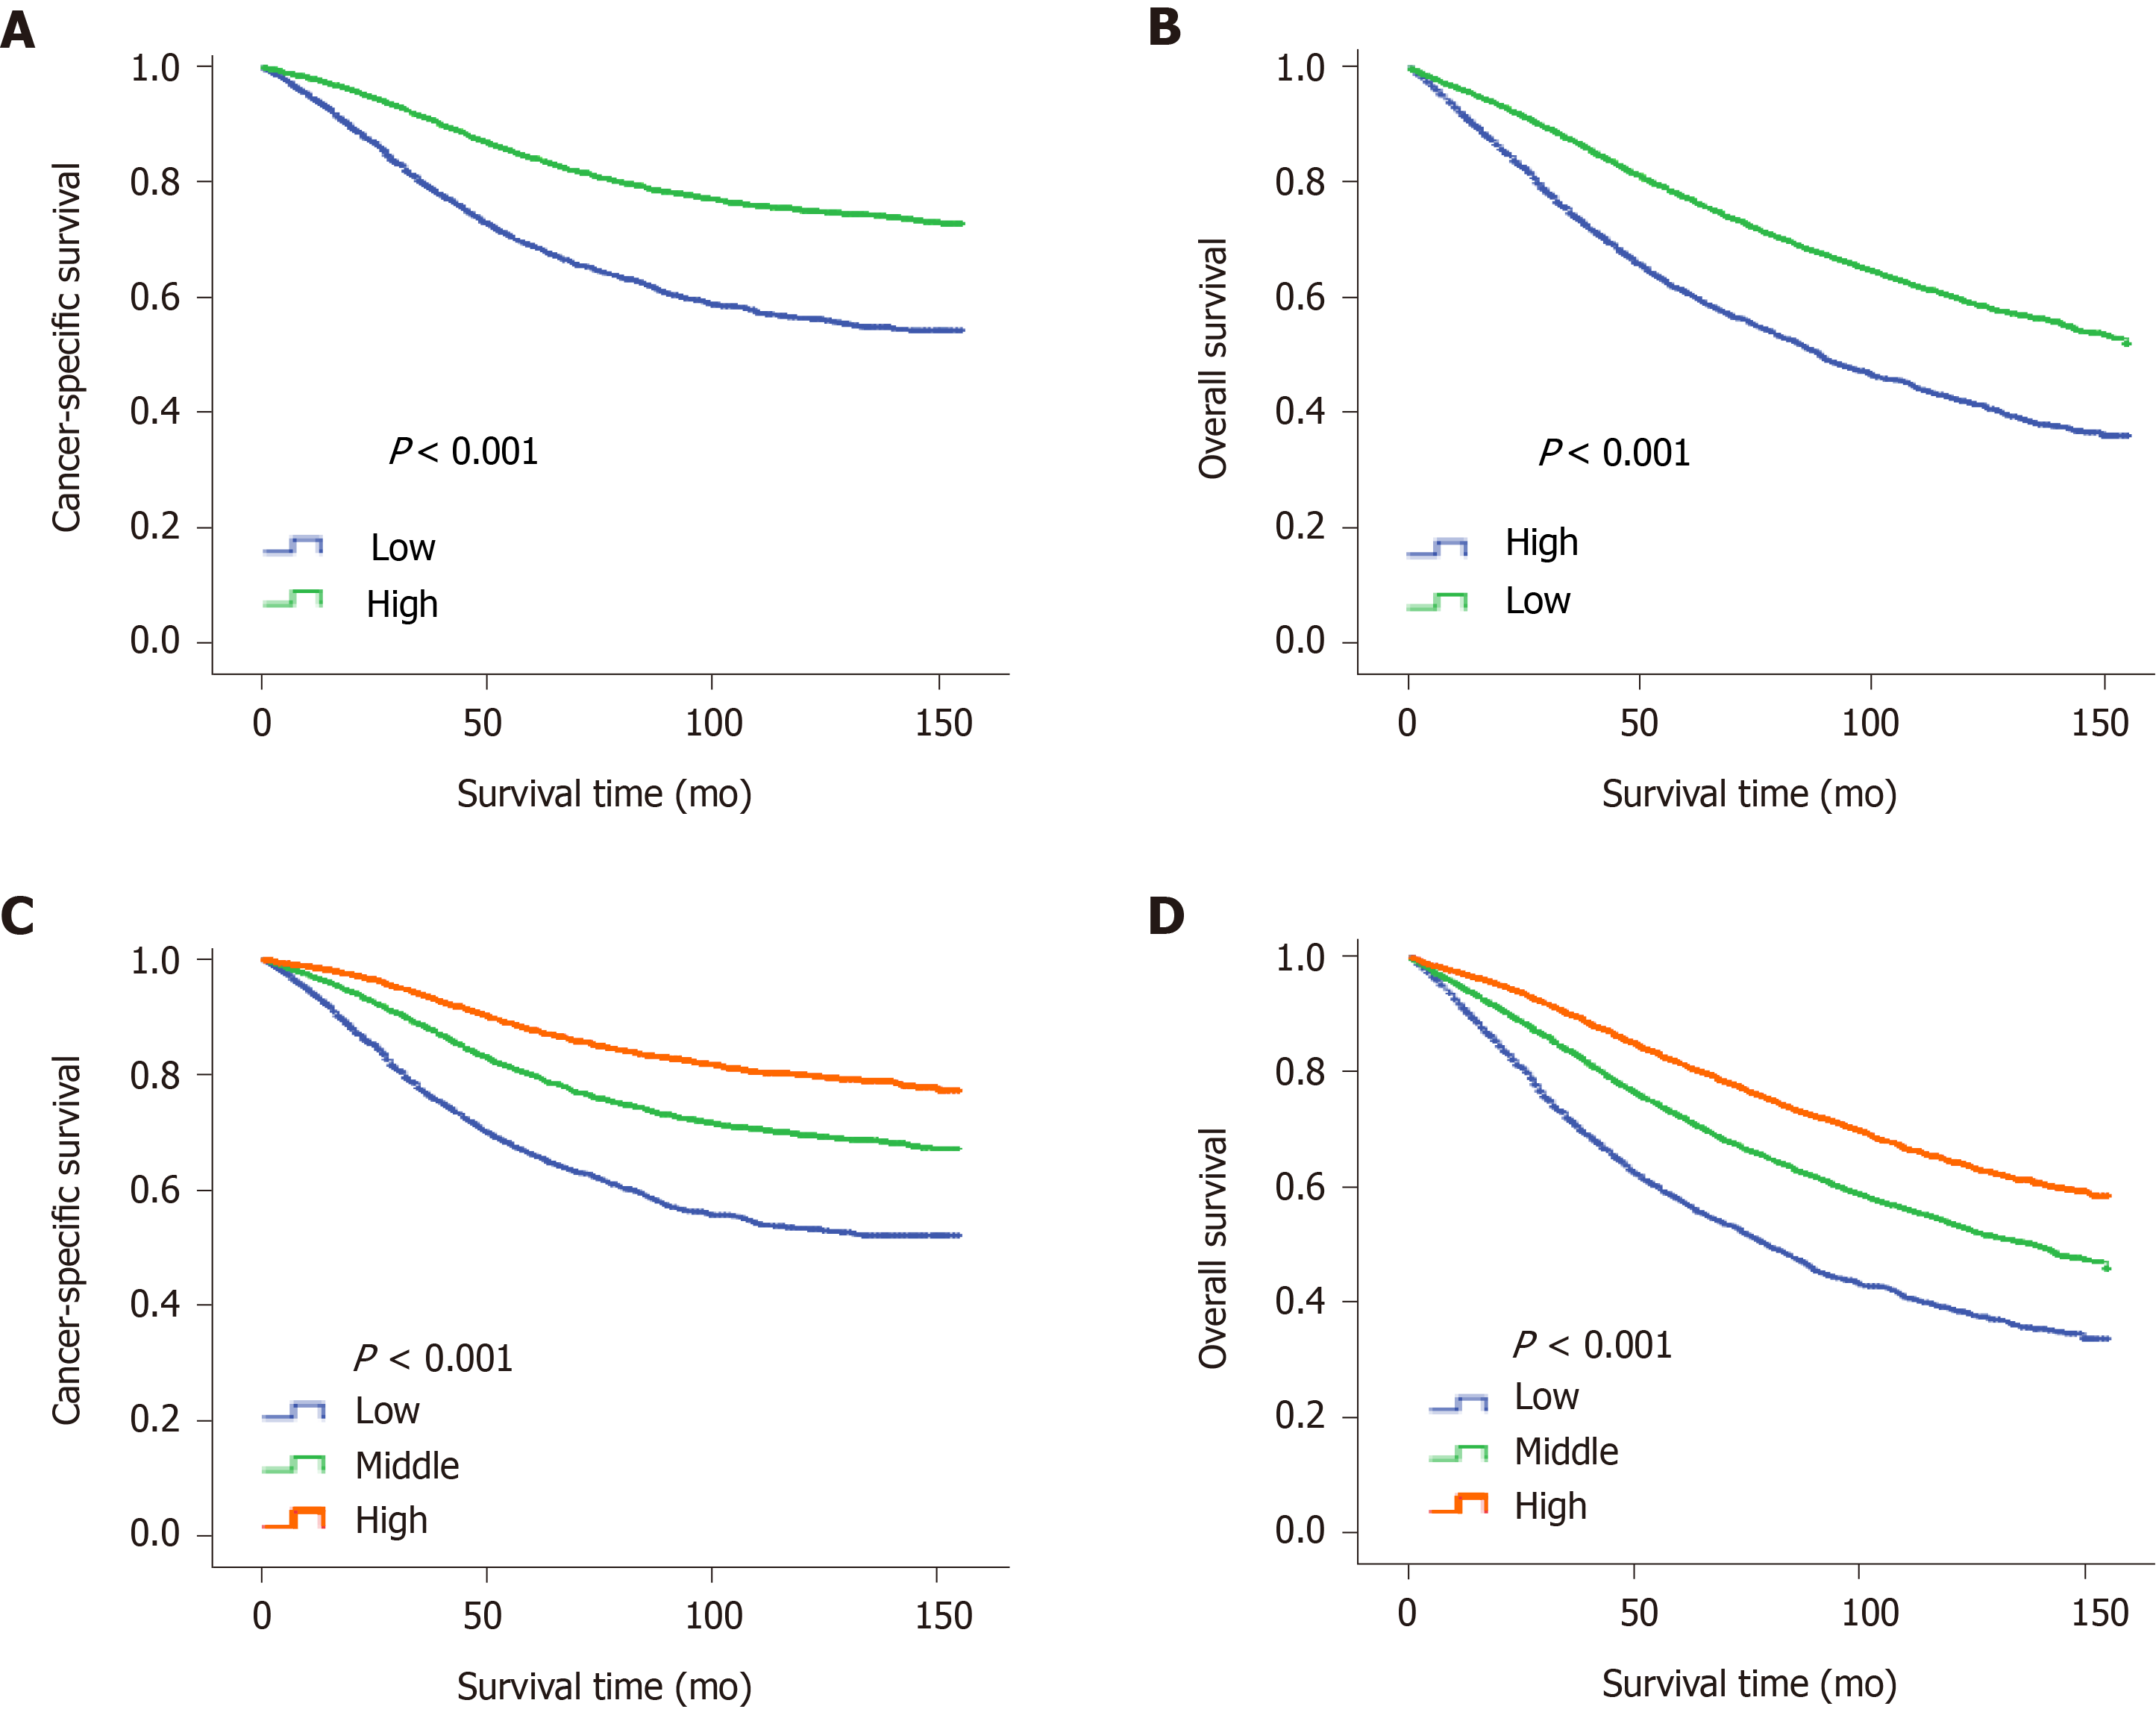
Figure 2 Kaplan-Meier survival curves of the cutoff values in the training cohort.
A: Kaplan Meier survival curve of cutoff -0.8 cancer-specific survival in the training cohort; B: Kaplan Meier survival curve of cutoff -0.8 overall survival in the training cohort; C: Kaplan Meier survival curve of cutoff -0.9 and -0.4 cancer-specific survival in the training cohort; D: Kaplan Meier survival curve of cutoff -0.9 and -0.4 overall survival in the training cohort.
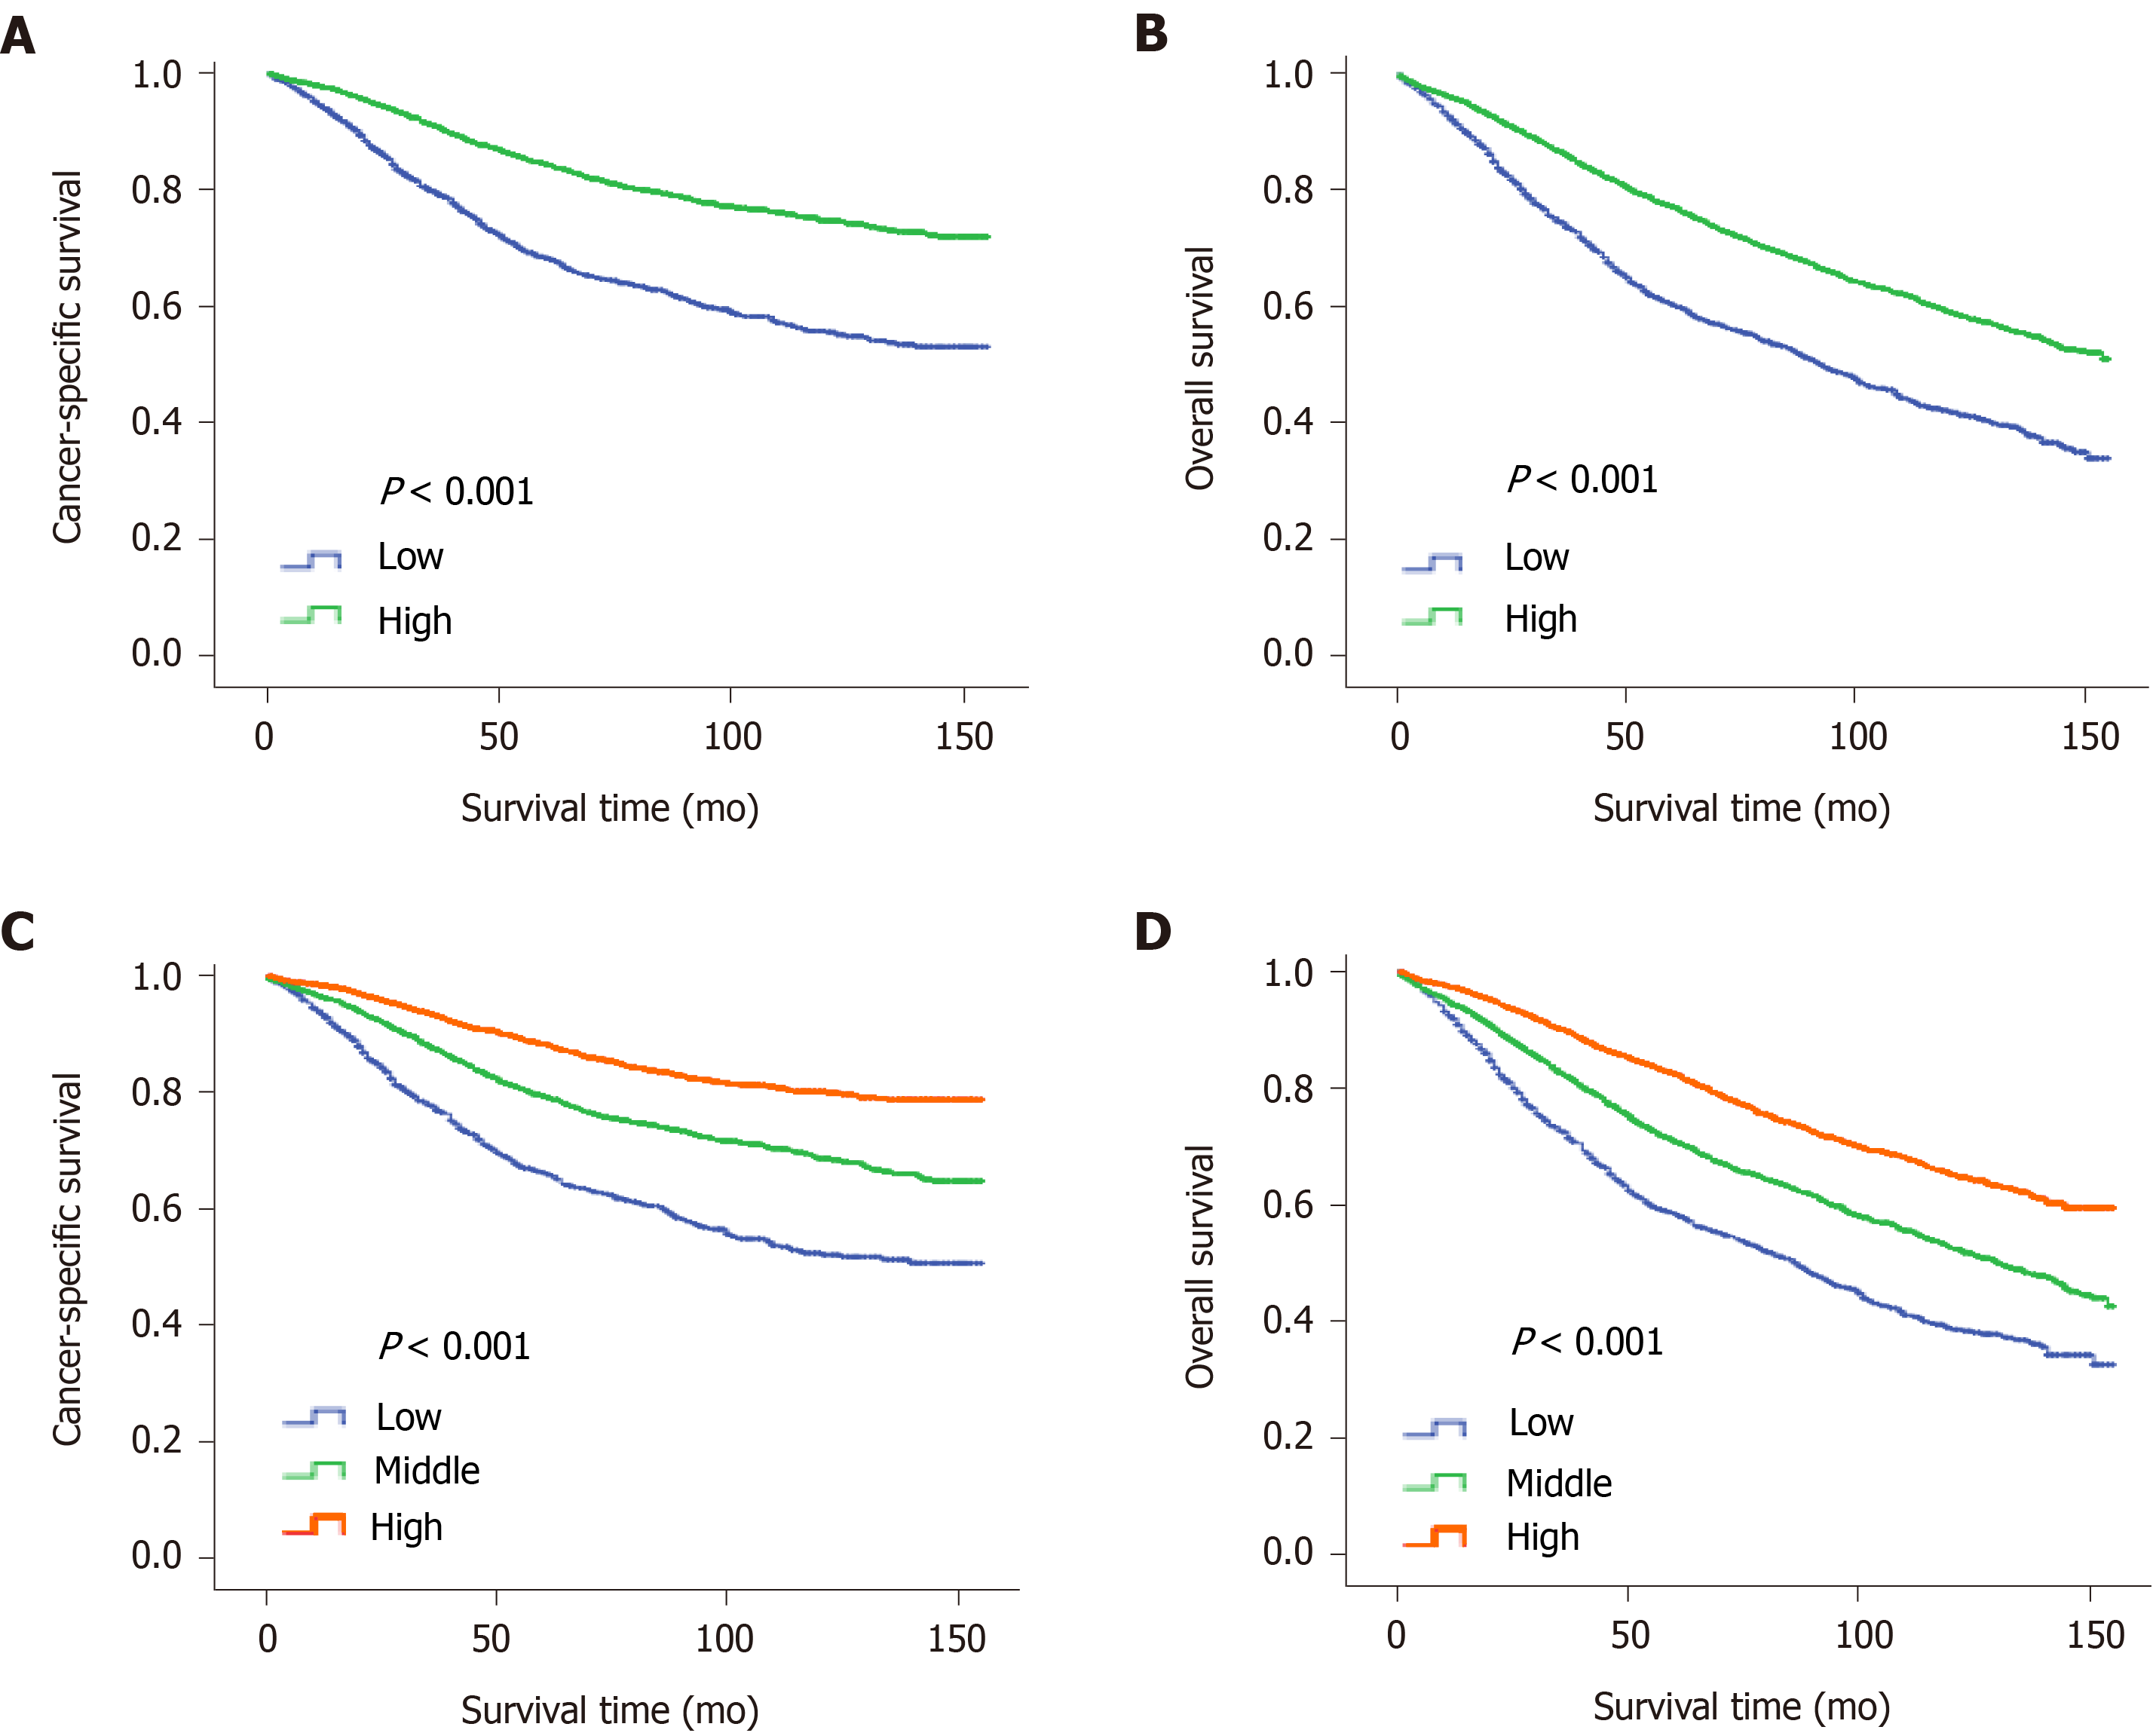
Figure 3 Kaplan-Meier survival curves of cutoff values in the validation cohort.
A: Kaplan Meier survival curve of cutoff -0.8 cancer-specific survival in the validation cohort; B: Kaplan Meier survival curve of cutoff -0.8 overall survival in the validation cohort; C: Kaplan Meier survival curve of cutoff -0.9 and -0.4 cancer-specific survival in the validation cohort; D: Kaplan Meier survival curve of cutoff -0.9 and -0.4 overall survival in the validation cohort.
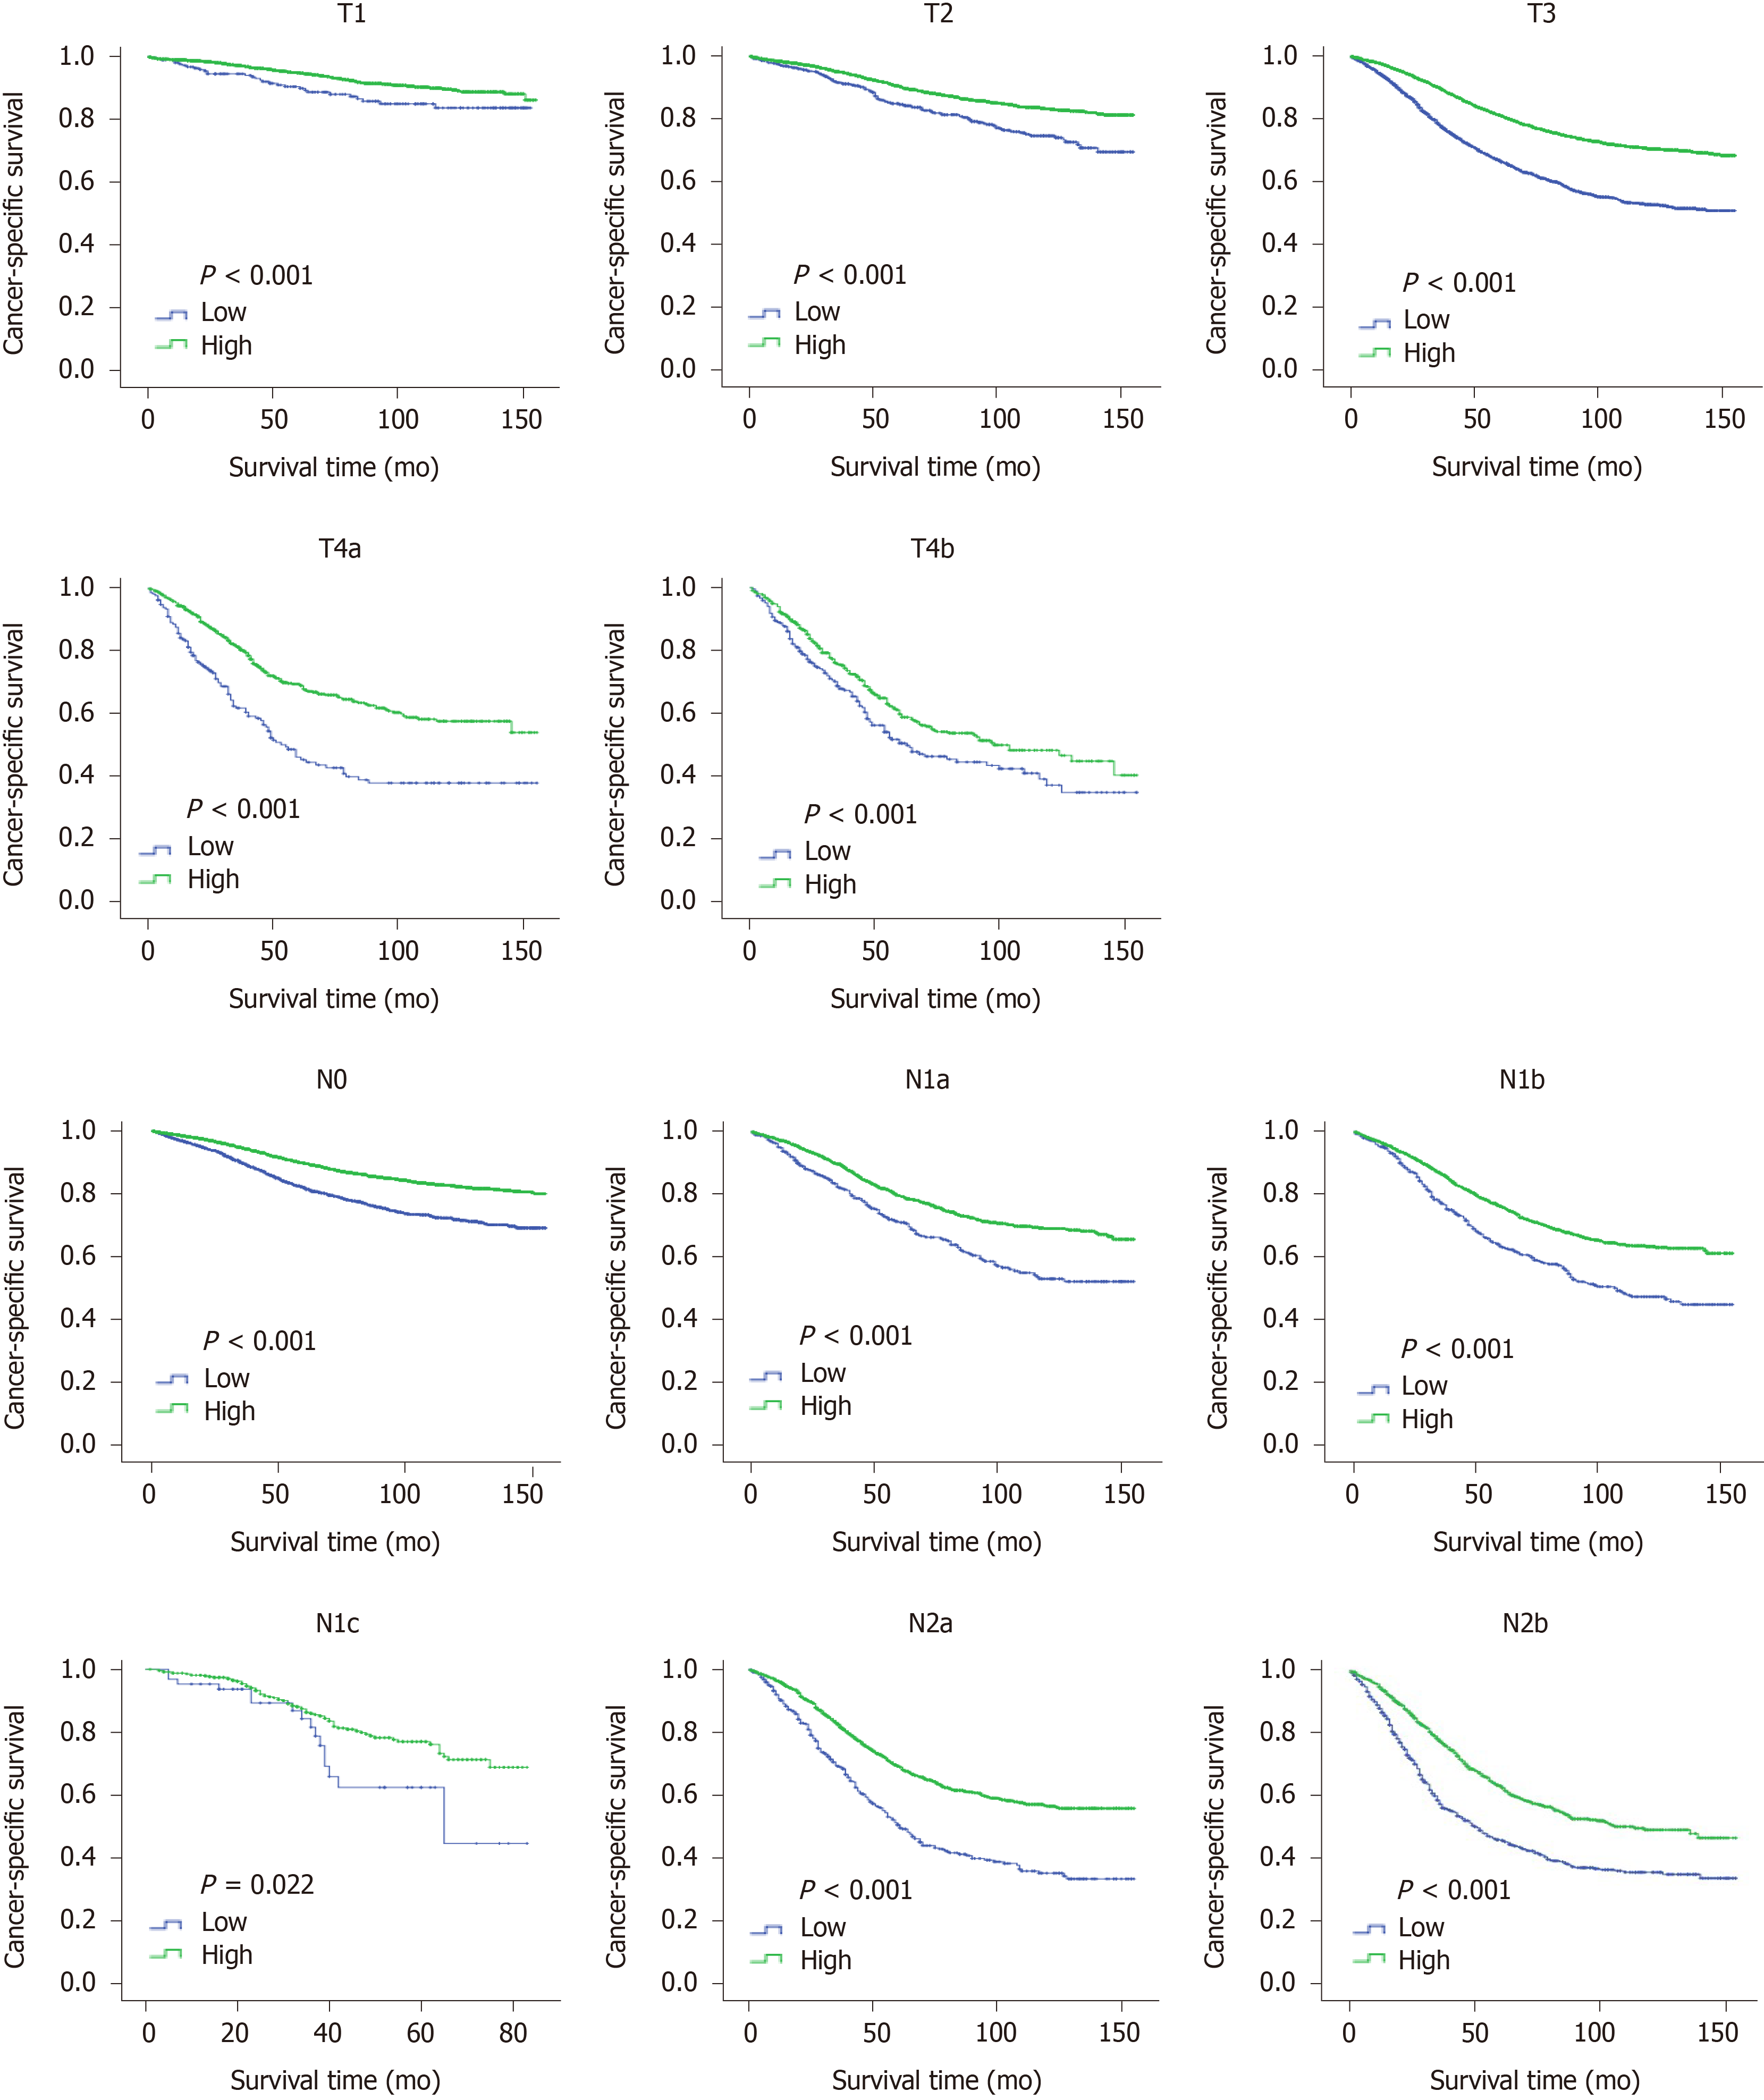
Figure 4 Kaplan-Meier survival curves of T stage and N stage subgroups for cancer-specific survival in the training cohort.
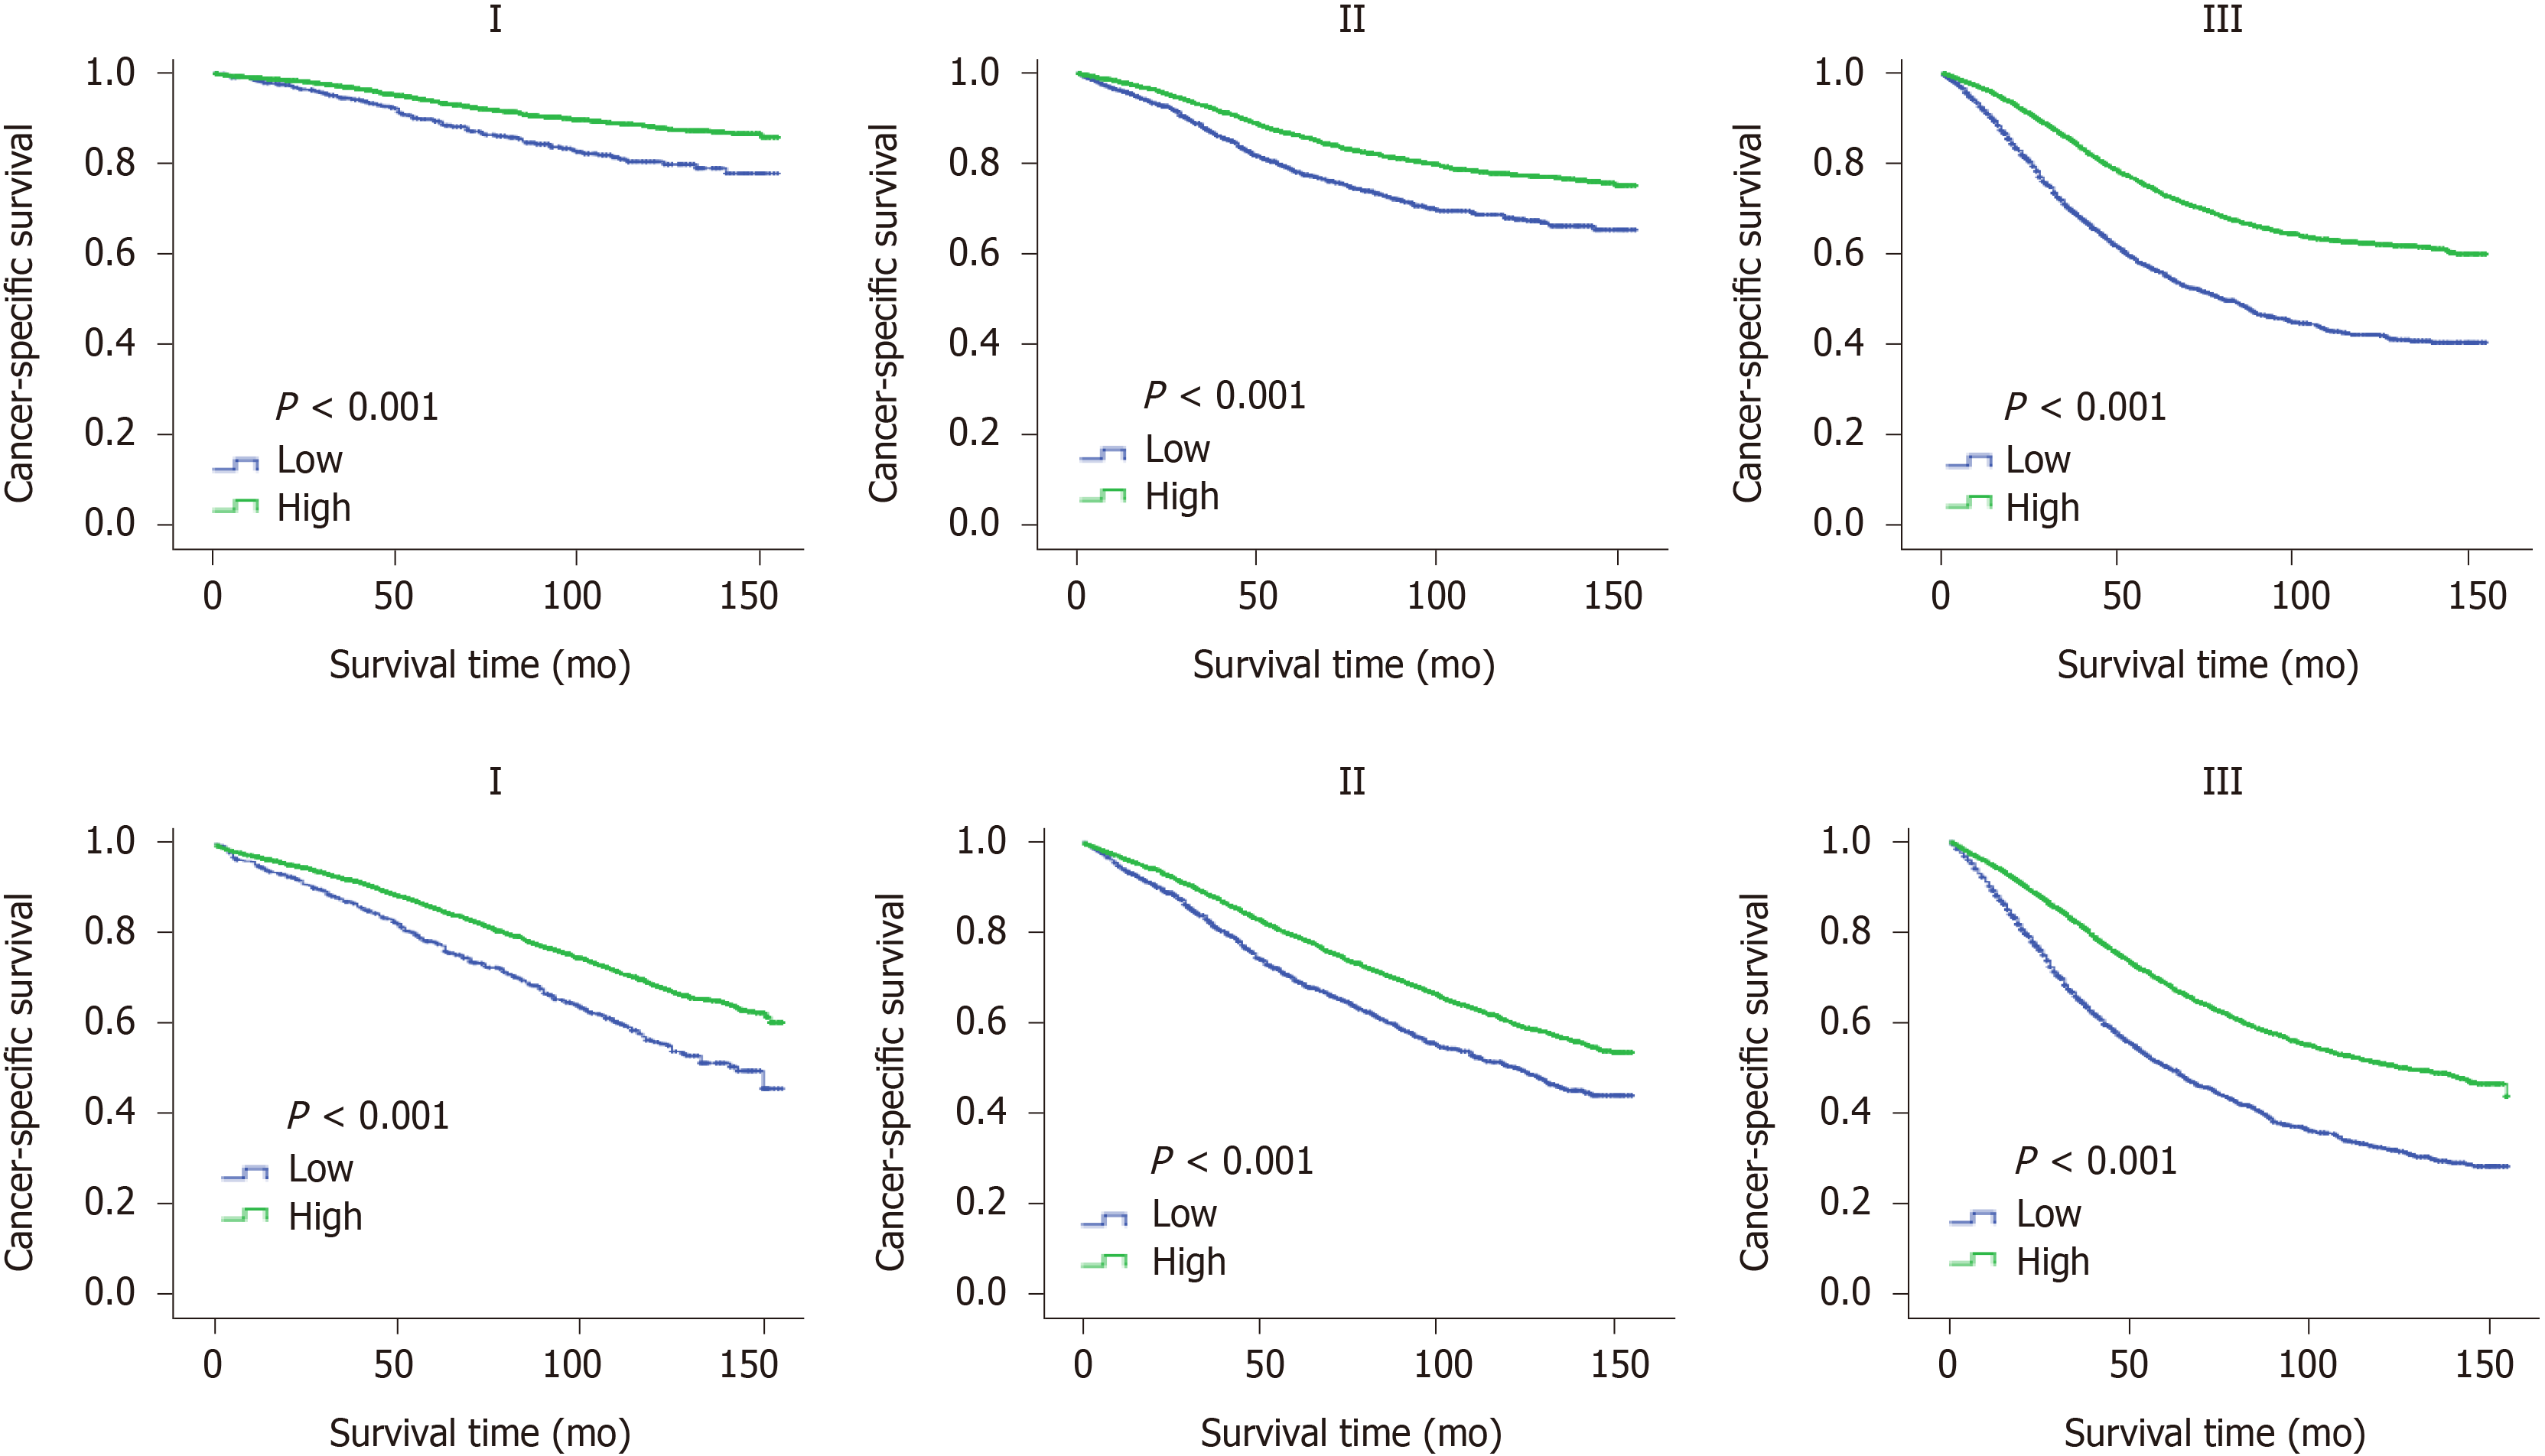
Figure 5 Kaplan-Meier survival curves of tumor-node-metastasis stage subgroup for cancer-specific survival and overall survival in the training cohort.
- Citation: Xie JB, Pang YS, Li X, Wu XT. Critical prognostic value of the log odds of negative lymph nodes/tumor size in rectal cancer patients. World J Clin Cases 2021; 9(15): 3531-3545
- URL: https://www.wjgnet.com/2307-8960/full/v9/i15/3531.htm
- DOI: https://dx.doi.org/10.12998/wjcc.v9.i15.3531


