Copyright
©The Author(s) 2021.
World J Clin Cases. May 16, 2021; 9(14): 3432-3441
Published online May 16, 2021. doi: 10.12998/wjcc.v9.i14.3432
Published online May 16, 2021. doi: 10.12998/wjcc.v9.i14.3432
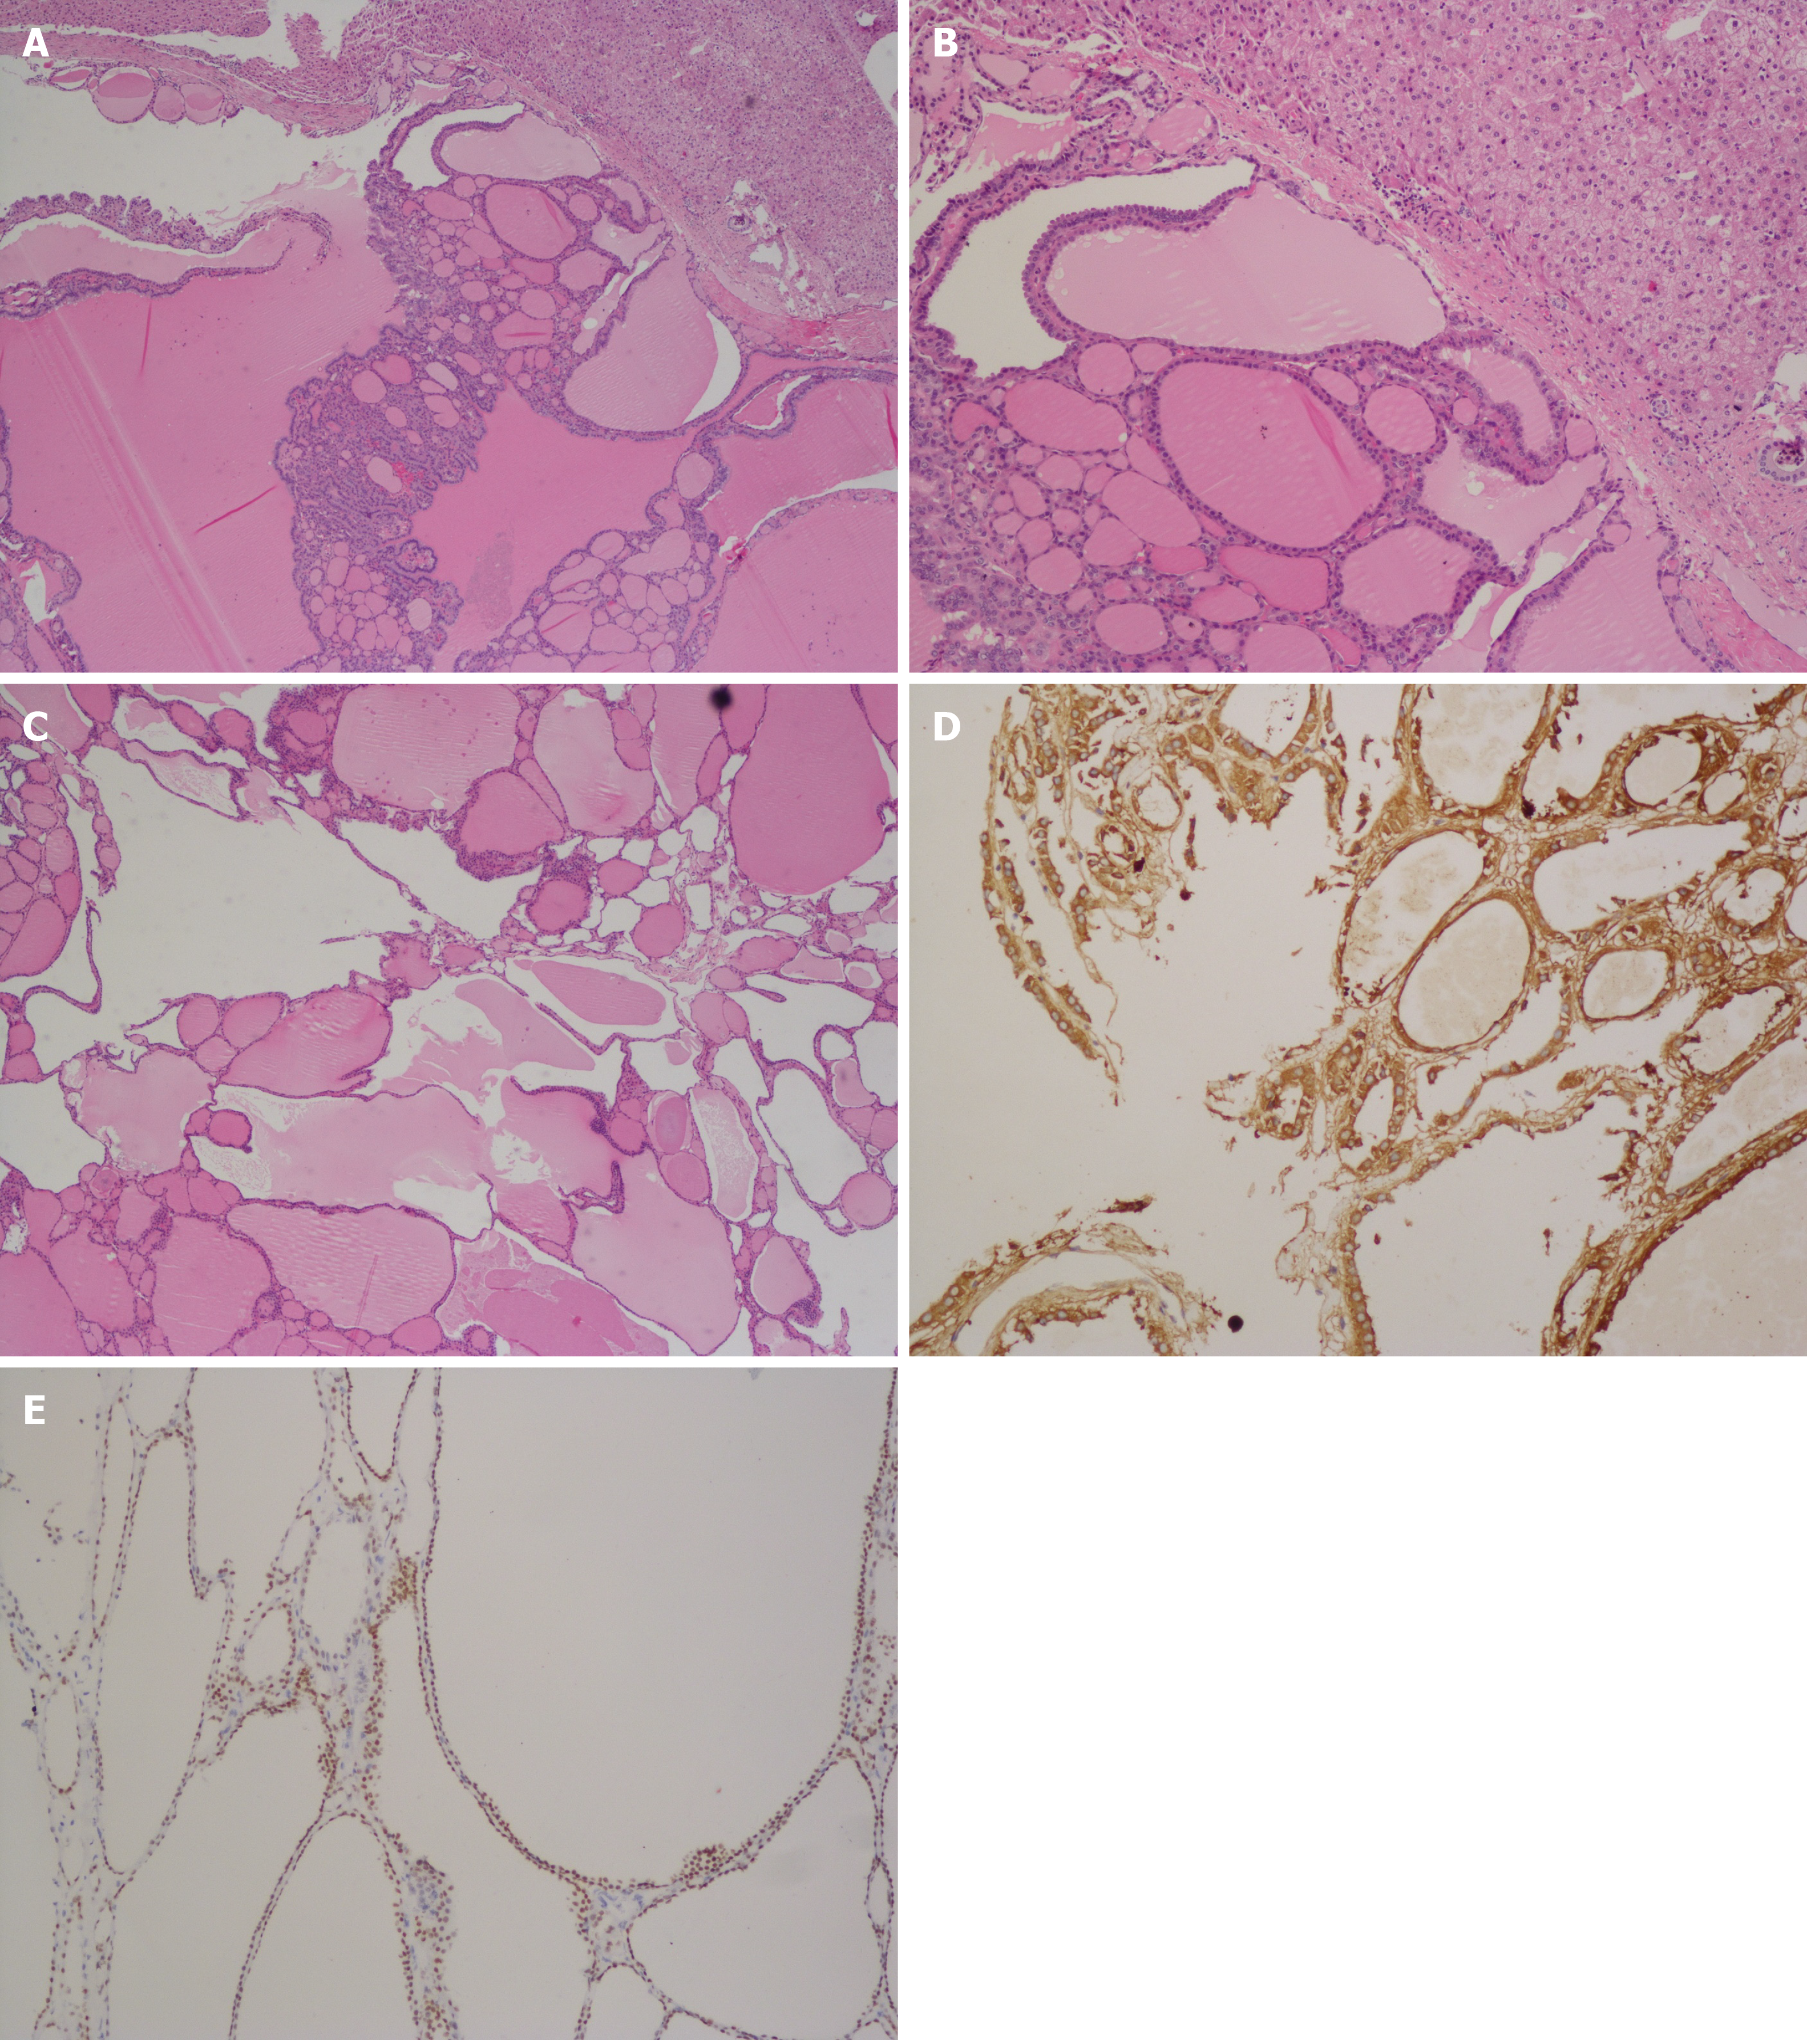
Figure 1 Histopathology examination.
A: Hematoxylin-eosin (H&E) staining revealed ectopic thyroid tissue within the liver tissue. Normal liver tissue was seen at the top section of the microphotograph (40 × magnification); B: H&E staining showing ectopic thyroid tissue within the liver with follicles of varying size with liver tissue in the upper top section (100 × magnification); C: H&E staining showing thyroid nodule hypertrophy with follicles of varying size (400 × magnification); D: Confirmation of thyroid tissue by immunoreactivity for thyroglobulin (400 × magnification); E: Confirmation of thyroid tissue by immunoreactivity for thyroid transcription factor 1 (400 × magnification).
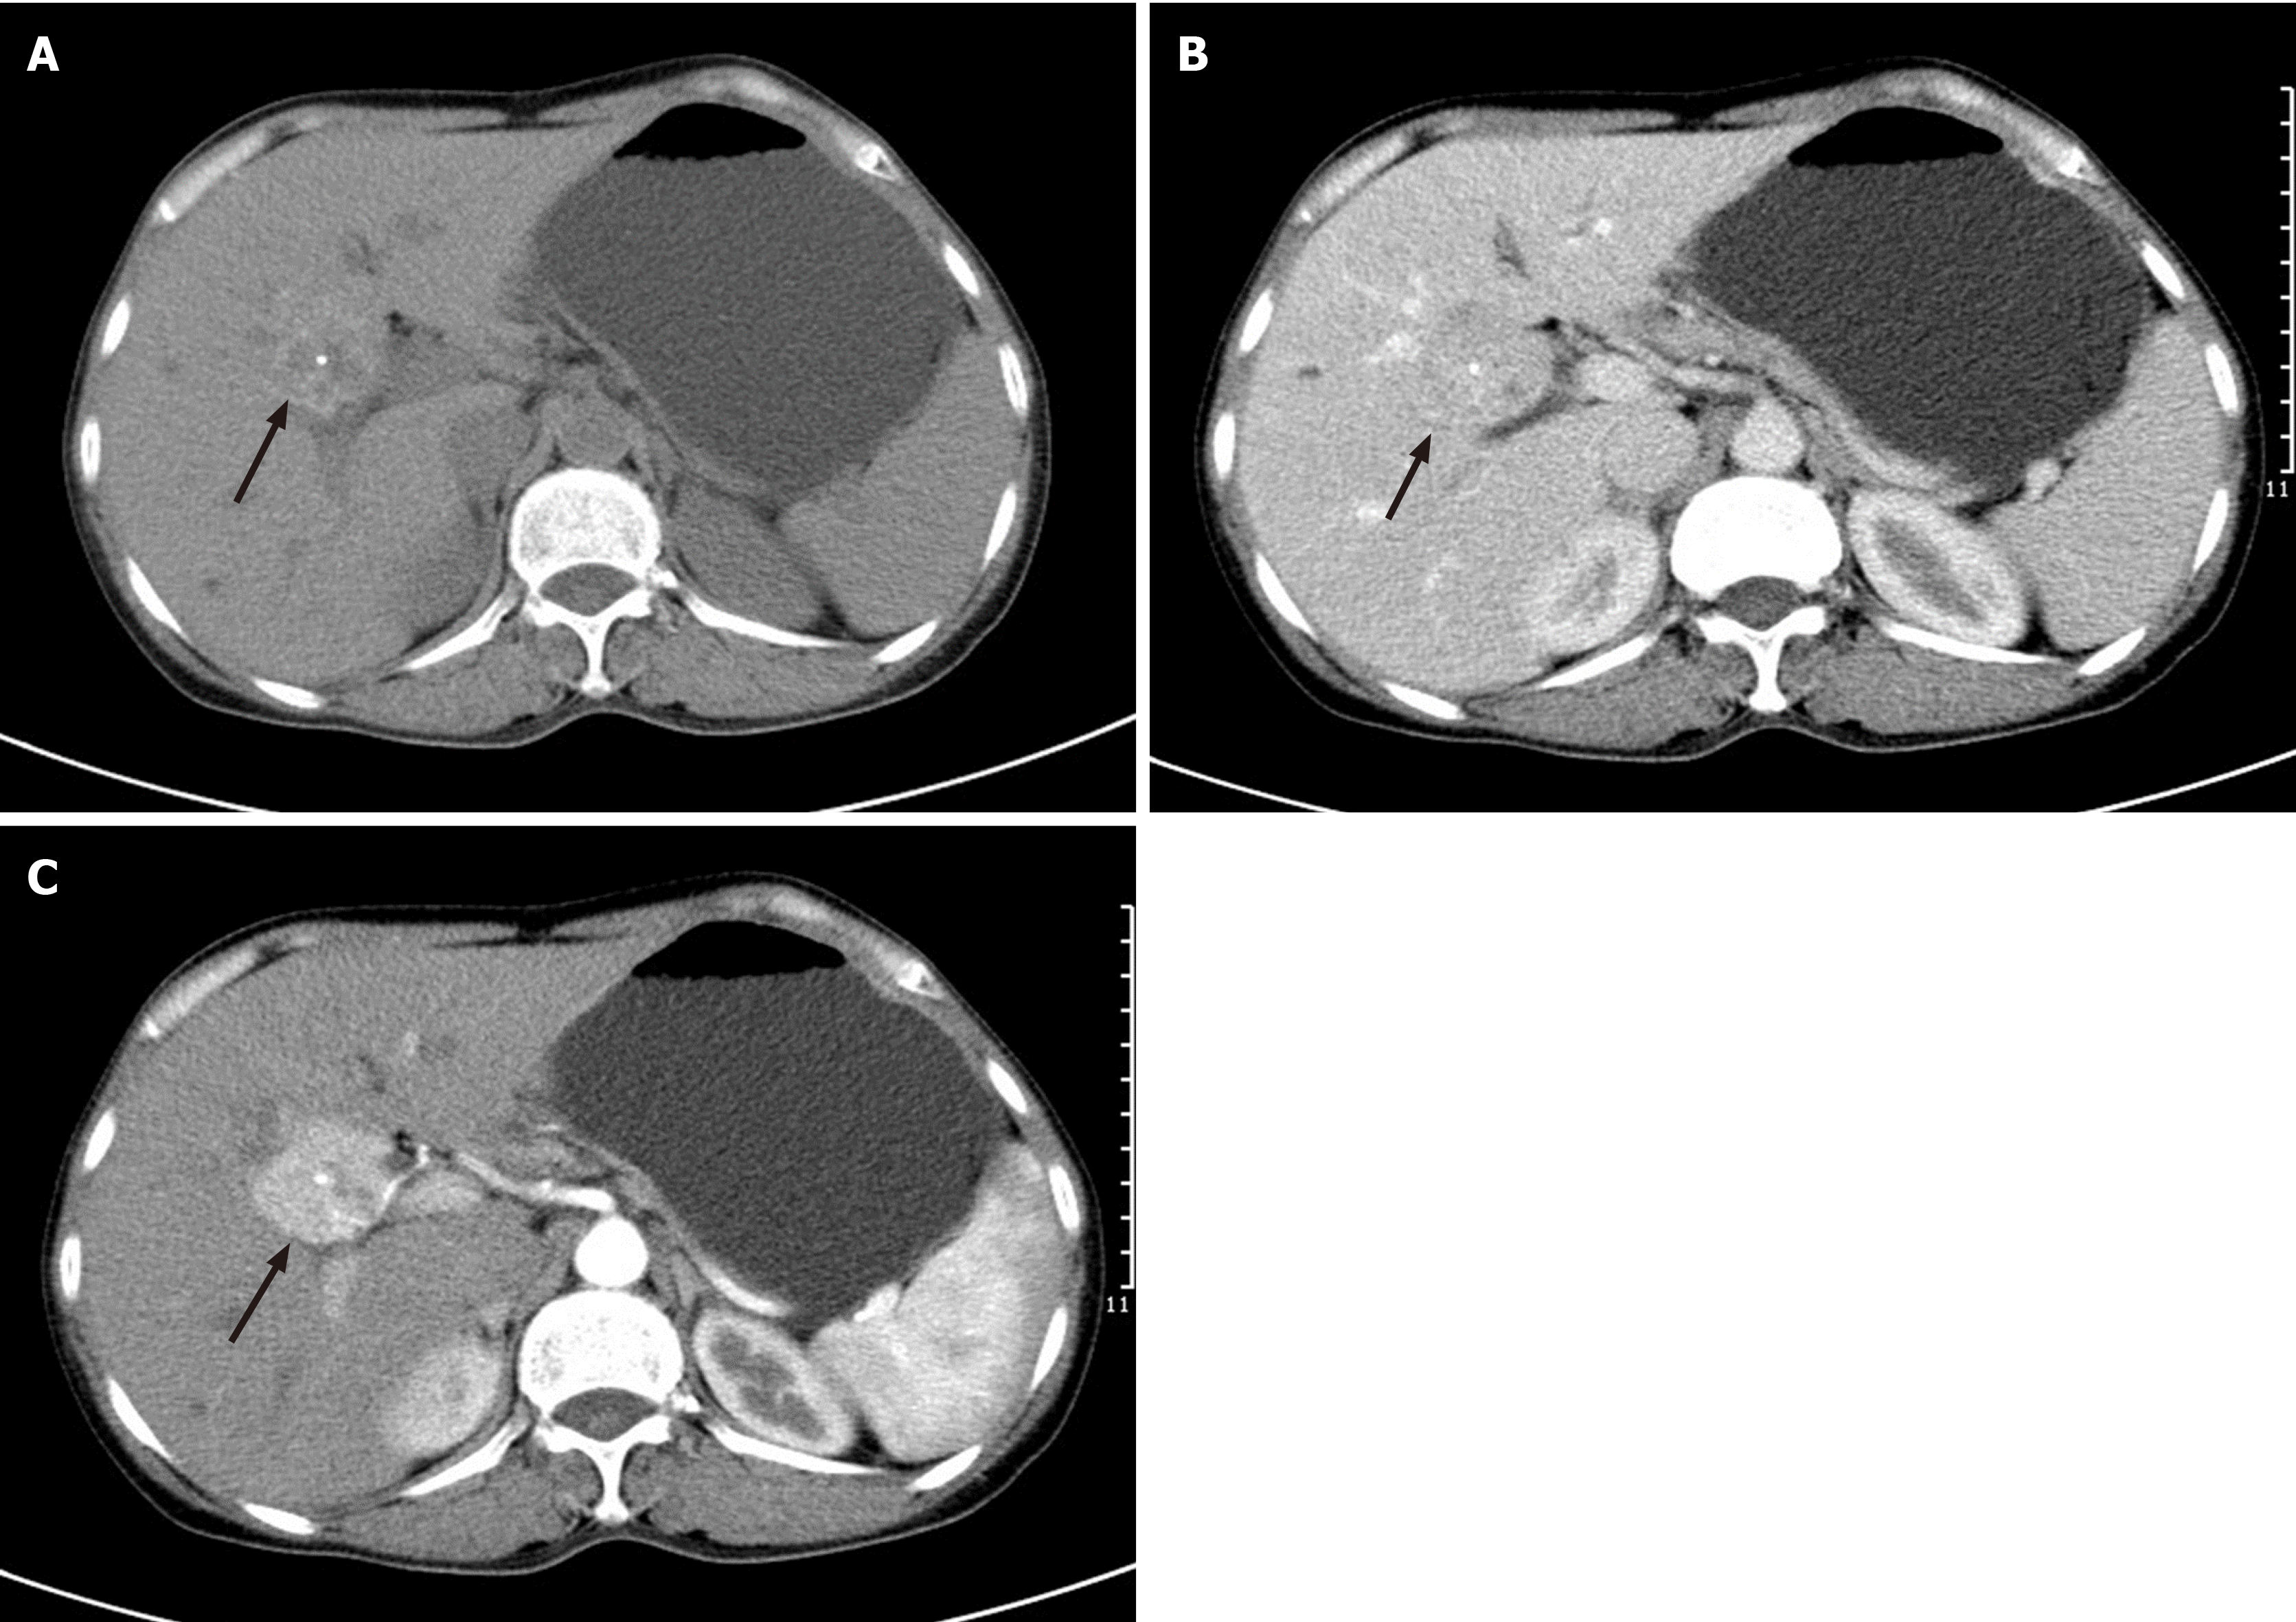
Figure 2 Abdominal axial computed tomography scan findings.
A: Non-enhanced computed tomography (CT) showed a heterogeneous and well-circumscribed and high-density mass with calcification (black arrow); B and C: Contrast-enhanced CT showed a group of high density nodules with exhibition of well-defined borders in the hepatic entrance with calcification (black arrow) and an expansive size of 43 mm × 38 mm, as well as an intensely enhancing mass in the arterial phase with decreasing intensity in the venous phase.
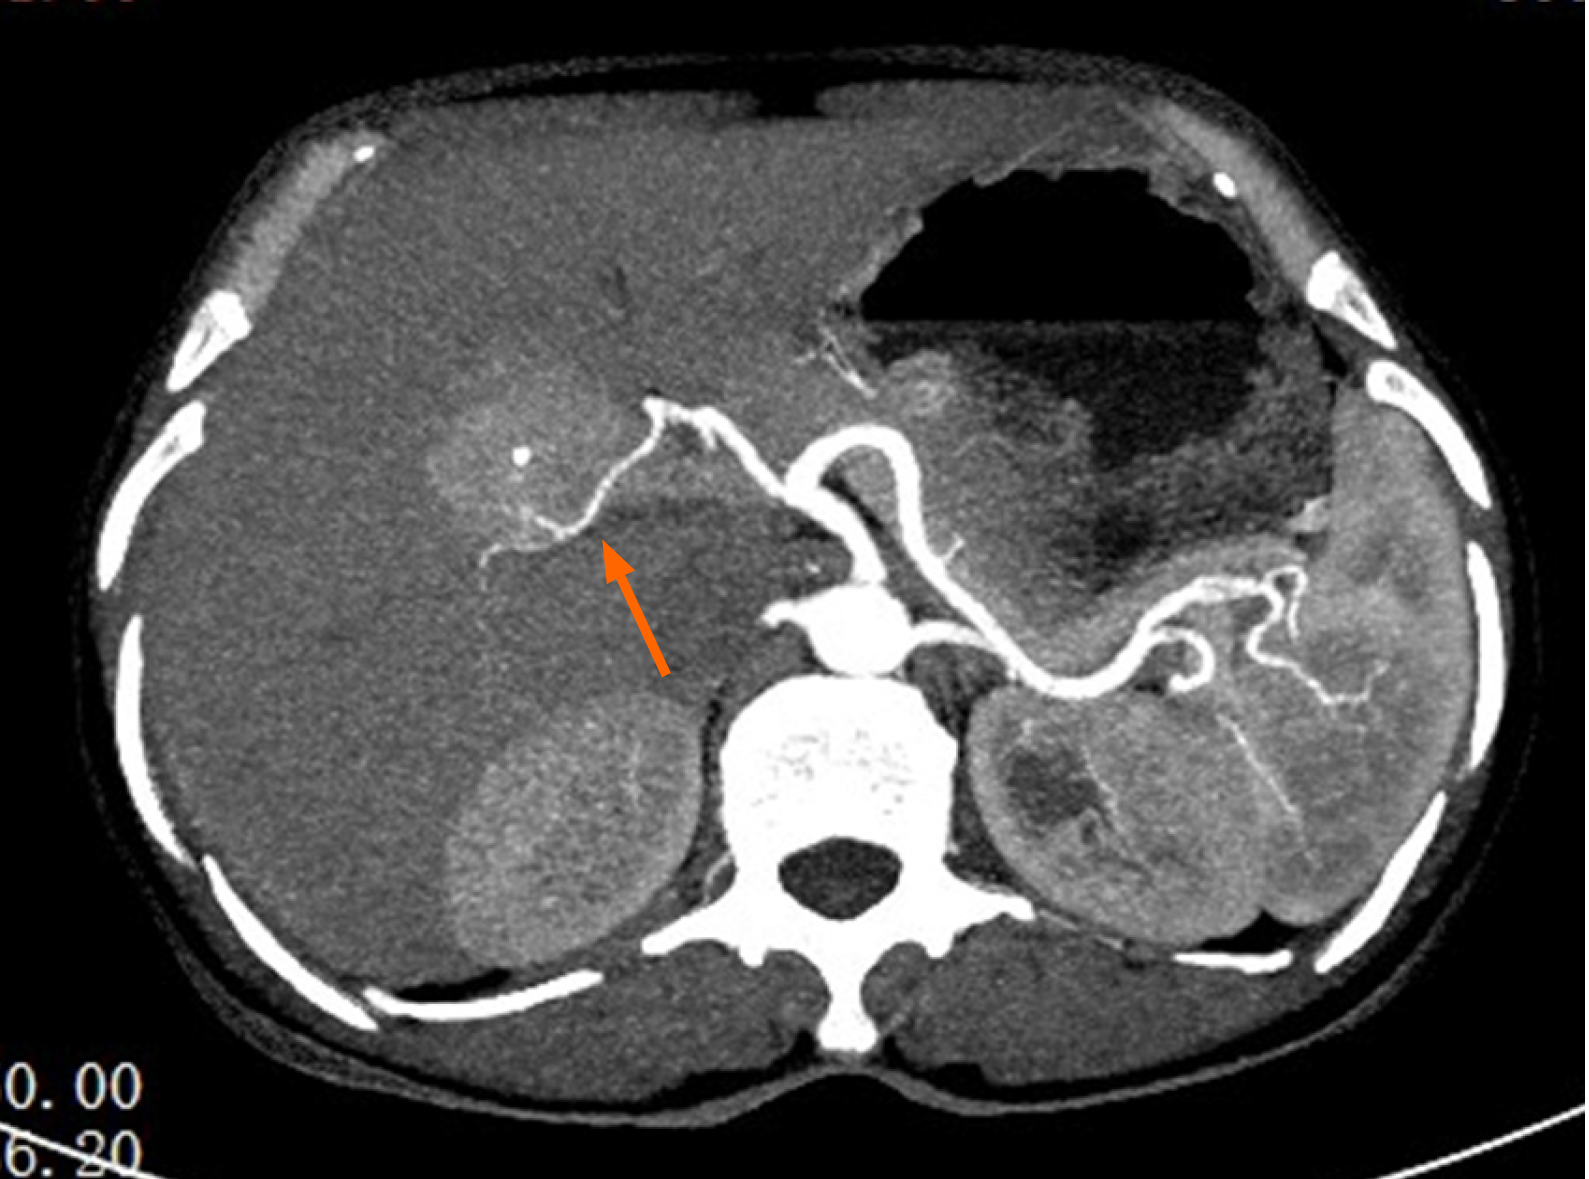
Figure 3 Axial computed tomography angiography findings.
Widened image thickness construct in arterial phase depicting the right hepatic artery supplying the lesion (orange arrow).
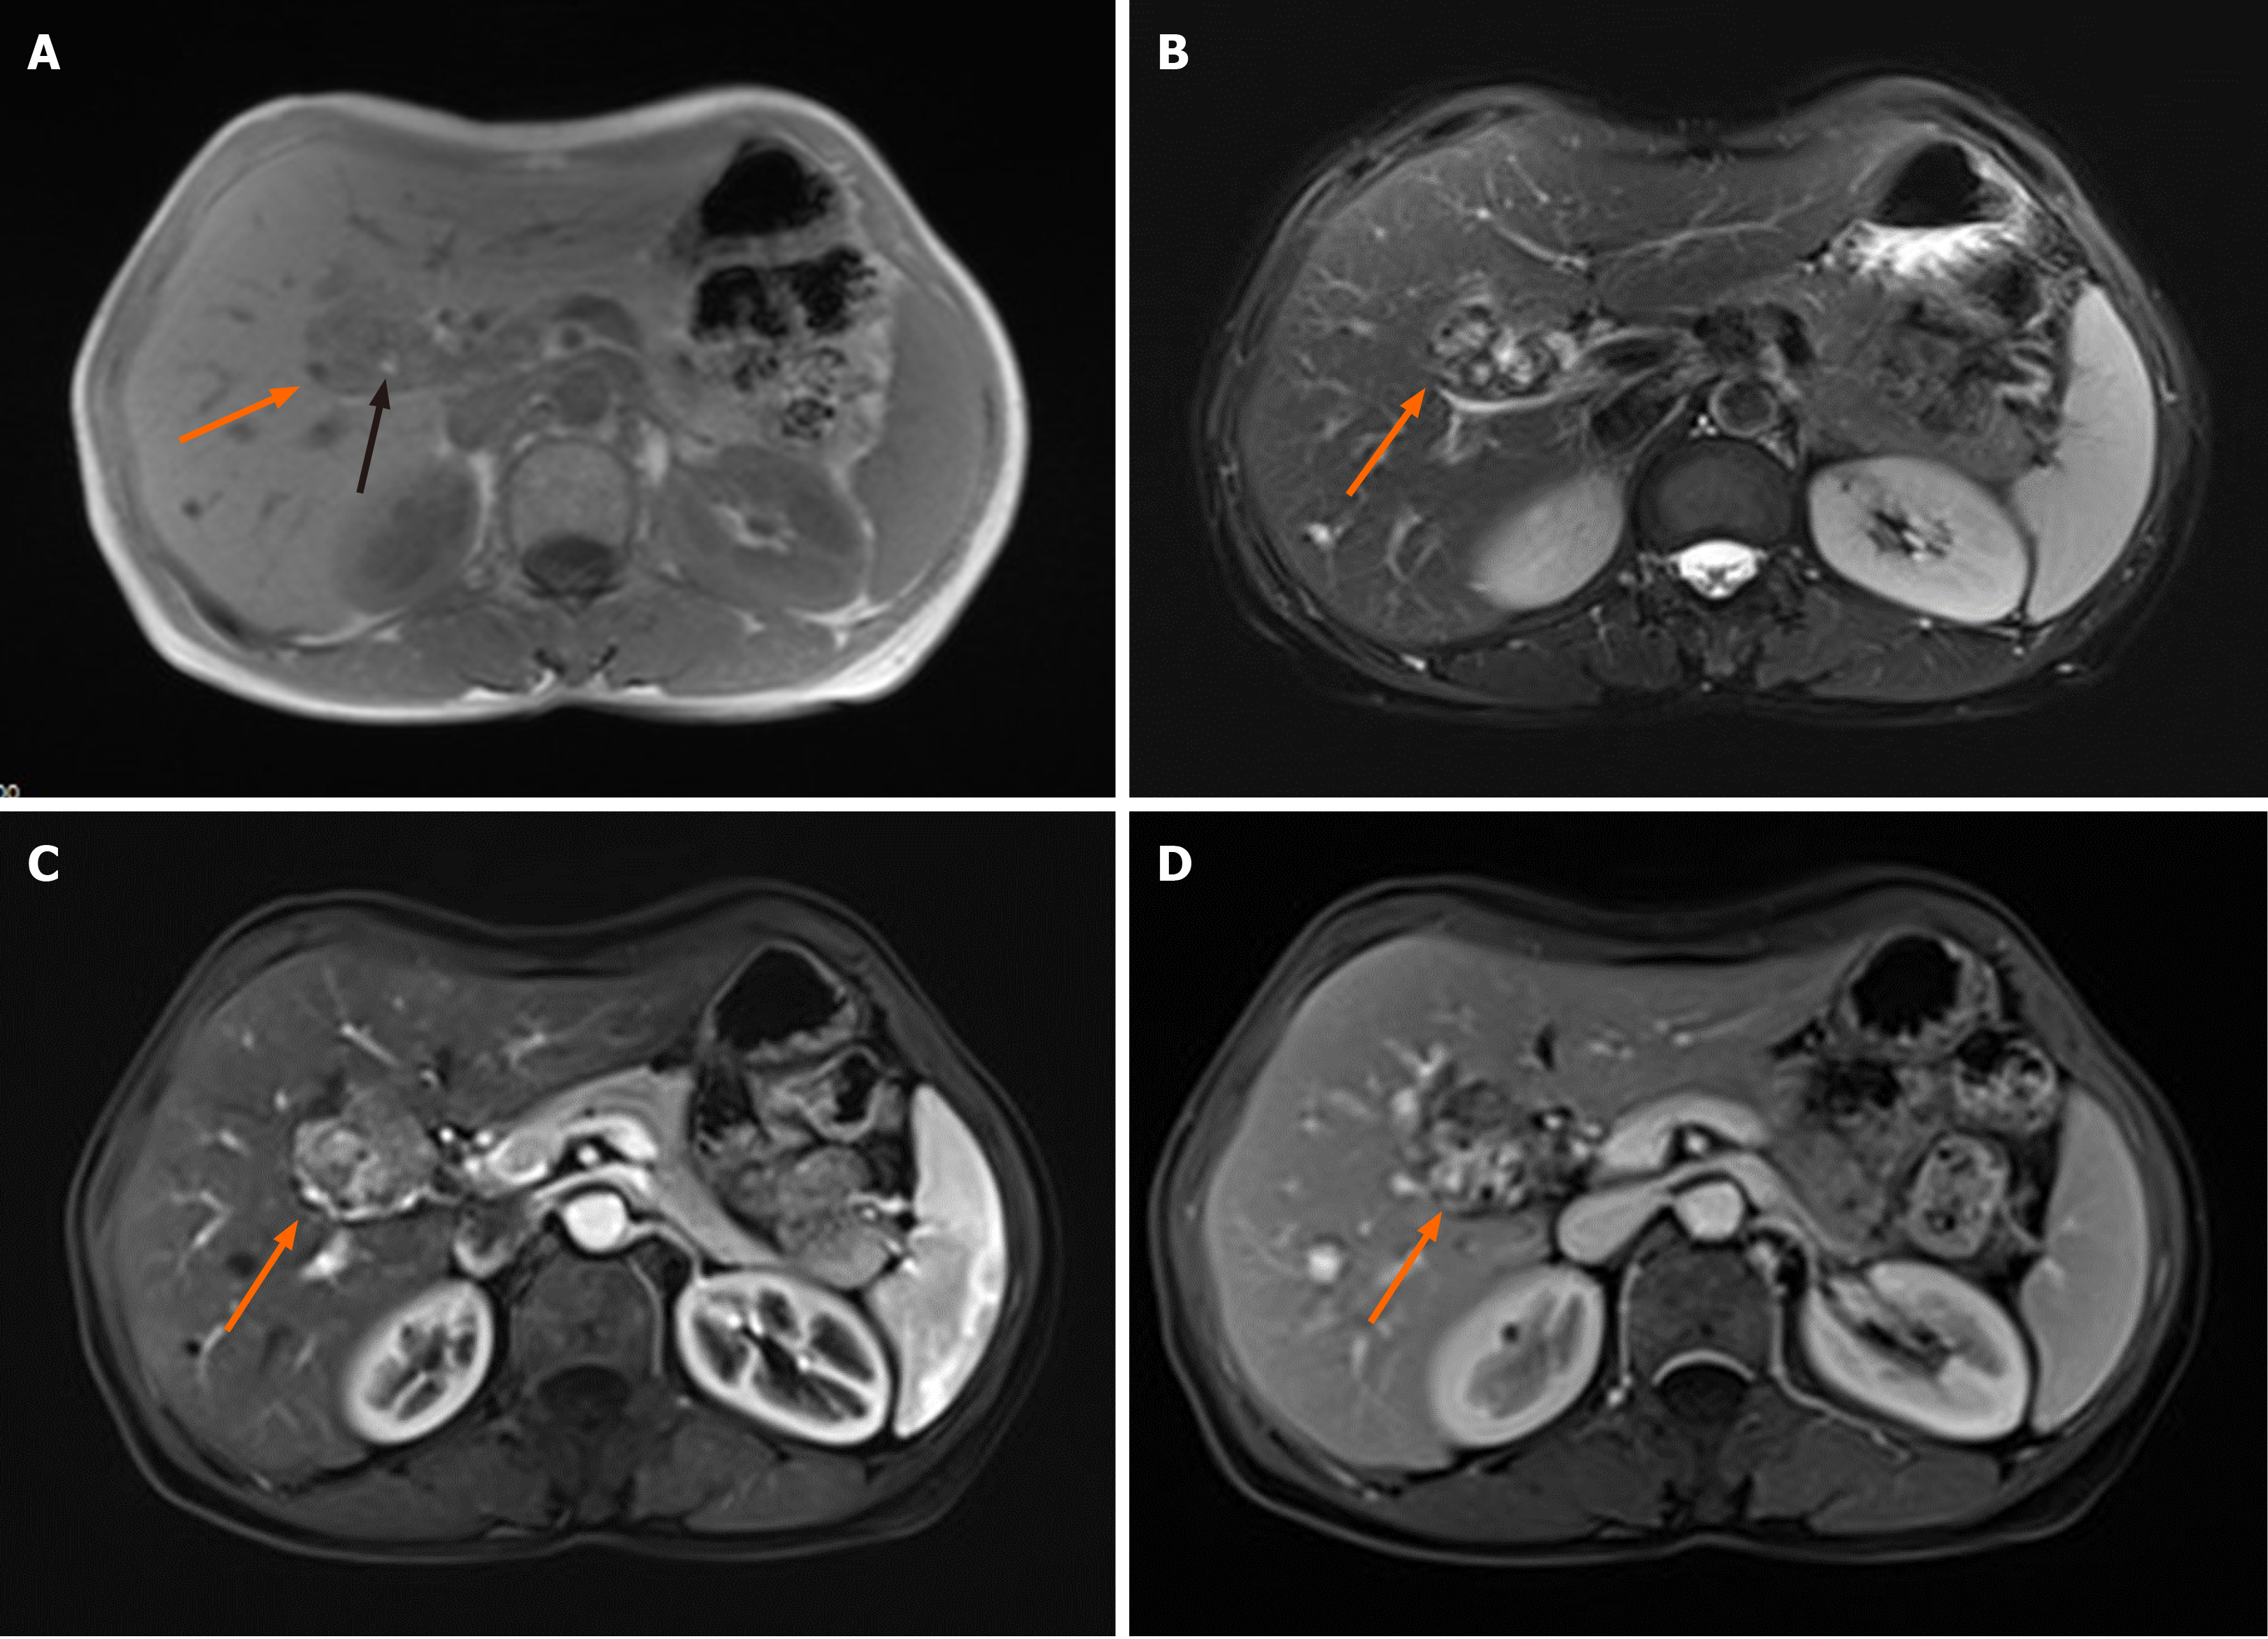
Figure 4 Axial magnetic resonance imaging findings.
A: In-phase T1-weighted imaging showing a low signal intensity well-circumscribed lesion in the portal entrance (orange arrow) with a high signal intensity spot (black arrow); B: T2-weighted imaging; C: Arterial phase of contrast-enhanced magnetic resonance imaging (DCE-MRI); D: Hepatic phase of DCE-MRI depicting mixed signal intensity (orange arrows).
- Citation: Chooah O, Ding J, Fei JL, Xu FY, Yue T, Pu CL, Hu HJ. Radiological insights of ectopic thyroid in the porta hepatis: A case report and review of the literature. World J Clin Cases 2021; 9(14): 3432-3441
- URL: https://www.wjgnet.com/2307-8960/full/v9/i14/3432.htm
- DOI: https://dx.doi.org/10.12998/wjcc.v9.i14.3432


