Copyright
©The Author(s) 2021.
World J Clin Cases. Apr 26, 2021; 9(12): 2908-2915
Published online Apr 26, 2021. doi: 10.12998/wjcc.v9.i12.2908
Published online Apr 26, 2021. doi: 10.12998/wjcc.v9.i12.2908
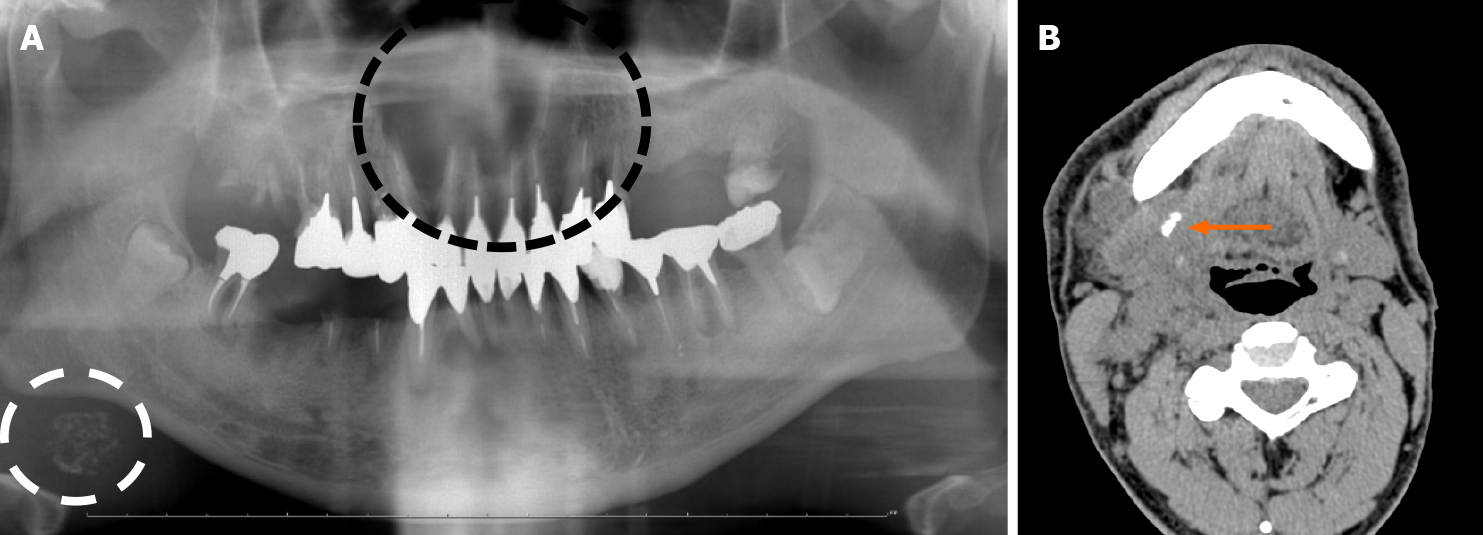
Figure 1 Radiographic imaging at the initial visit.
A: Panoramic radiographic image at the initial visit. Panoramic radiograph revealed radiolucent lesion from the left maxillary lateral incisor to the right maxillary second premolar (the black dotted line); an oval radiopaque lesion similar to sialolithiasis (the white dotted line) was also observed under the right side of the mandible; B: Non-contrast computed tomography (submandibular region). A calcified body was found near the opening of the submandibular gland (the orange arrow). Swollen cervical lymph nodes and a mass in the submandibular gland were also observed.
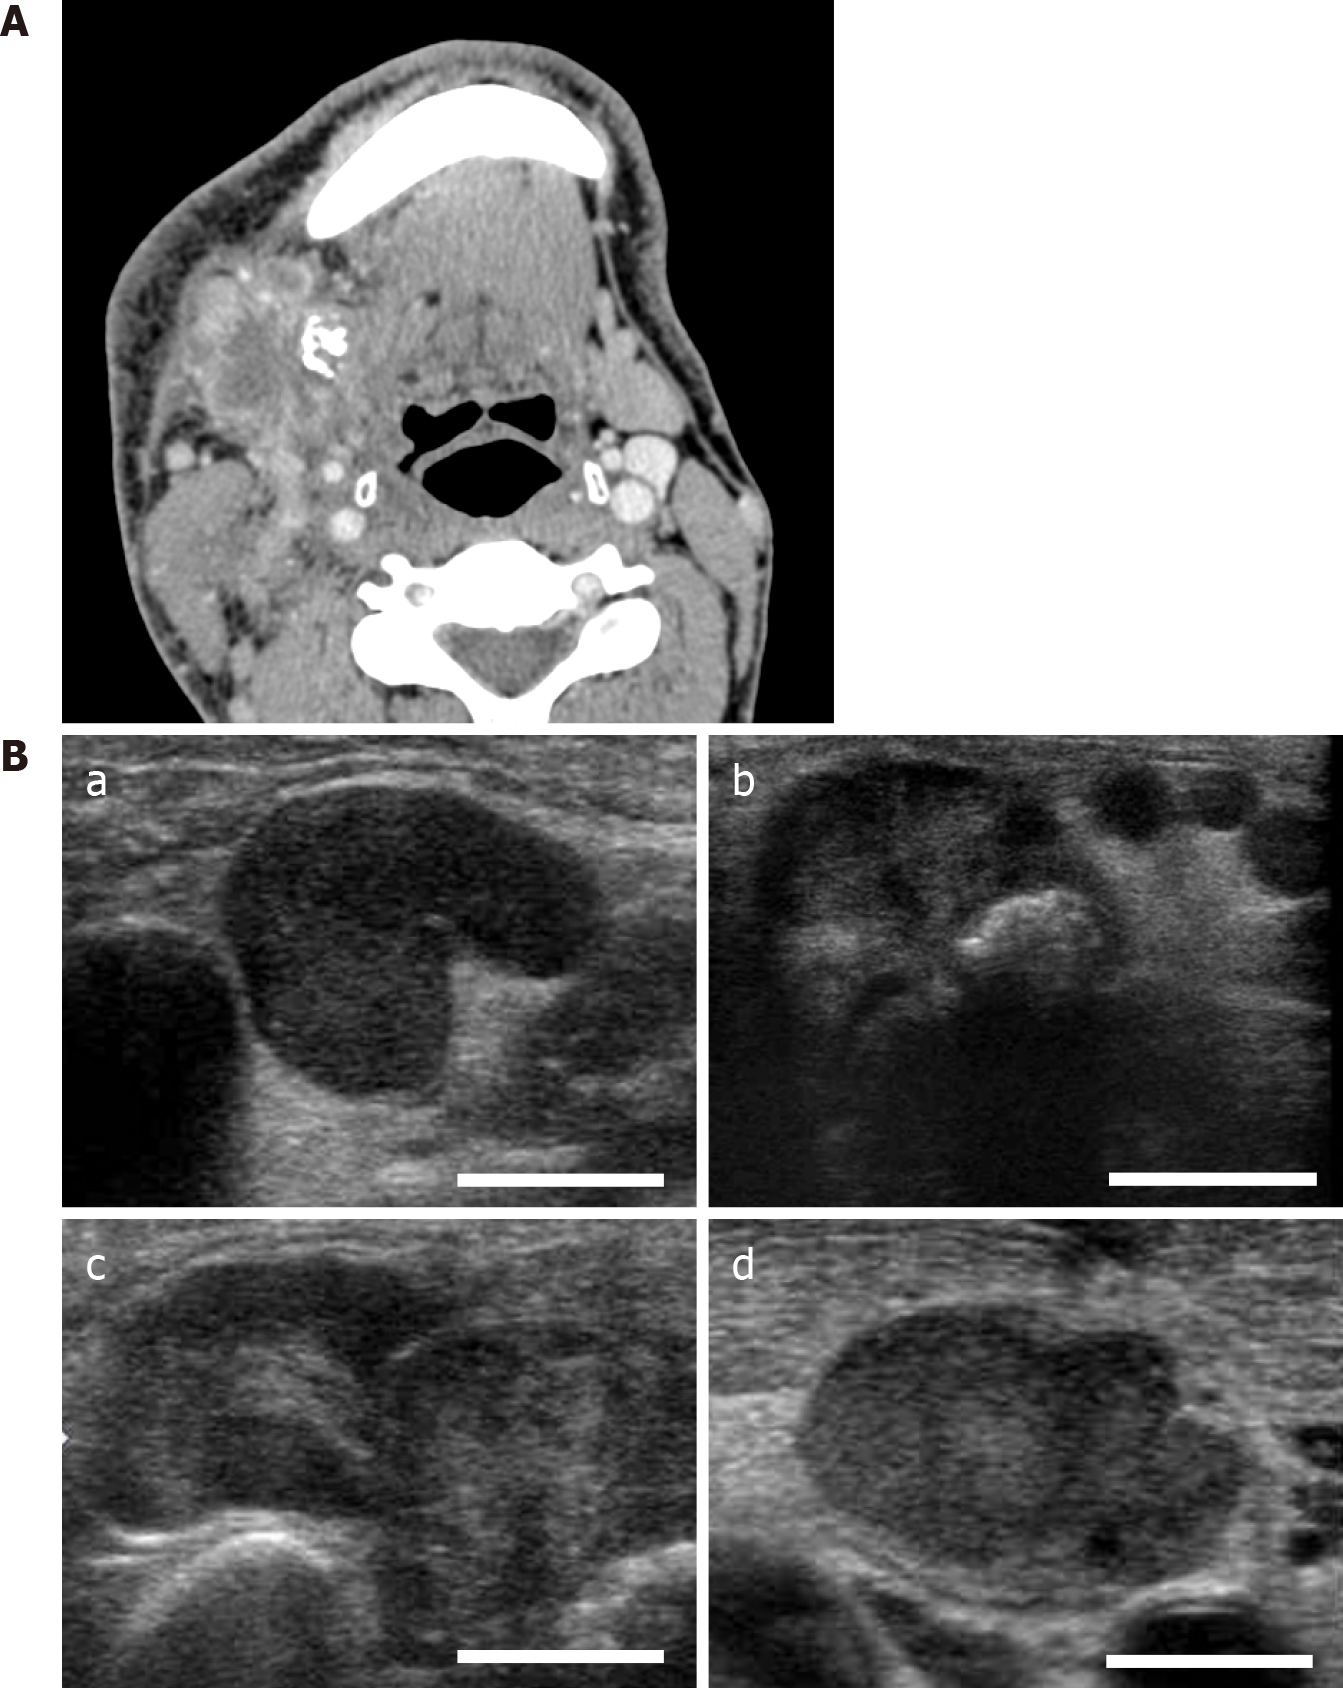
Figure 2 Contrast-enhanced computed tomographic and ultrasonographic imaging.
A: Contrast-enhanced computed tomography. Multiple cervical lymph nodes show a similar pattern, a center of low attenuation with an enhancing rim representing the central area of necrosis; furthermore, some of them displayed a tendency to fusion. A calcified body was located near these lymph nodes; B: Ultrasonography. The presence of a central echogenic hilus in the enlarged nodes keeping the oval shape and the absence of a peripheral halo (a), calcified body in the submandibular gland (b), fusion tendency of adjacent lymph nodes showing relatively strong internal echo within the mass (c), and homogeneous internal echo within the mass (d).
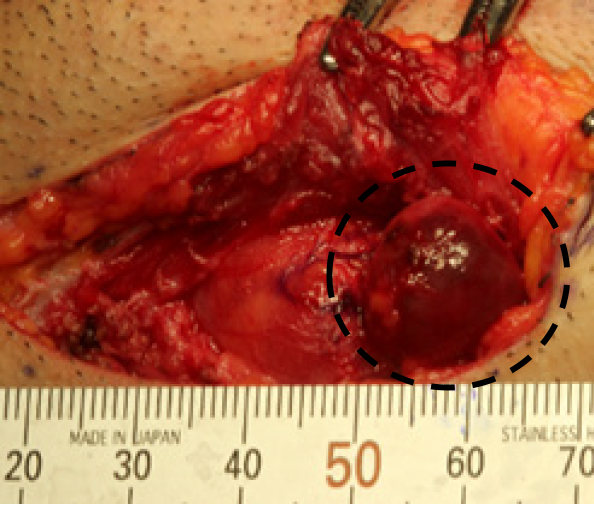
Figure 3 Biopsy findings.
Open biopsy at the submandibular region. The region inside the platysma muscle is indicated by black dotted line showing the lymph node lesion.
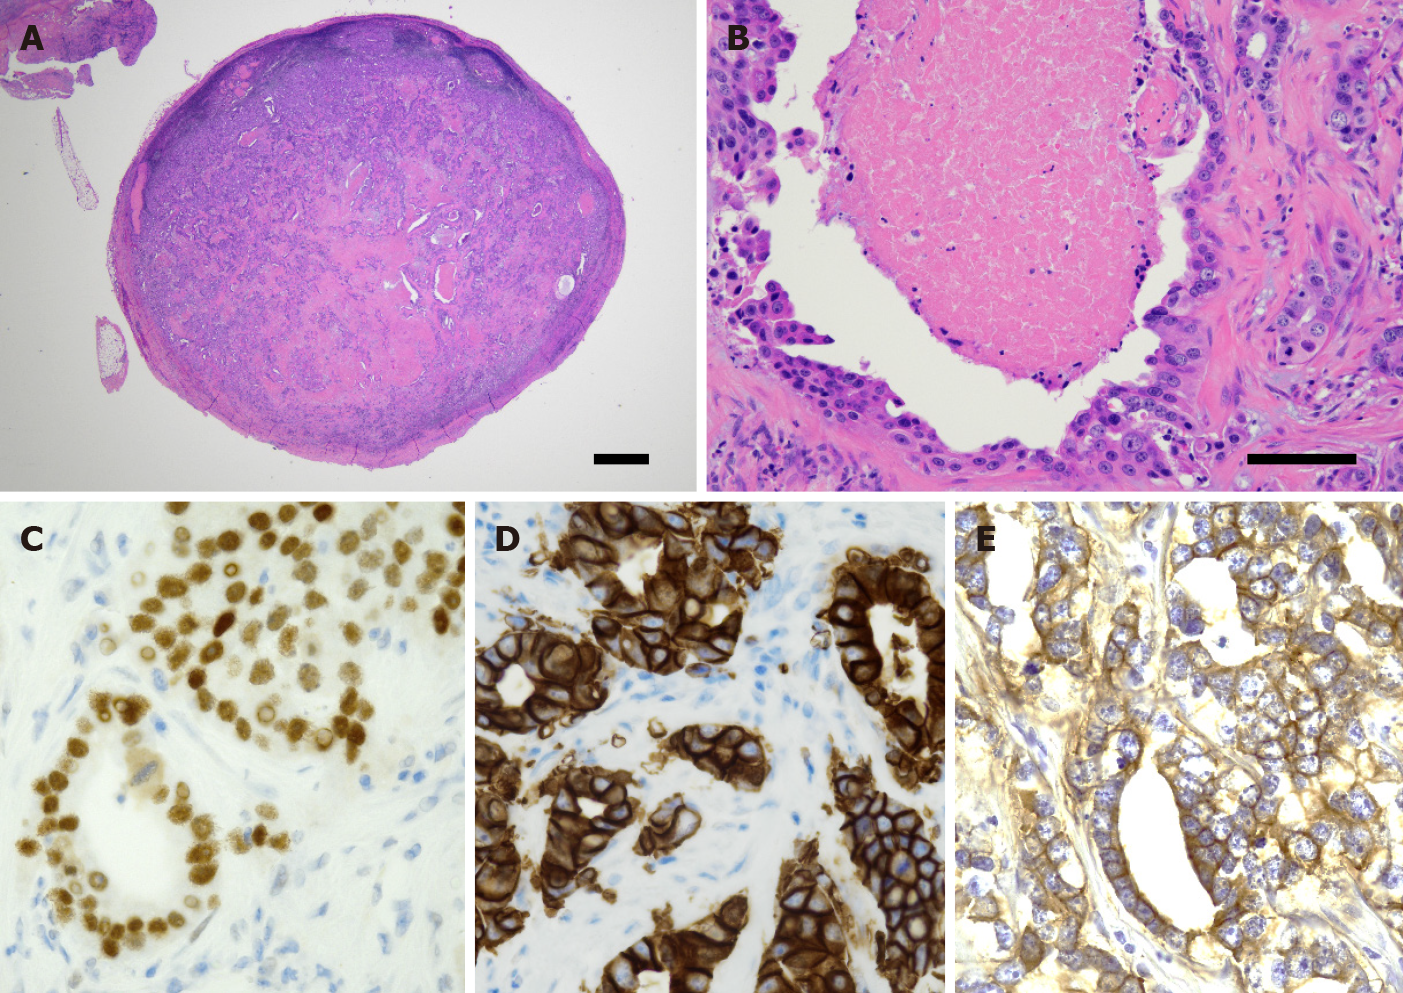
Figure 4 Histological analyses.
A and B: Biopsy of the lesion composed of atypical epithelioid cells within fibrous tissue. A nuclear pleomorphism and occasional mitoses are also noted. Scale bars represent 1000 μm (A) and 100 μm (B), respectively; C-E: Immunohistochemical staining for androgen receptor (C), human epidermal growth factor receptor 2 (D), and epithelial growth factor receptor (E).
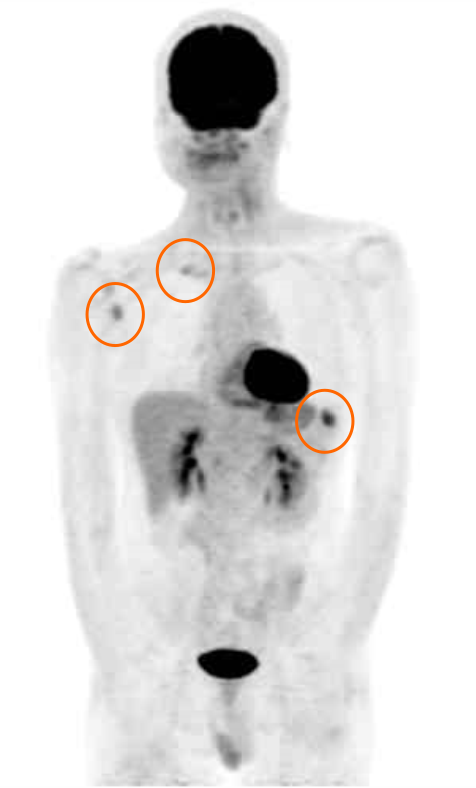
Figure 5 Positron emission tomography-computed tomography findings.
18F-fluorodeoxyglucose positron emission tomography–computed tomography after primary treatment. Distant bone metastases (three sites) were found.
- Citation: Uchihashi T, Kodama S, Sugauchi A, Hiraoka S, Hirose K, Usami Y, Tanaka S, Kogo M. Salivary duct carcinoma of the submandibular gland presenting a diagnostic challenge: A case report. World J Clin Cases 2021; 9(12): 2908-2915
- URL: https://www.wjgnet.com/2307-8960/full/v9/i12/2908.htm
- DOI: https://dx.doi.org/10.12998/wjcc.v9.i12.2908


