Copyright
©The Author(s) 2021.
World J Clin Cases. Apr 16, 2021; 9(11): 2503-2518
Published online Apr 16, 2021. doi: 10.12998/wjcc.v9.i11.2503
Published online Apr 16, 2021. doi: 10.12998/wjcc.v9.i11.2503
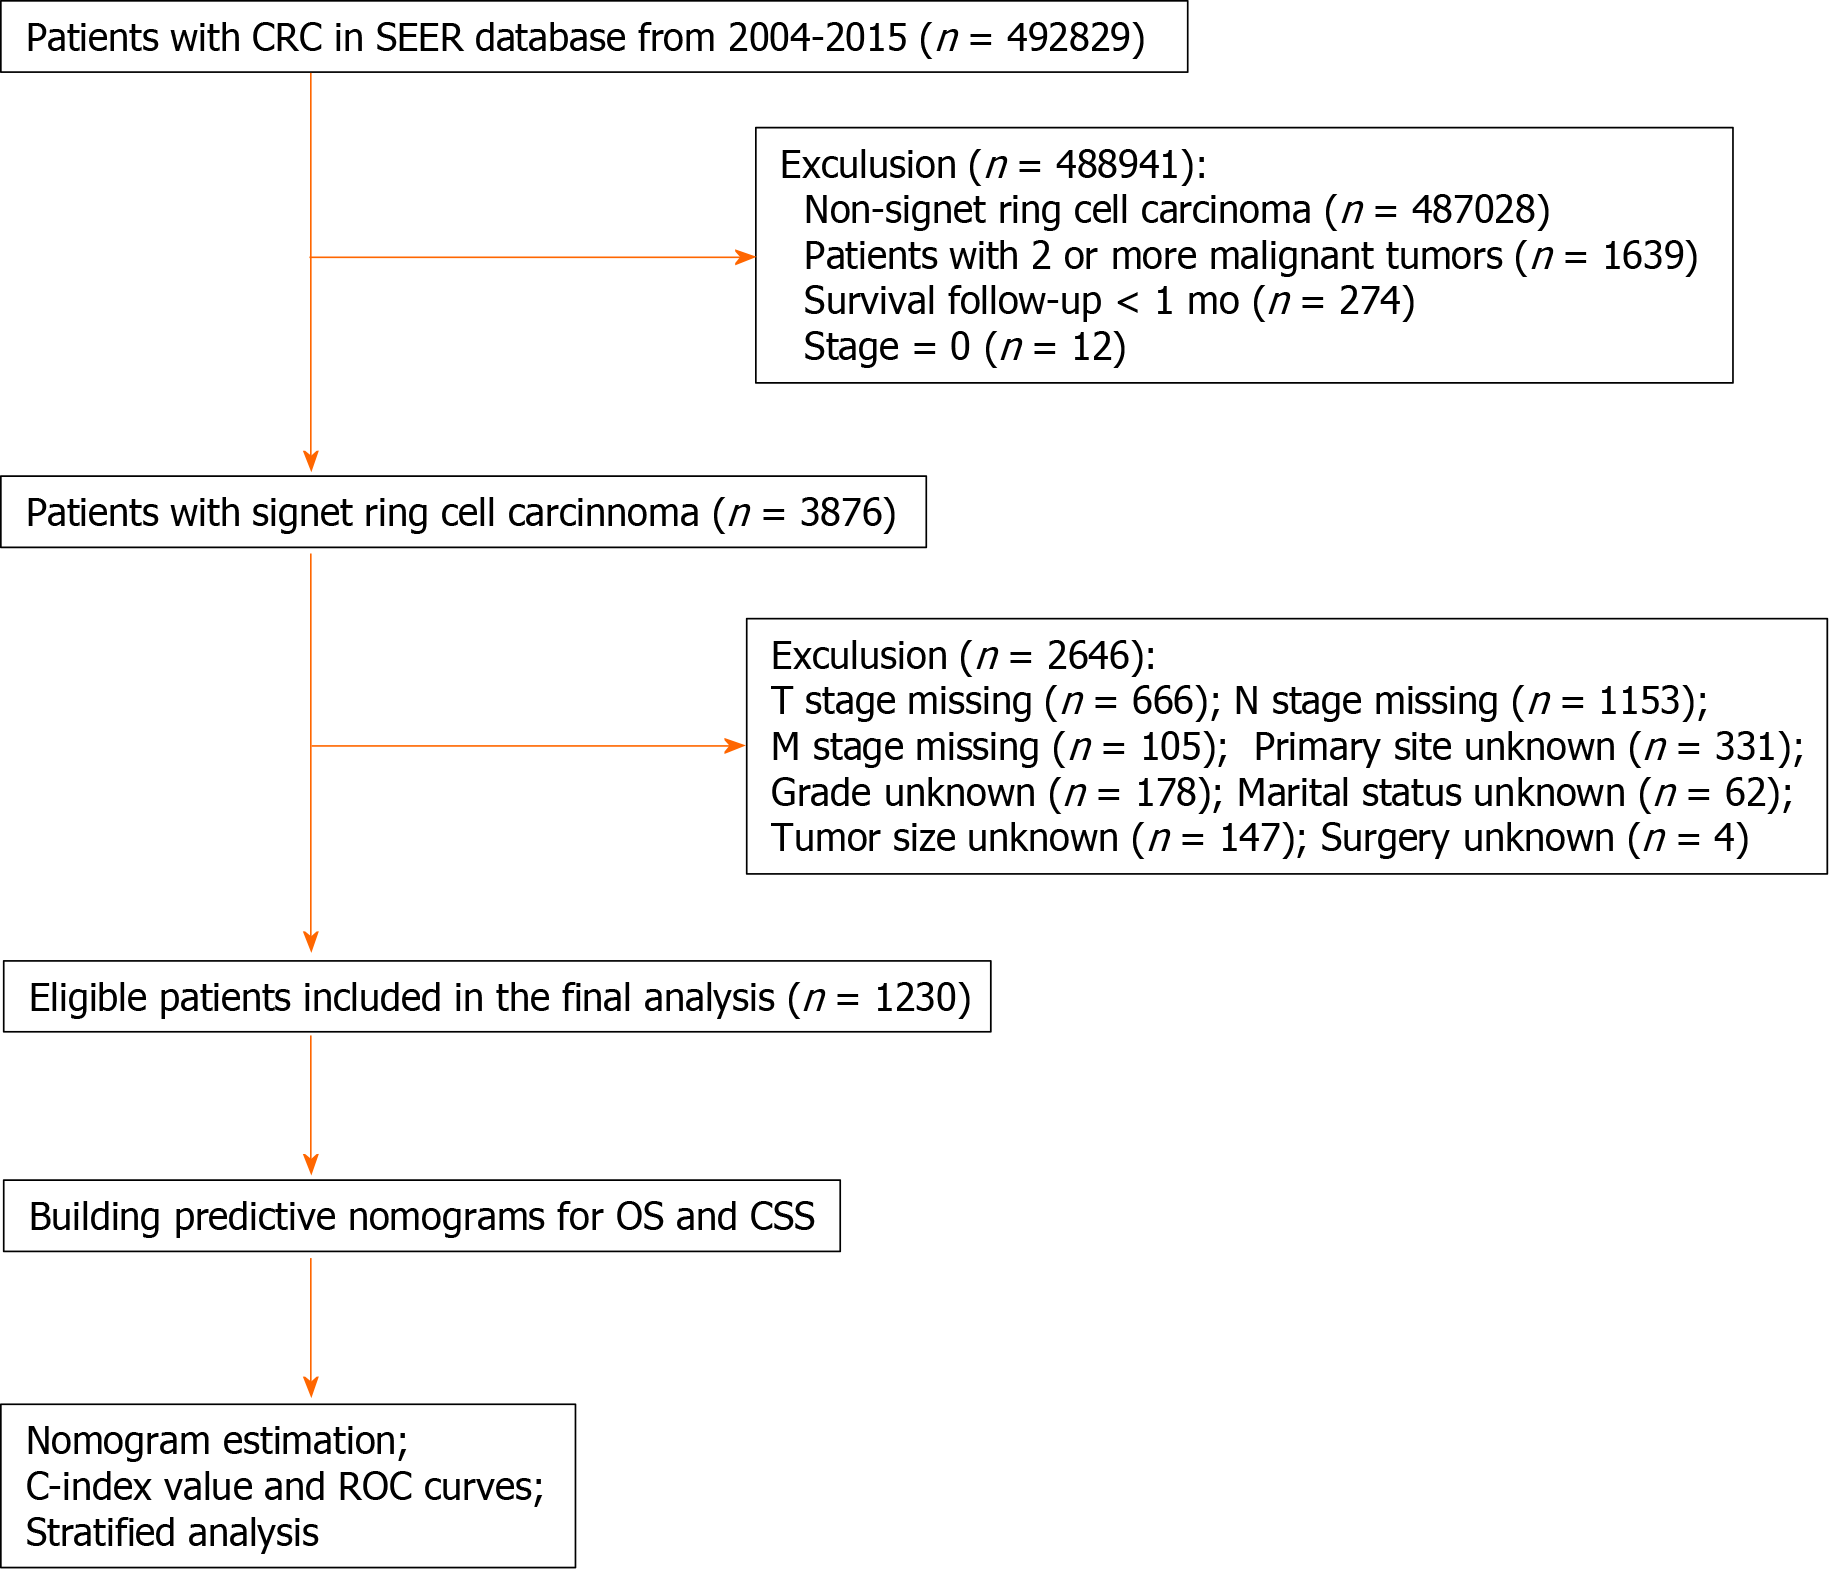
Figure 1 Workflow of patient selection and establishment of nomograms to predict overall survival and cause-specific survival.
CRC: Colorectal cancer; SEER: Surveillance, Epidemiology, and End Results; TNM: Tumor-node-metastasis; OS: Overall survival; CSS: Cause-specific survival; C-index: Concordance index; ROC: Receiver operating characteristic.
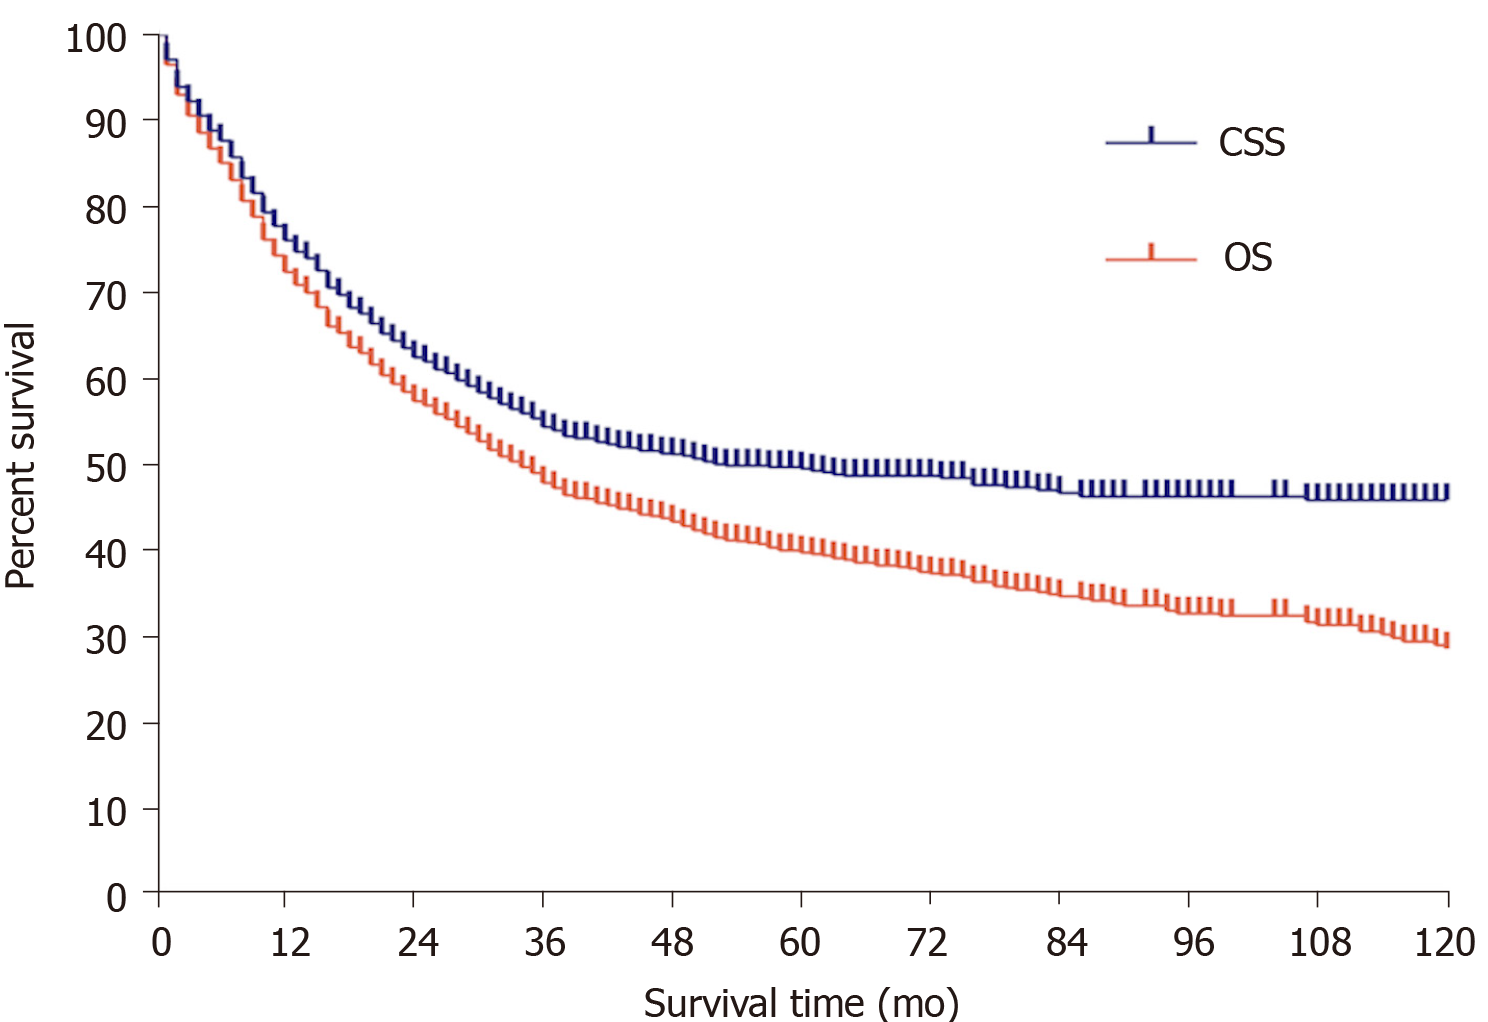
Figure 2 Overall survival and cause-specific survival curves of all patients.
OS: Overall survival; CSS: Cause-specific survival.
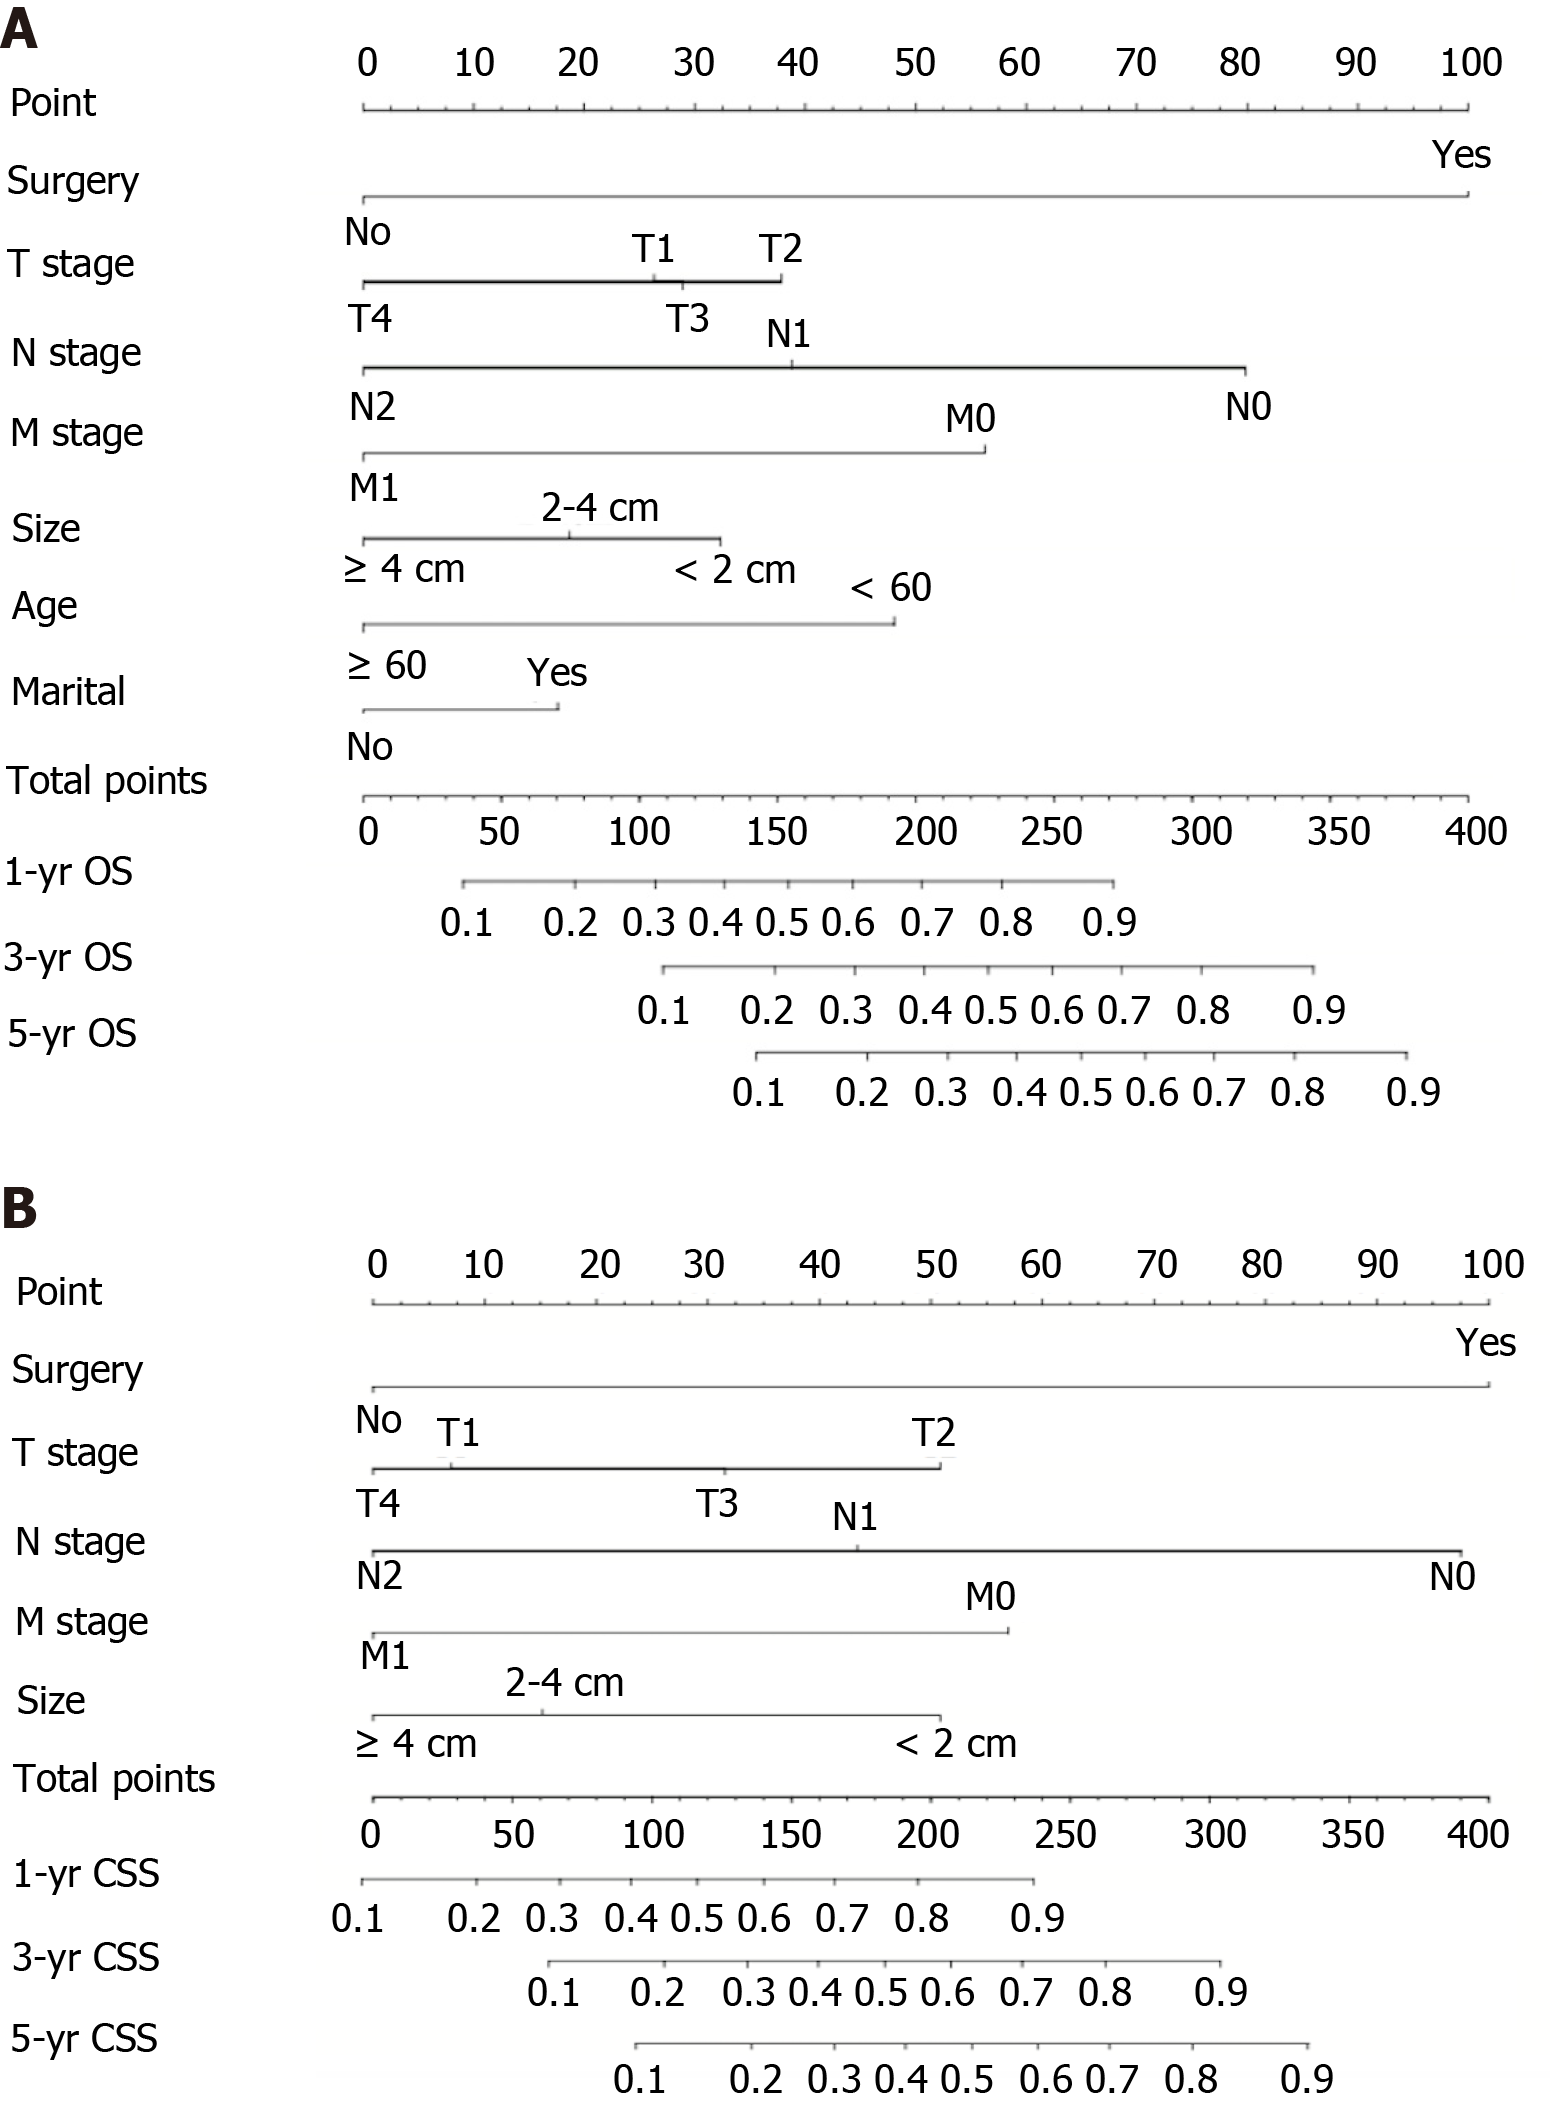
Figure 3 Nomograms for predicting overall survival and cause-specific survival.
A: Nomogram based on the independent prognostic factors for the prediction of 1-, 3-, and 5-yr overall survival rates; B: Nomogram based on the independent prognostic factors for the prediction of 1-, 3-, and 5-yr cause-specific survival rates. OS: Overall survival; CSS: Cause-specific survival; TNM: Tumor-node-metastasis.
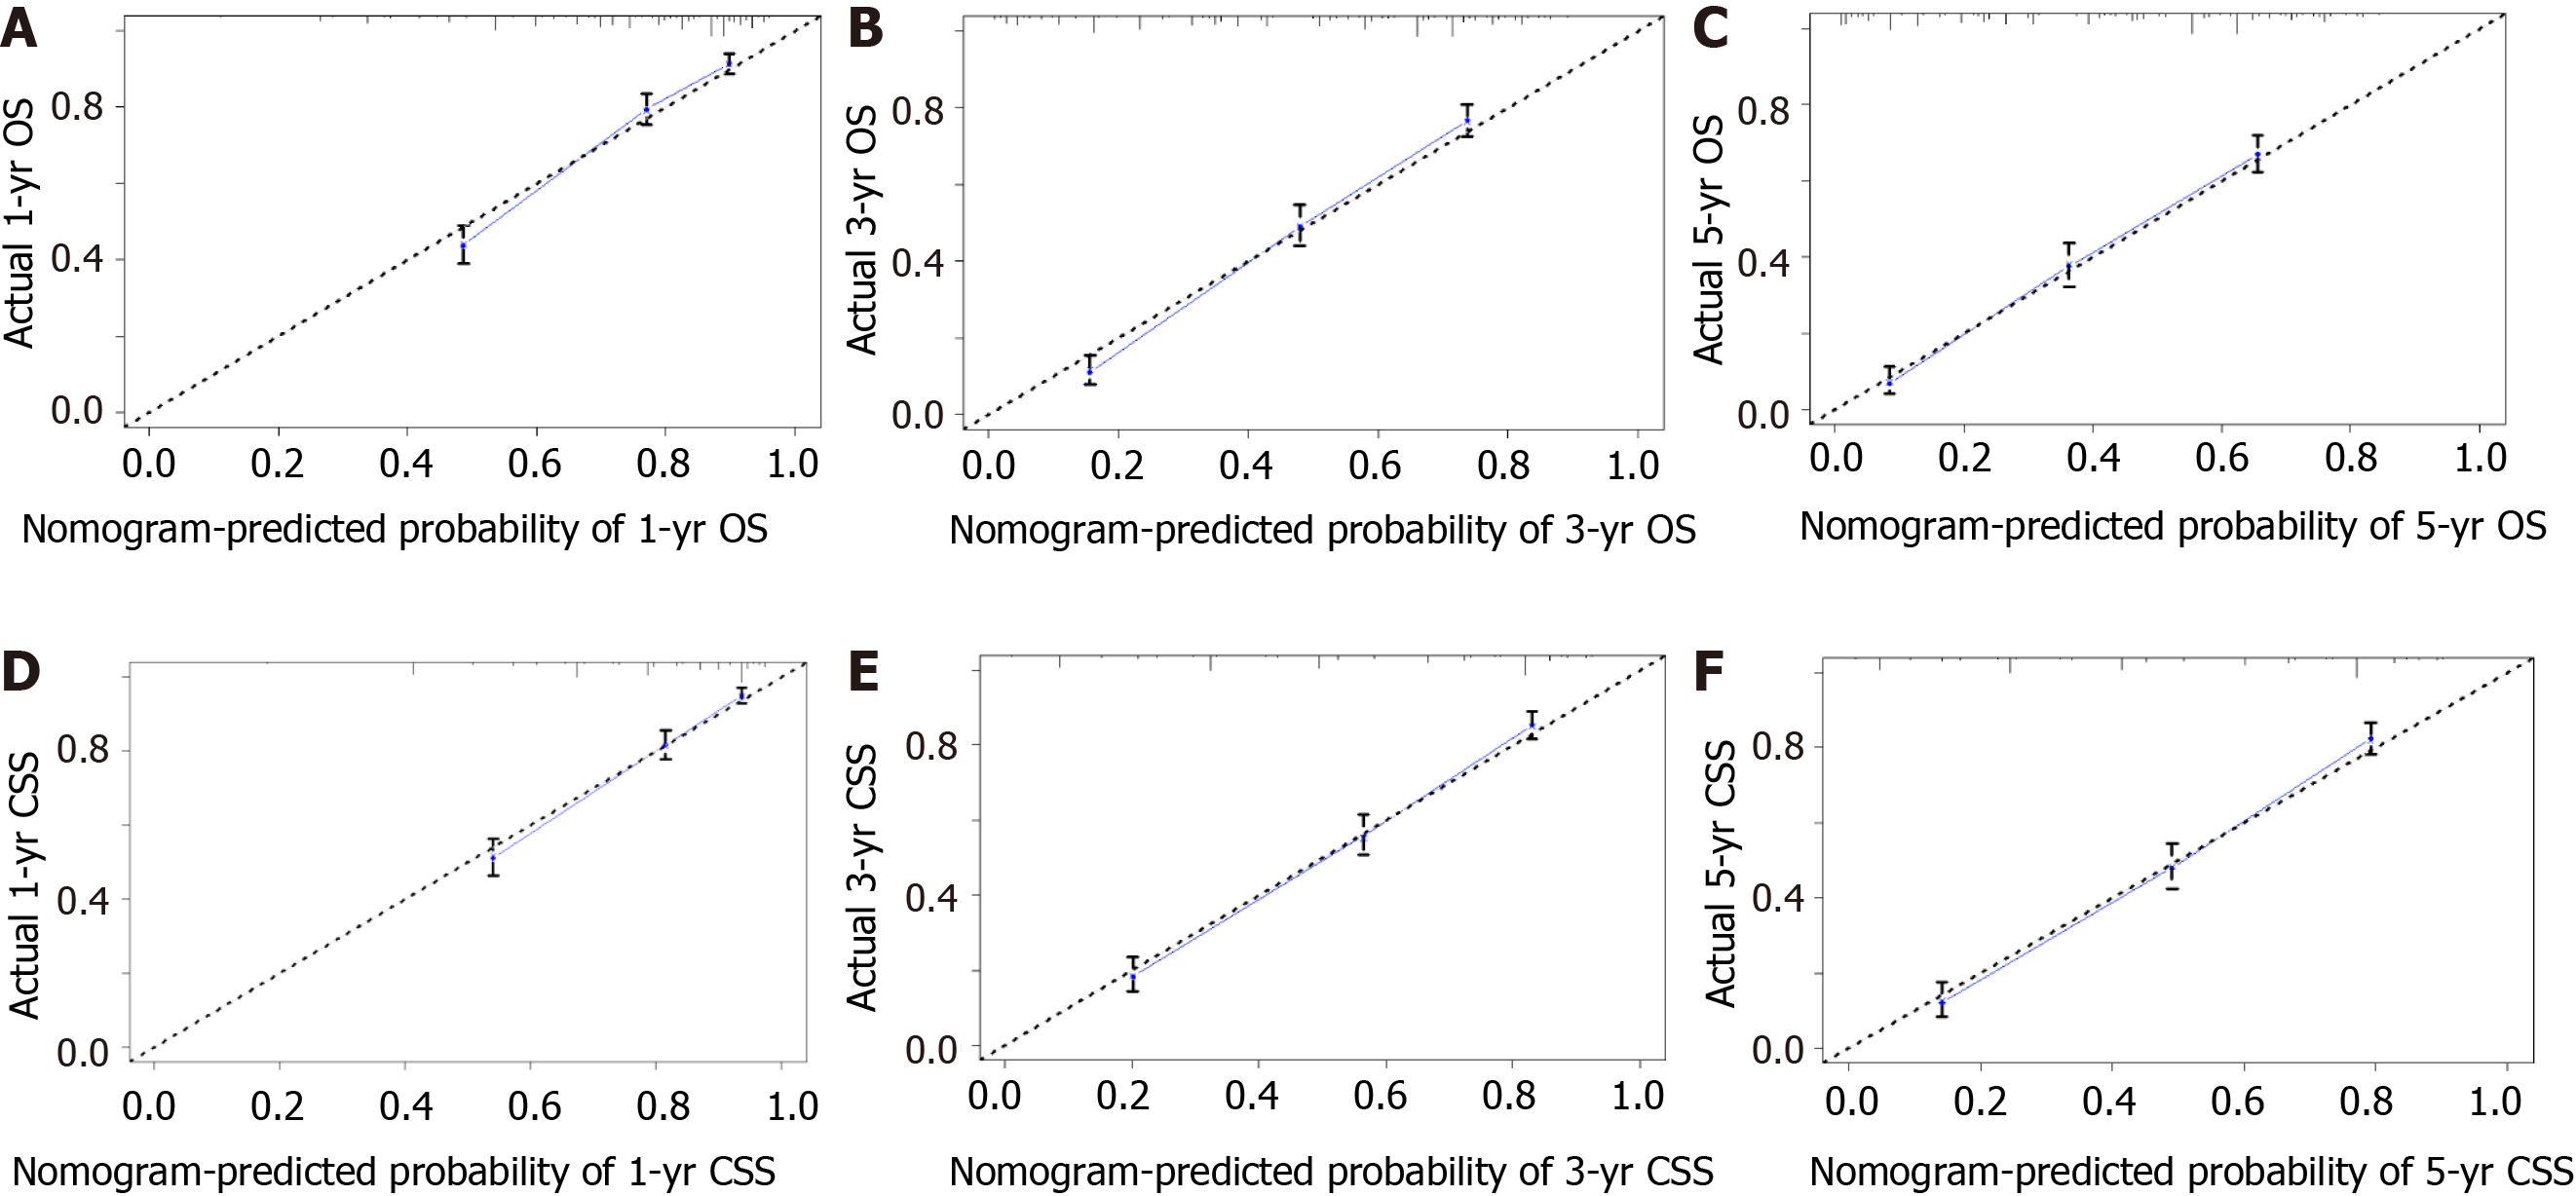
Figure 4 Calibration plots.
A-C: Calibration curves for predicting 1-yr (A), 3-yr (B), and 5-yr (C) overall survival rates; D-F: Calibration curves for predicting 1-yr (D), 3-yr (E), and 5-yr (F) cause-specific survival rates. OS: Overall survival; CSS: Cause-specific survival.
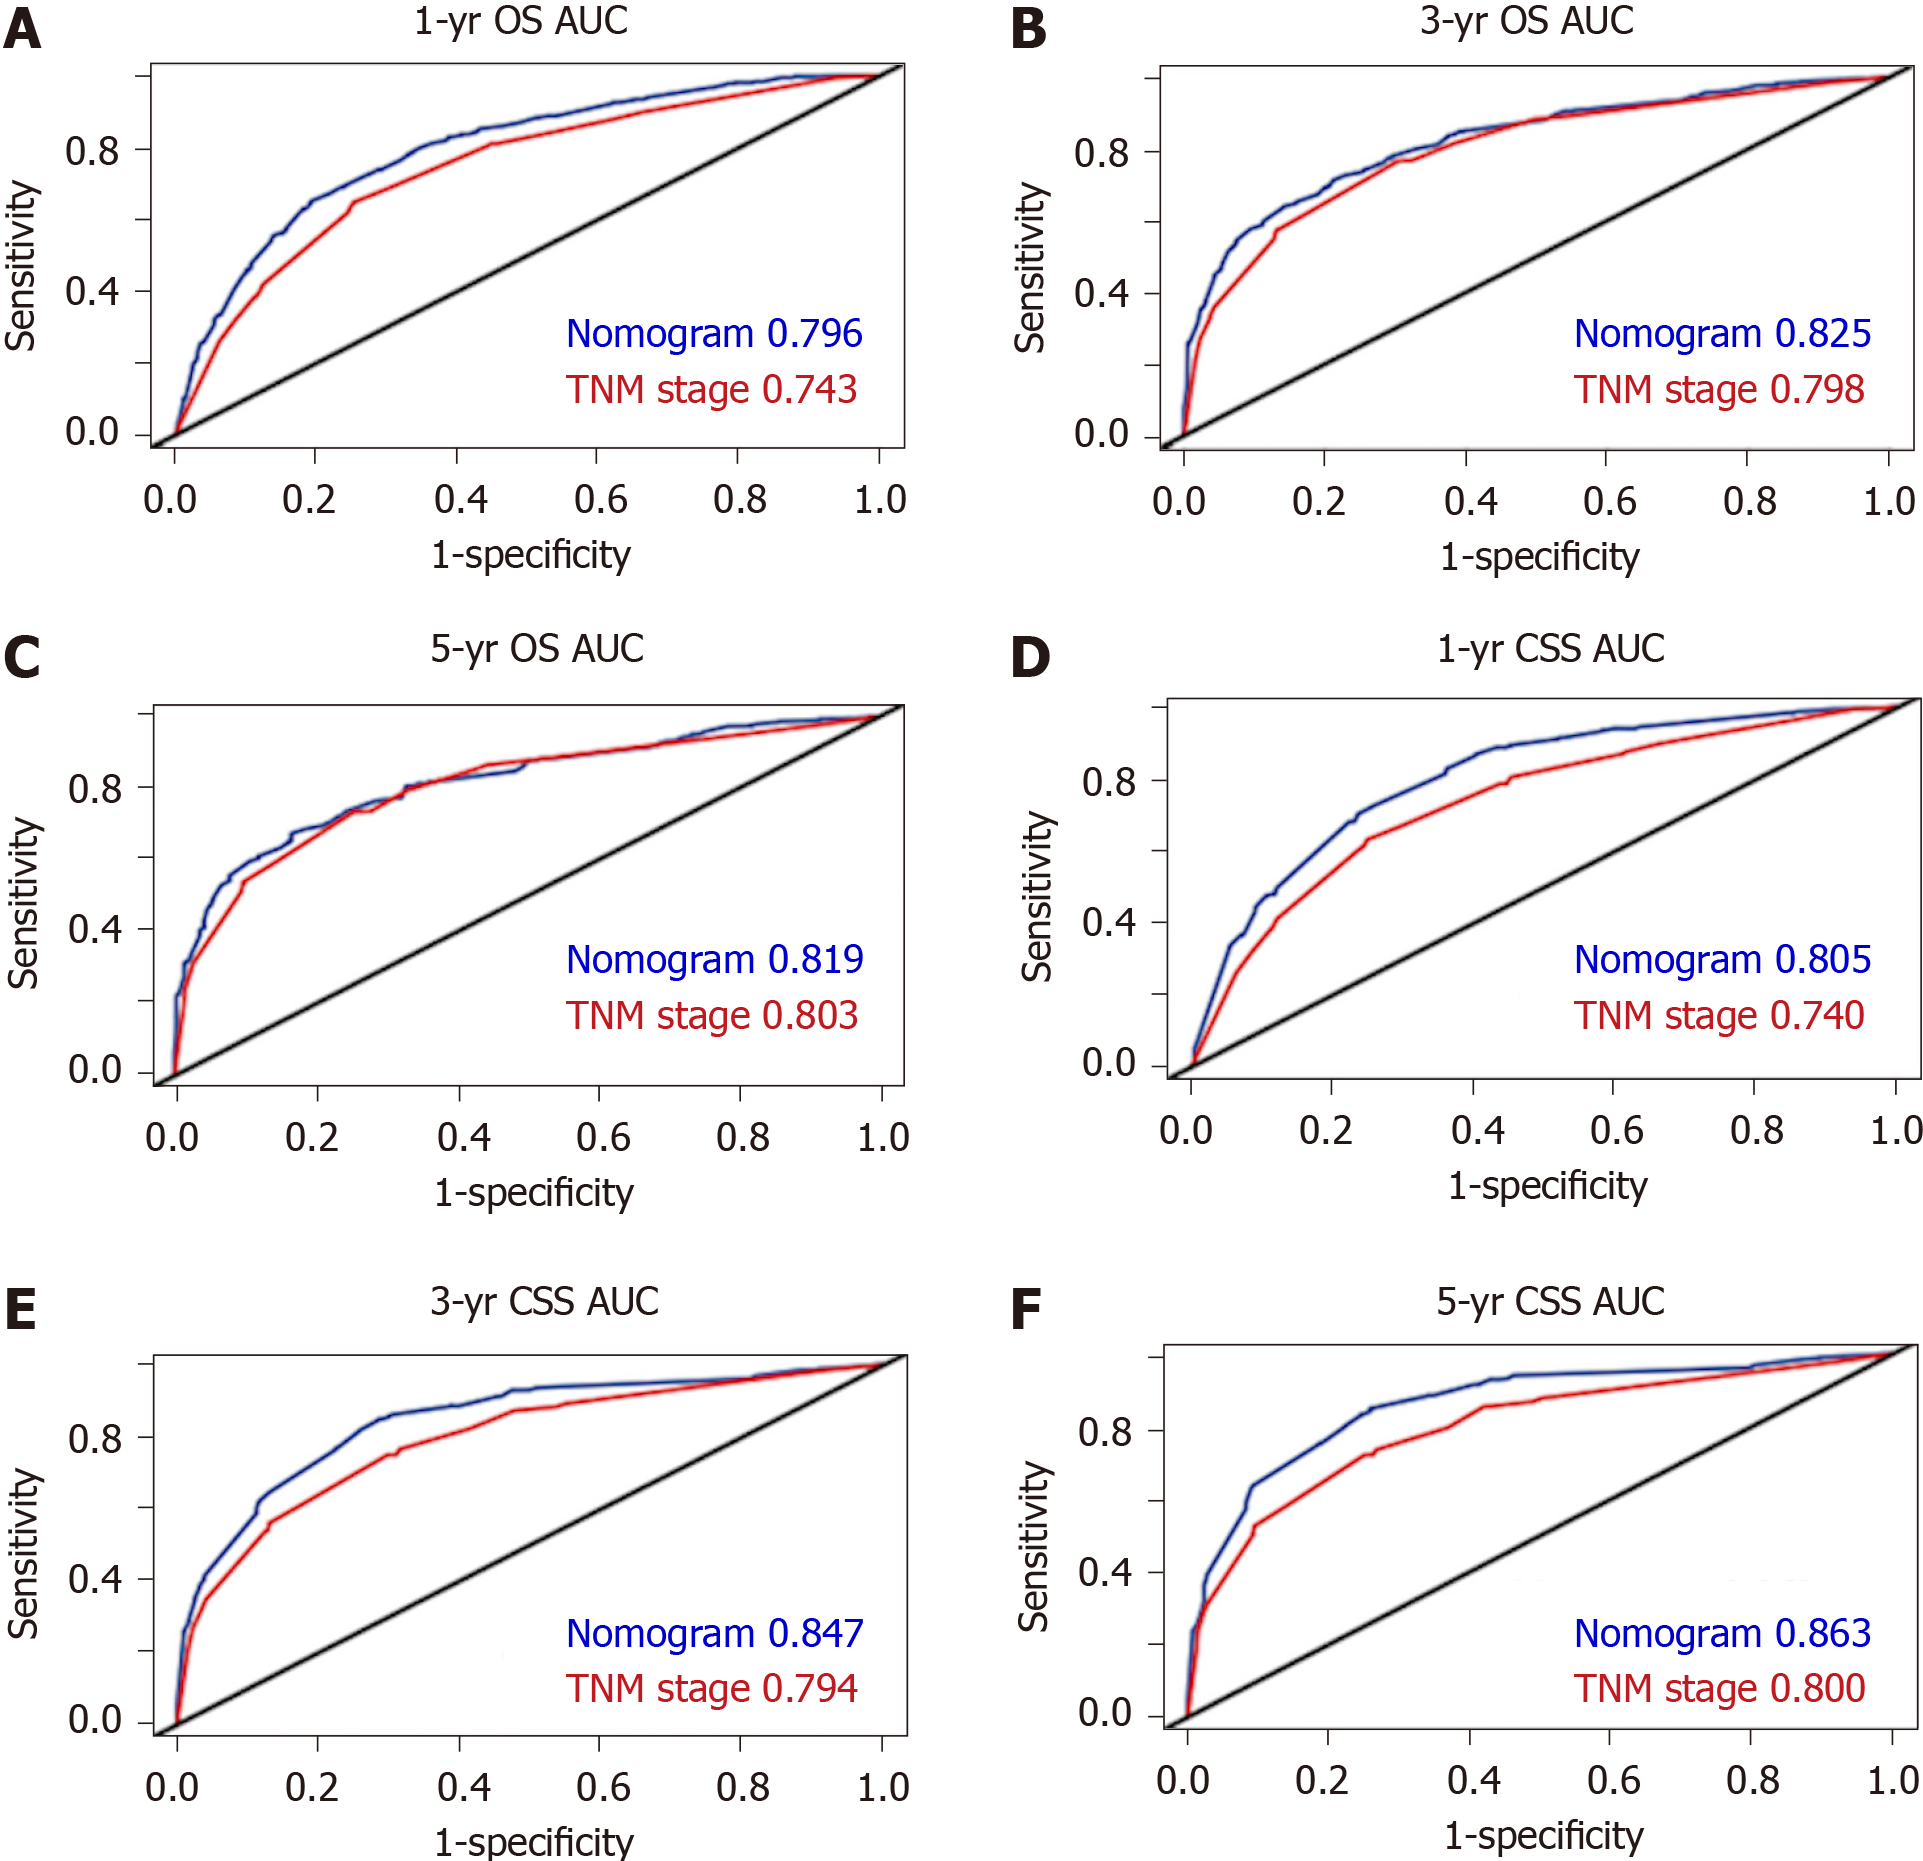
Figure 5 Areas under the receiver operating characteristic curves for predicting overall survival and cause-specific survival.
A-C: Area under the curve values of the nomogram and the tumor-node-metastasis staging system for predicting 1-yr (A), 3-yr (B), and 5-yr (C) overall survival rates; D-F: Area under the curve values of the nomogram and the tumor-node-metastasis staging system for predicting 1-yr (D), 3-yr (E), and 5-yr (F) cause-specific survival rates. AUC: Areas under the curve; OS: Overall survival; CSS: Cause-specific survival; TNM: Tumor-node-metastasis.
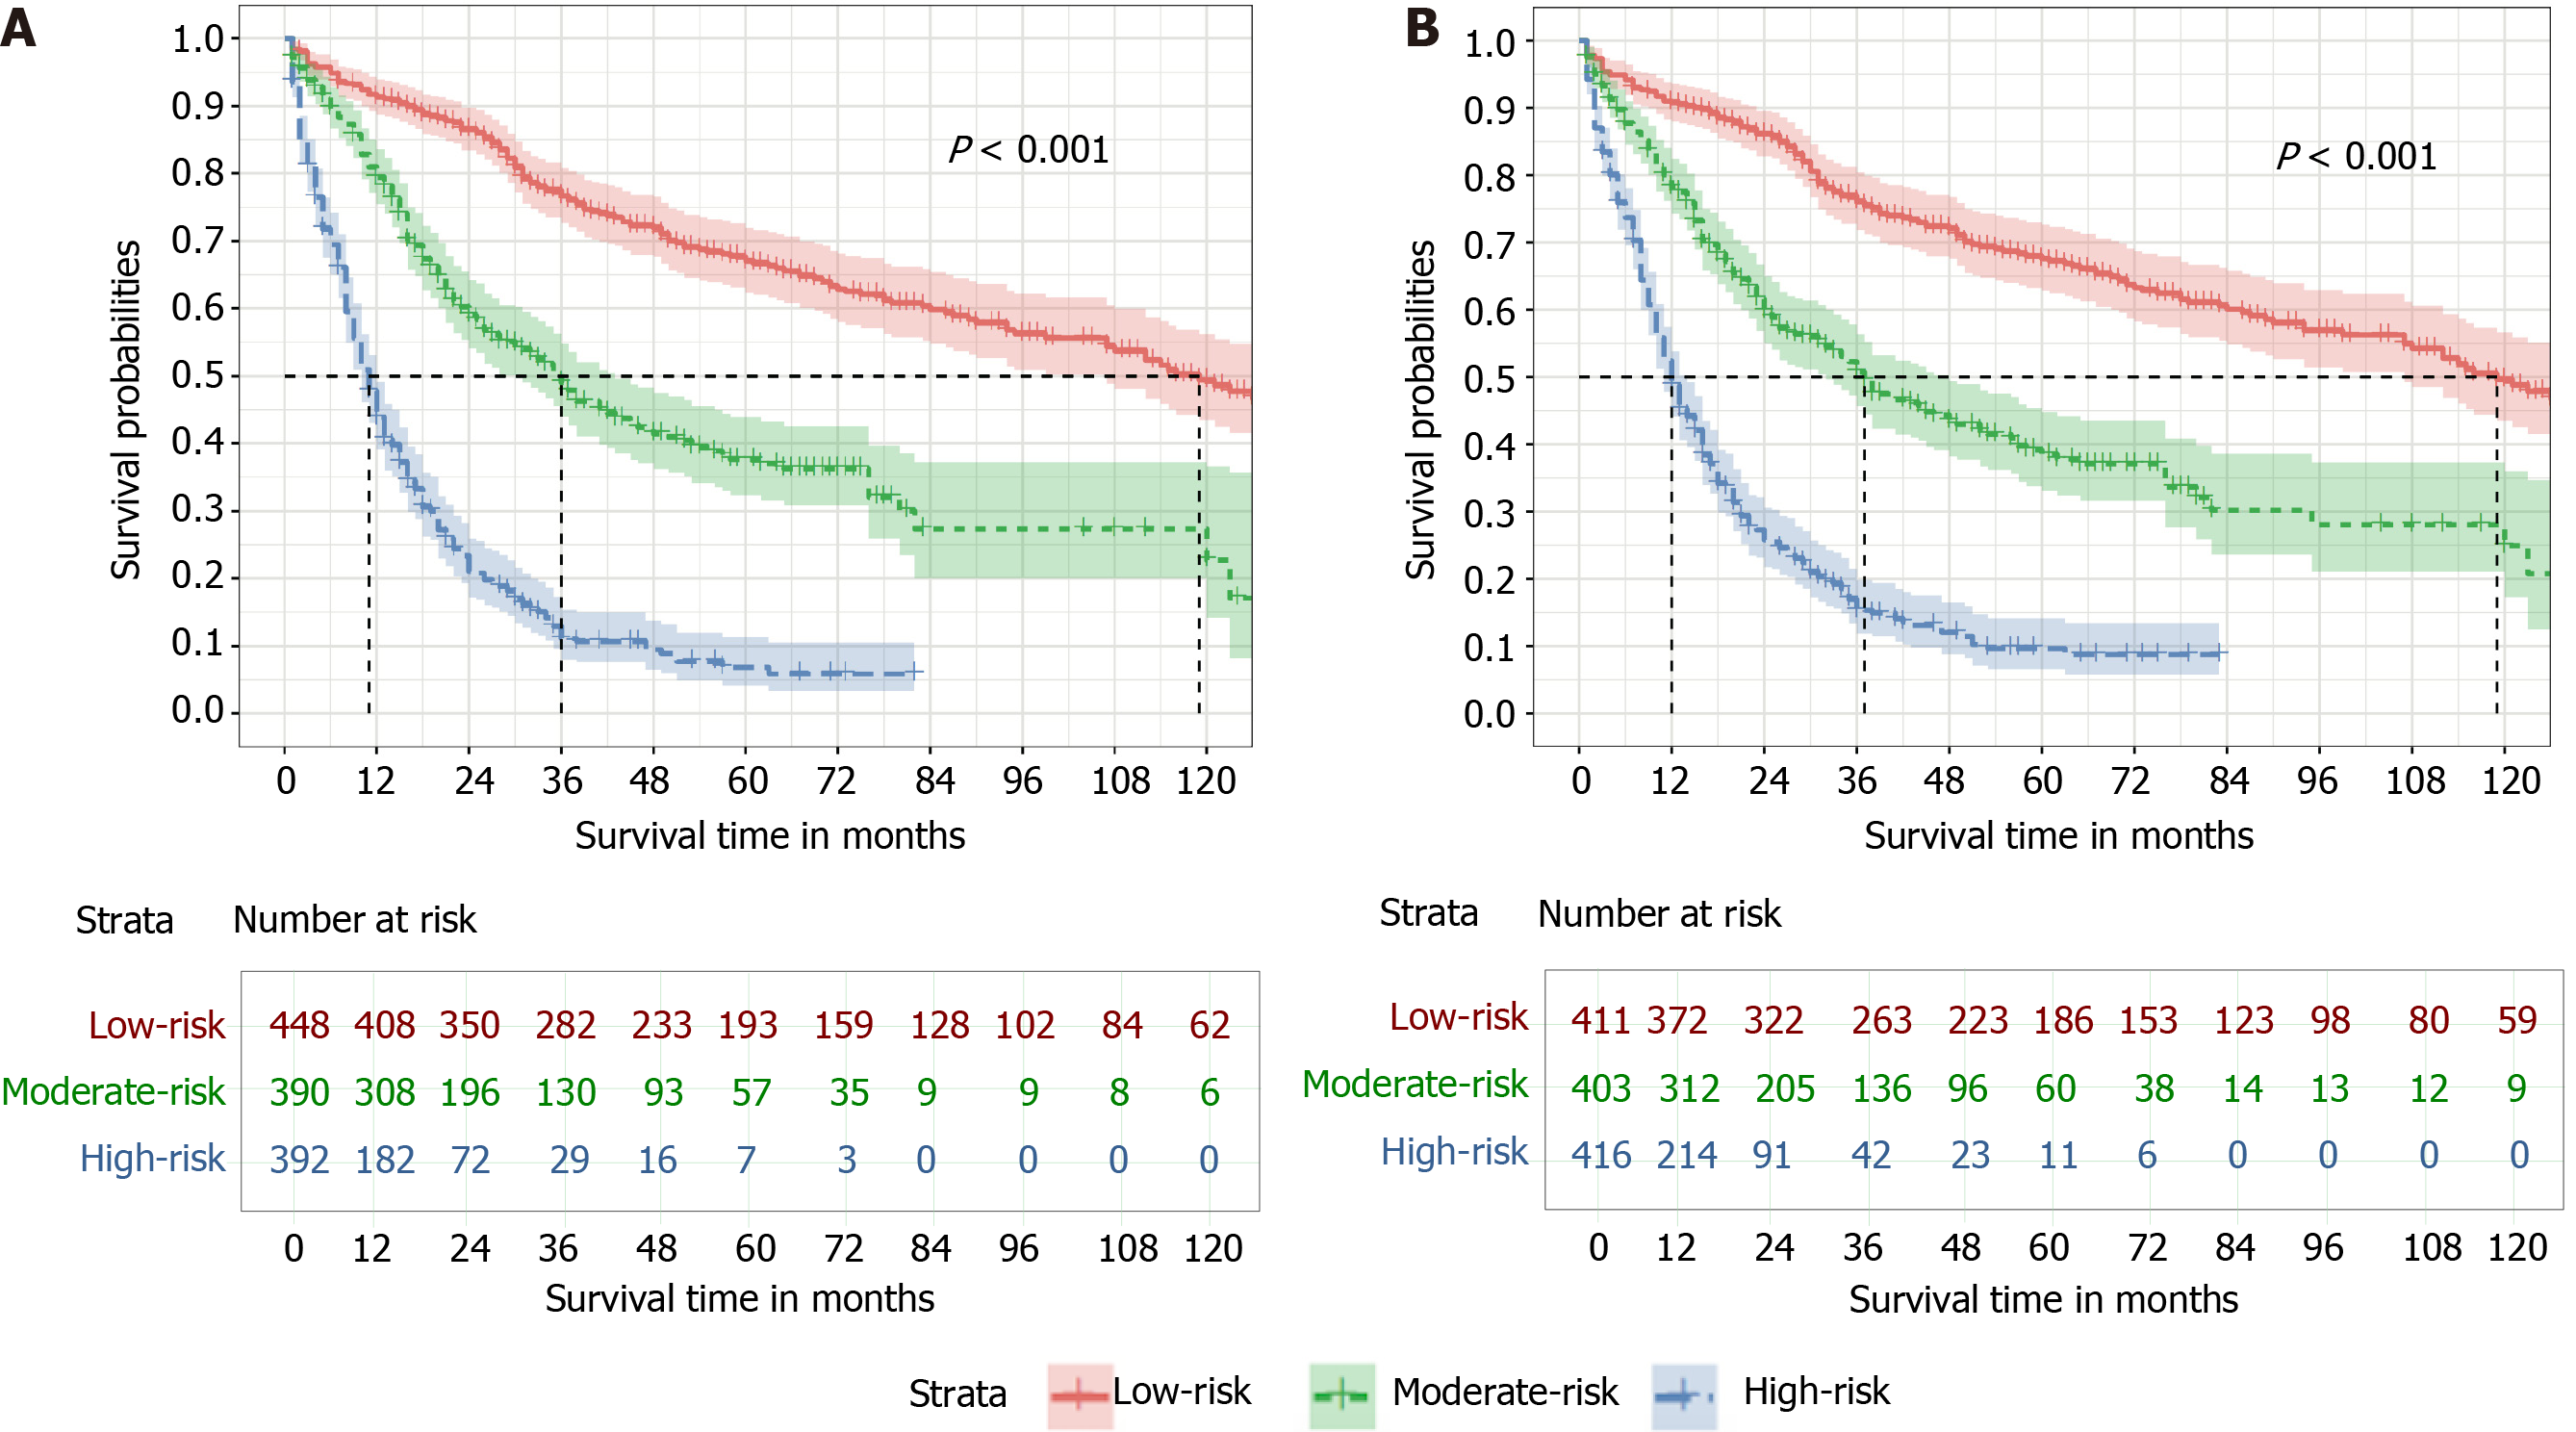
Figure 6 Risk assessment using the nomogram.
A: Kaplan-Meier estimate of overall survival in the subgroup according to tertiles of the total score; B: Kaplan-Meier estimate of cause-specific survival in the subgroup according to tertiles of the total score.
- Citation: Kou FR, Zhang YZ, Xu WR. Prognostic nomograms for predicting overall survival and cause-specific survival of signet ring cell carcinoma in colorectal cancer patients. World J Clin Cases 2021; 9(11): 2503-2518
- URL: https://www.wjgnet.com/2307-8960/full/v9/i11/2503.htm
- DOI: https://dx.doi.org/10.12998/wjcc.v9.i11.2503


