Copyright
©The Author(s) 2021.
World J Clin Cases. Jan 6, 2021; 9(1): 133-147
Published online Jan 6, 2021. doi: 10.12998/wjcc.v9.i1.133
Published online Jan 6, 2021. doi: 10.12998/wjcc.v9.i1.133
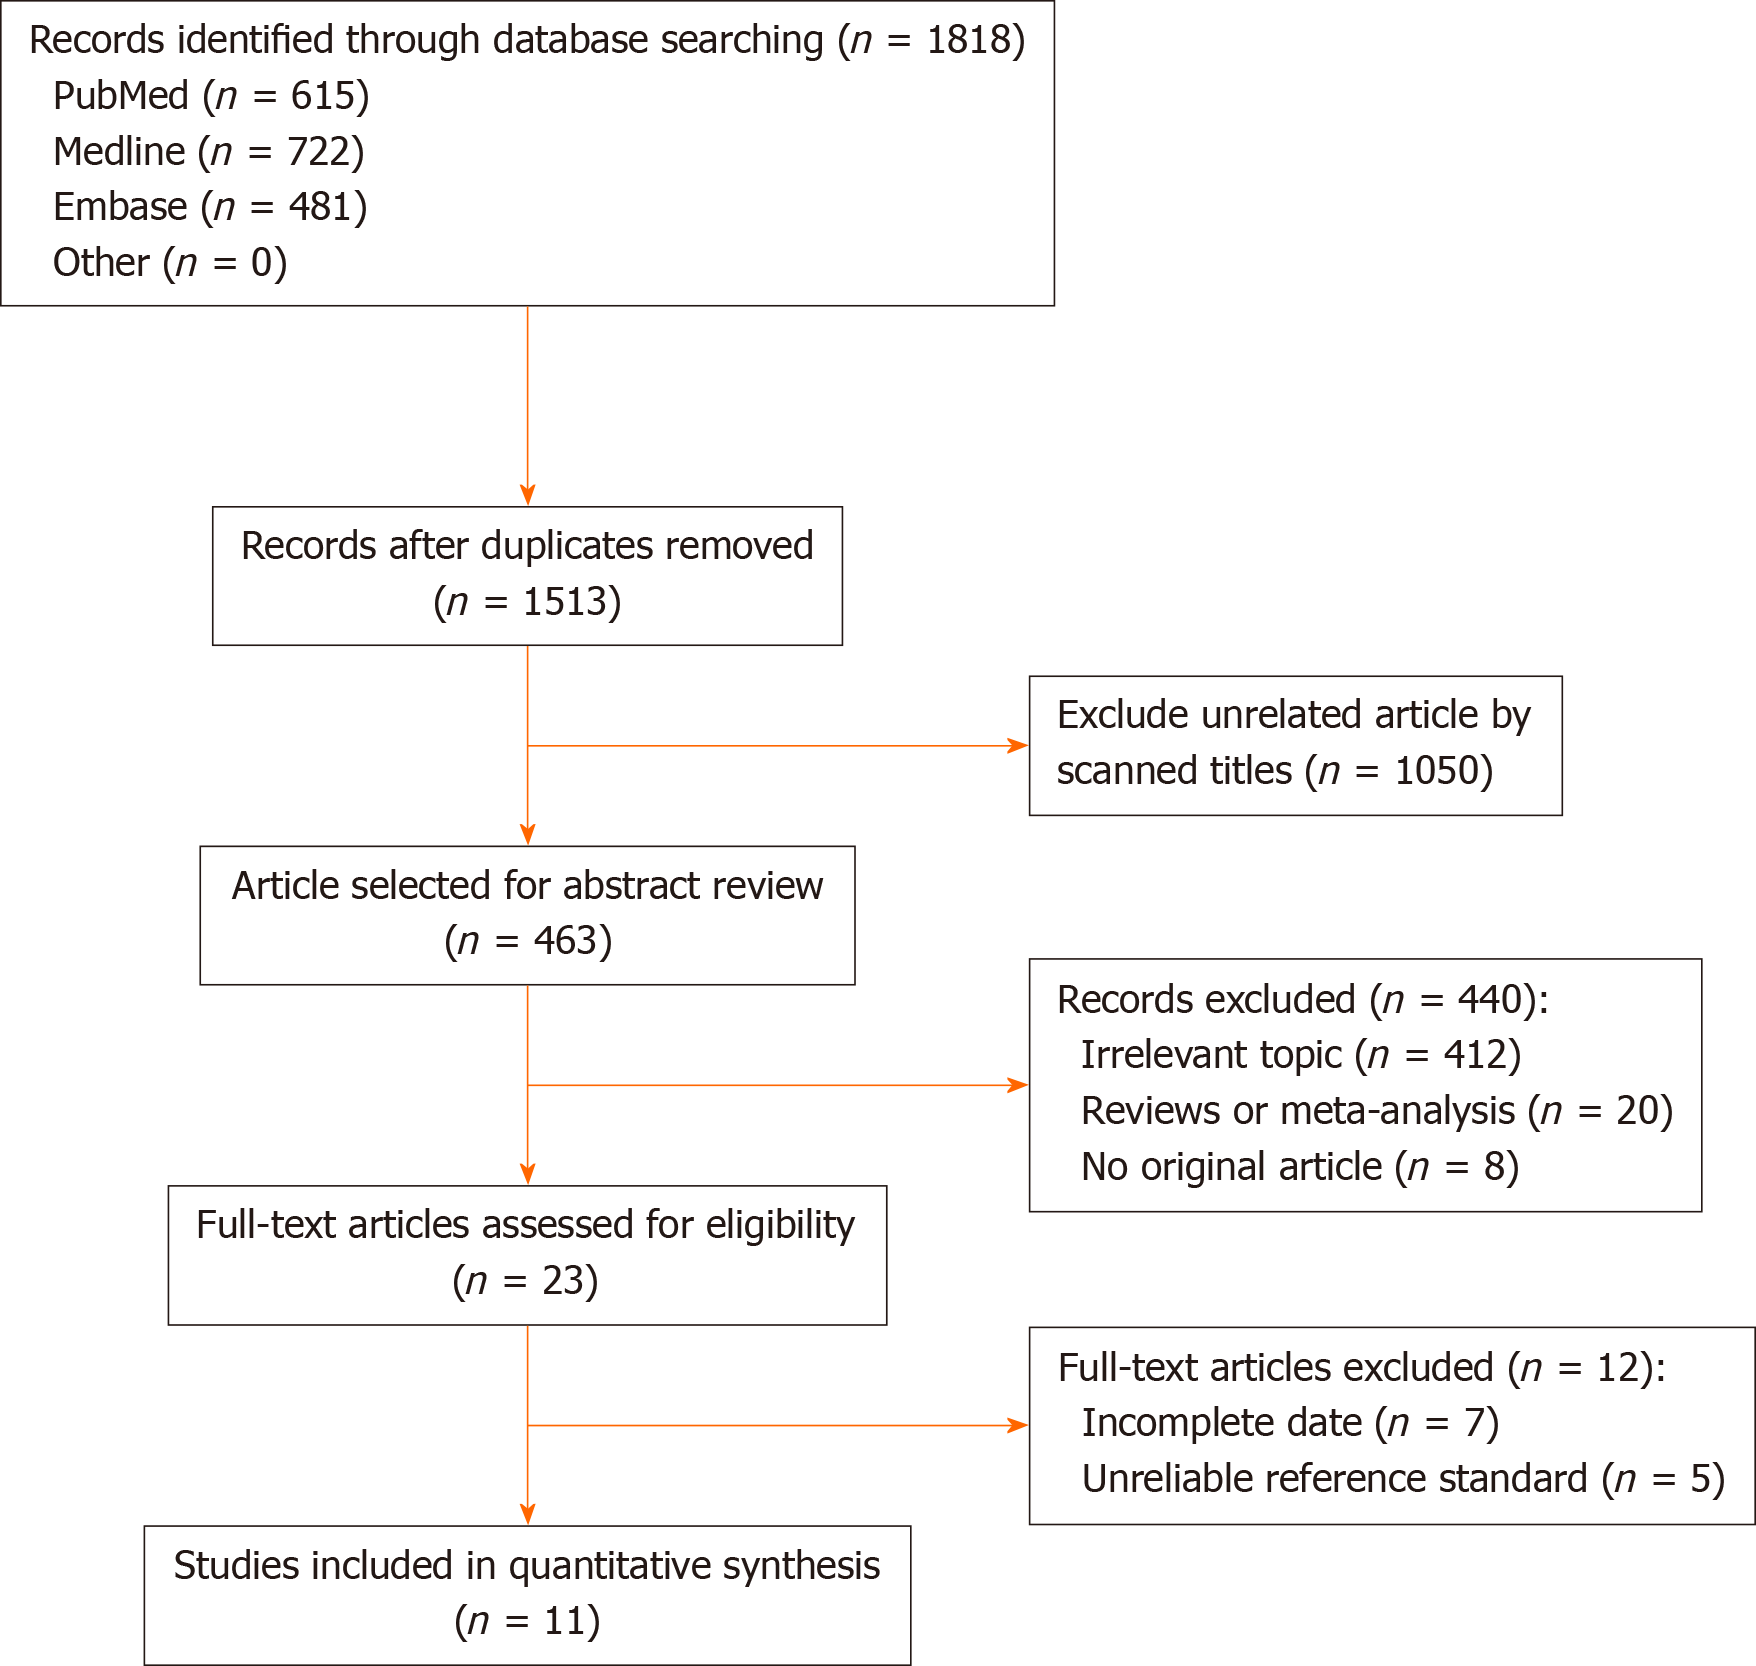
Figure 1 Study selection process.
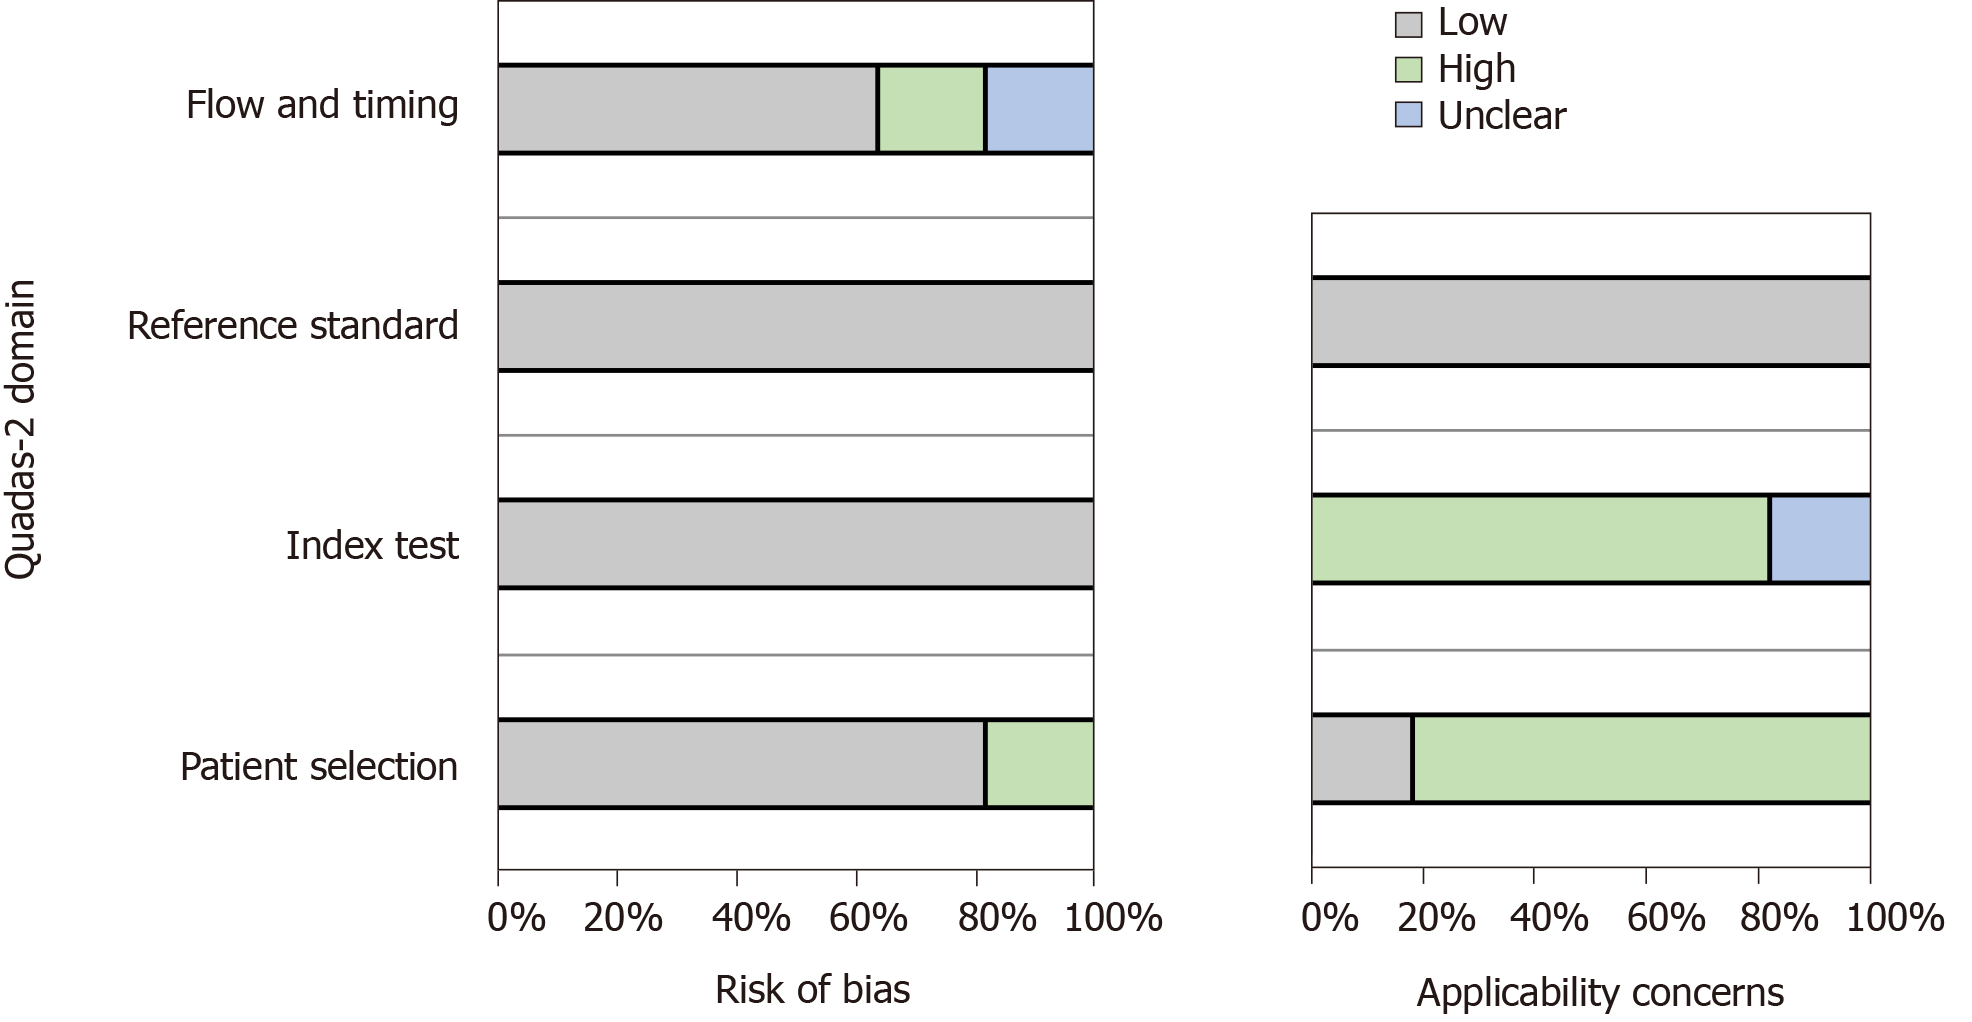
Figure 2 Risk of bias assessment.
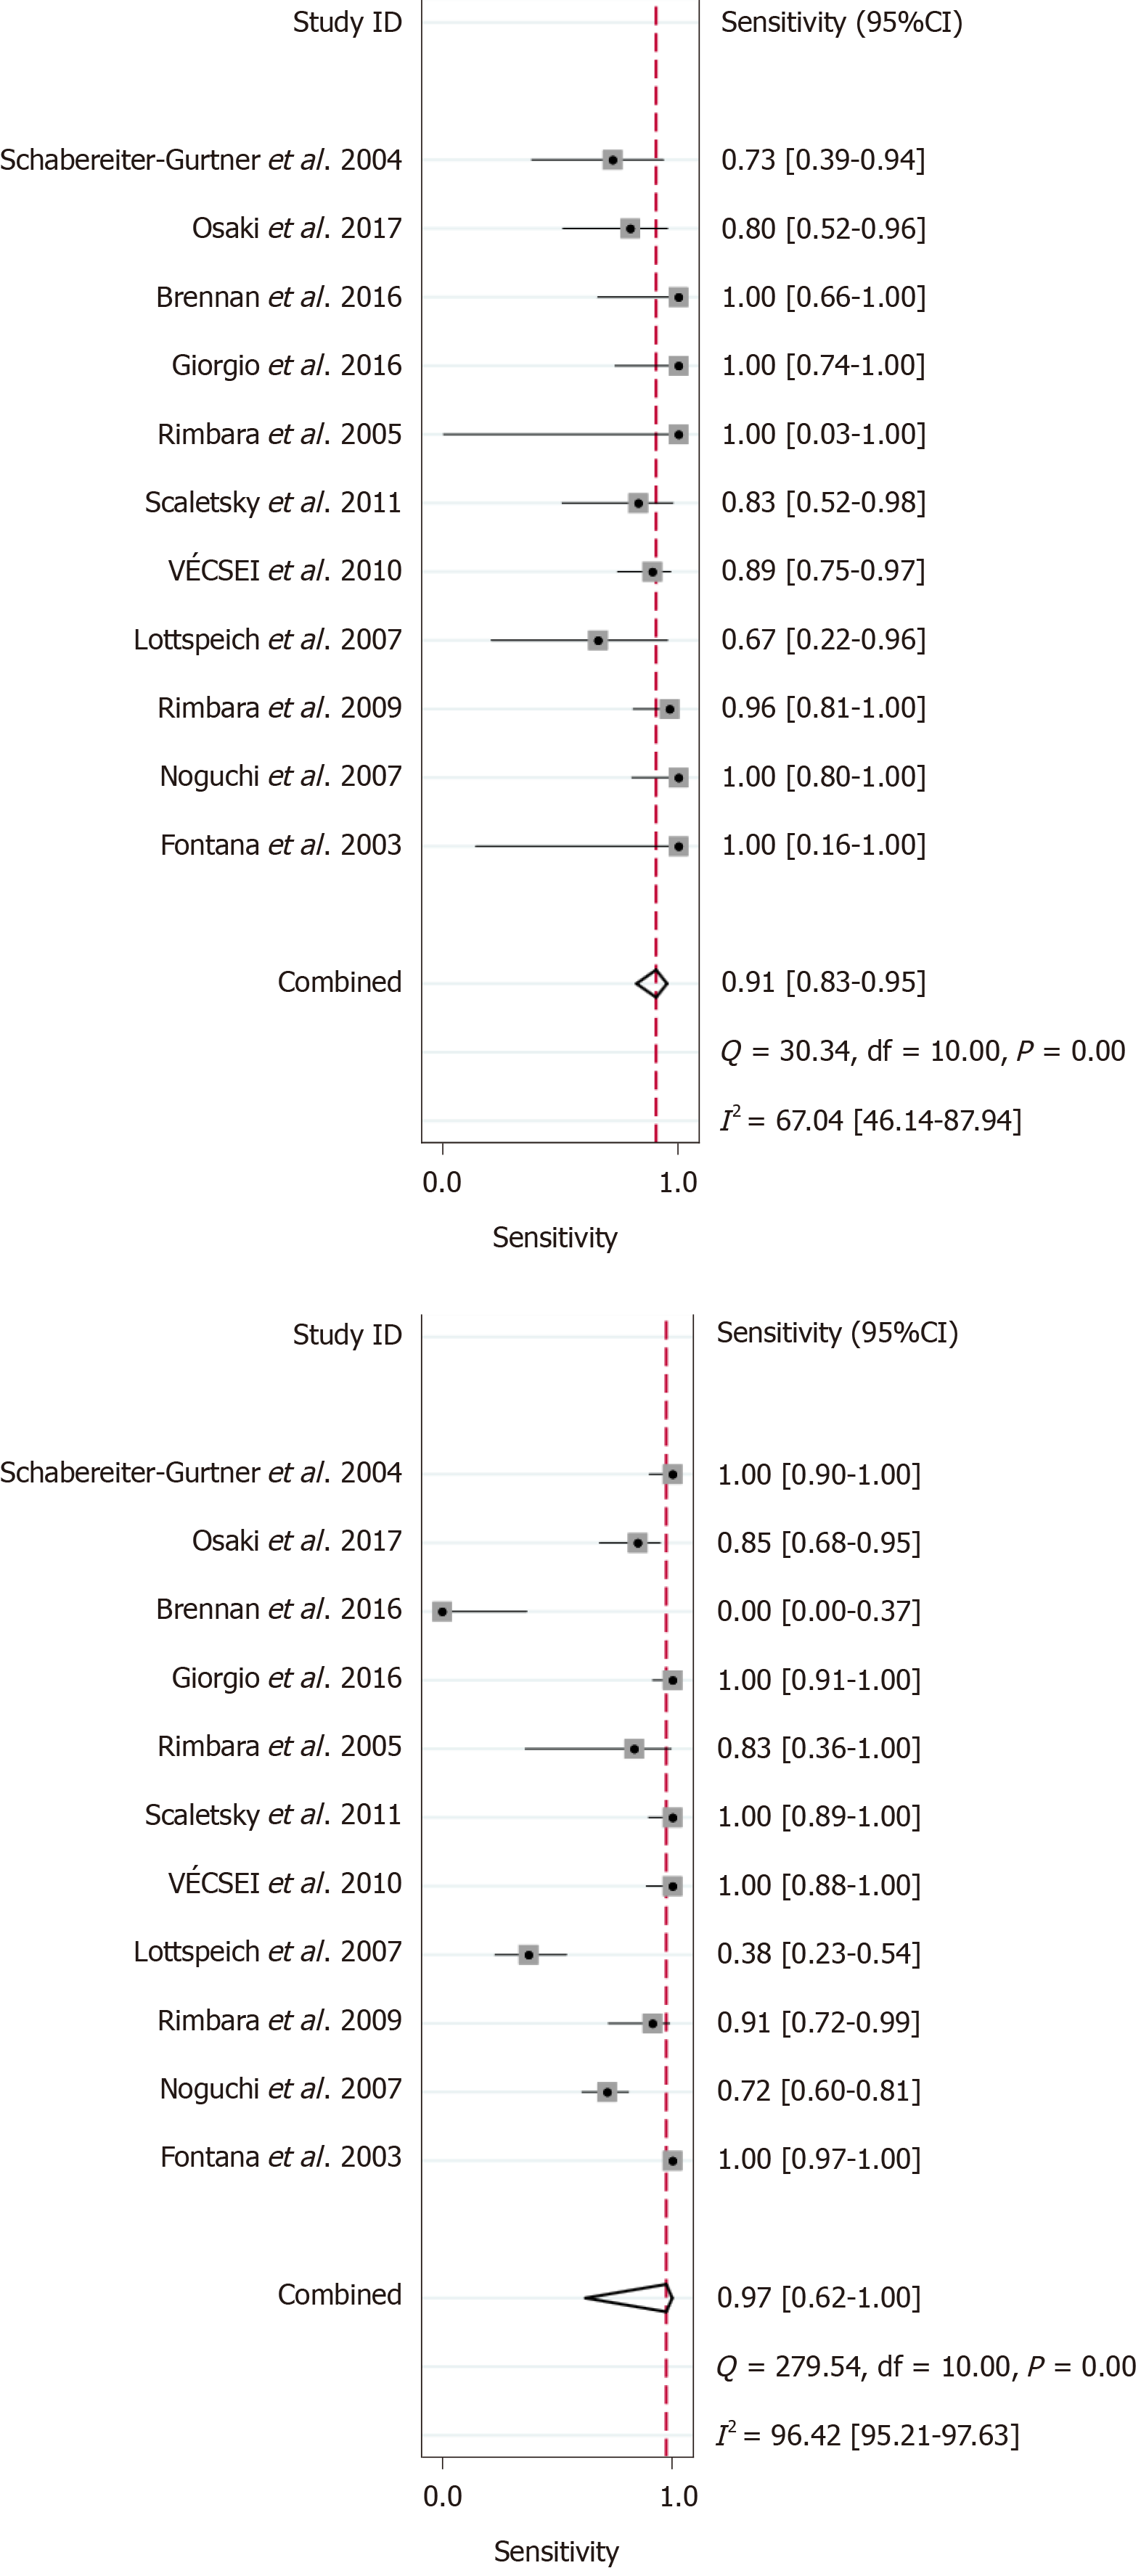
Figure 3 Overall sensitivity and specificity.
CI: Confidence interval.
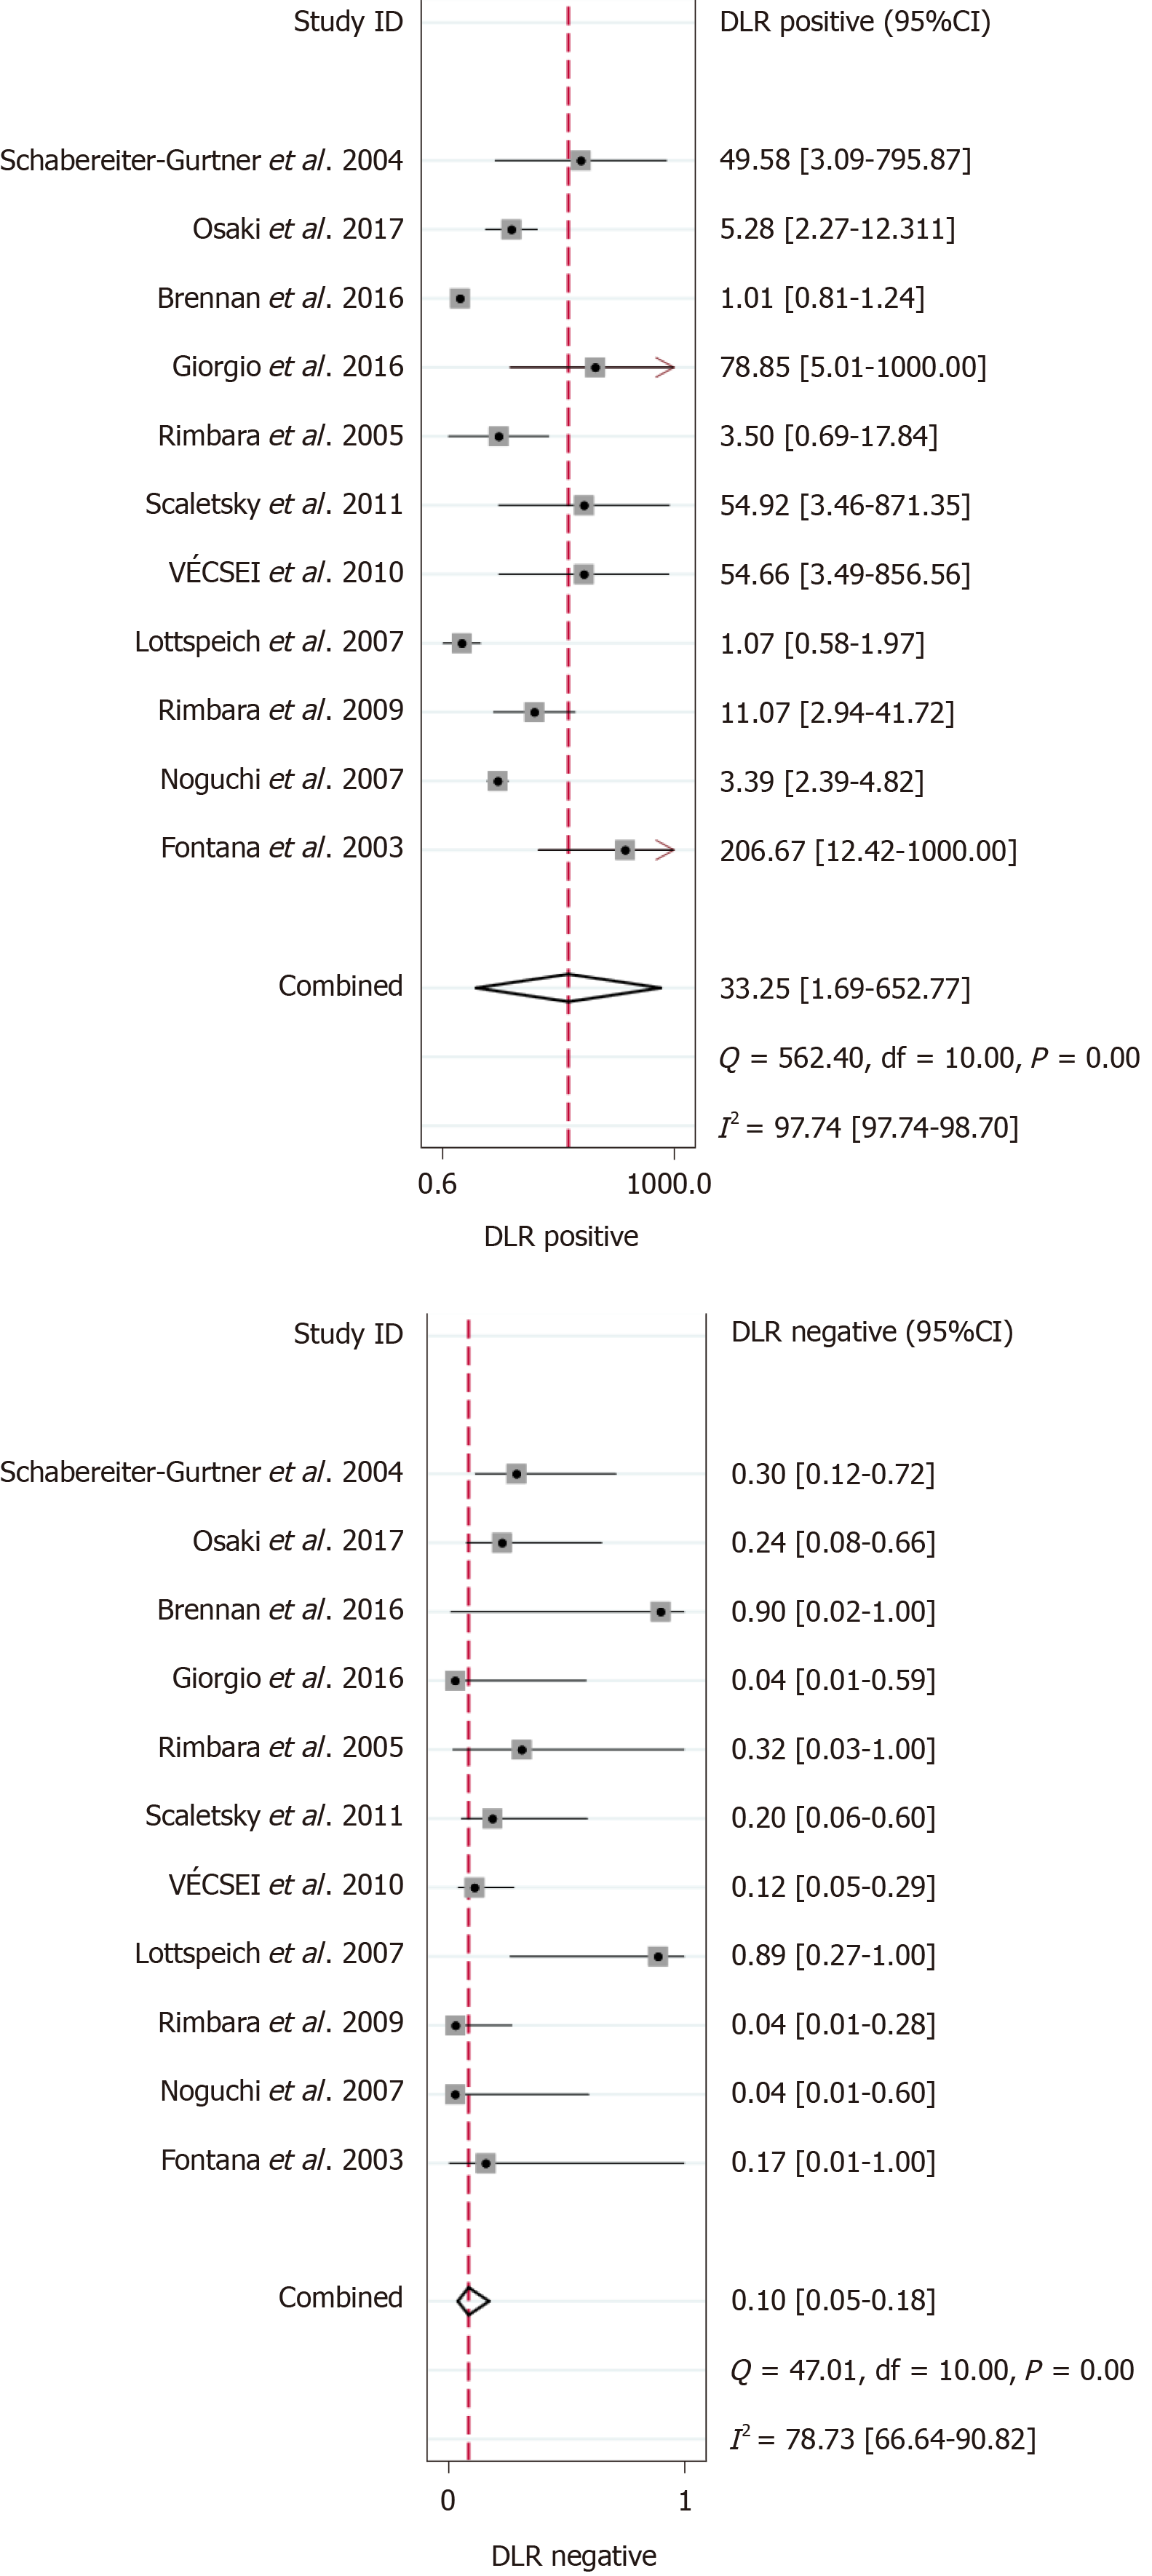
Figure 4 Overall likelihood ratio for positive and negative tests.
CI: Confidence interval.
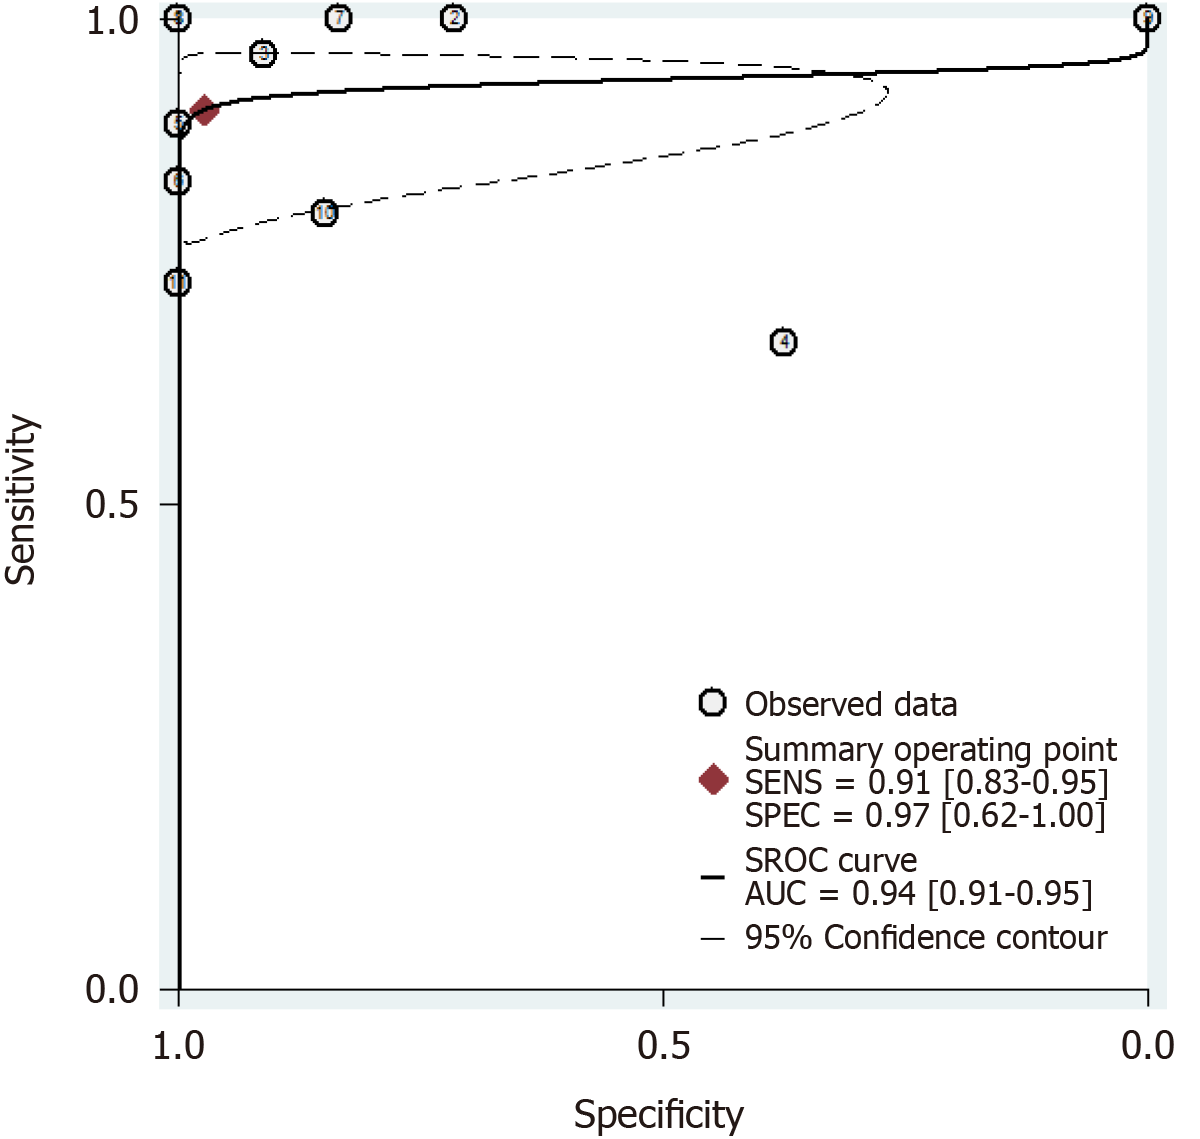
Figure 5 Summary receiver operating characteristics curve based on sensitivity and specificity.
AUC: Area under the curve; SROC: Summary receiver operating characteristics.
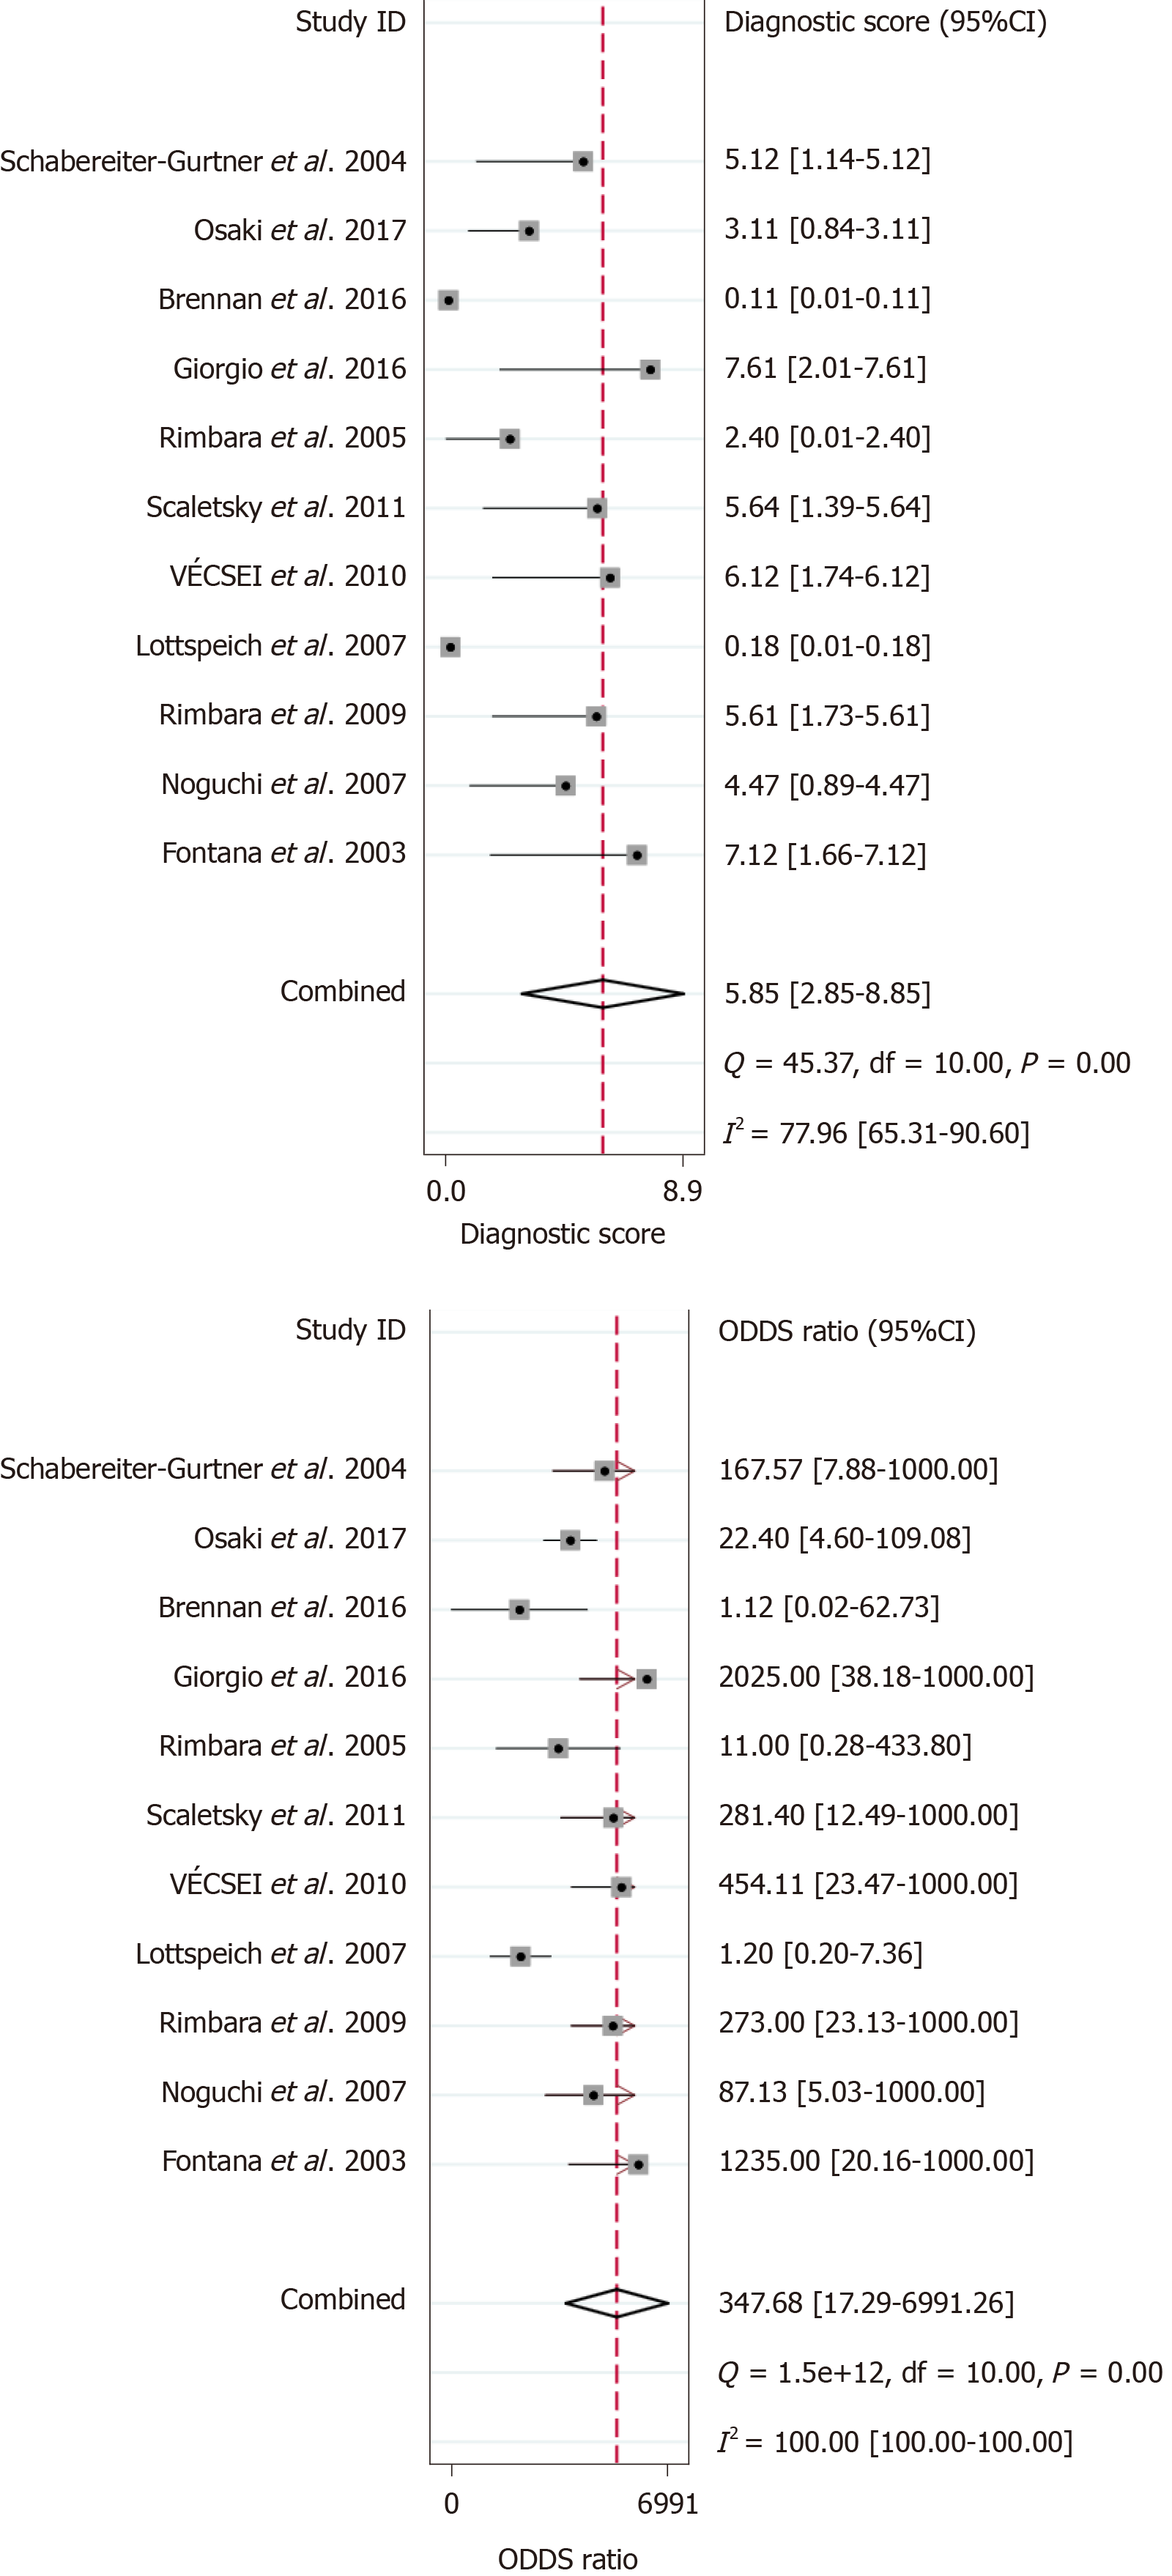
Figure 6 Diagnostic odds ratio.
CI: Confidence interval.
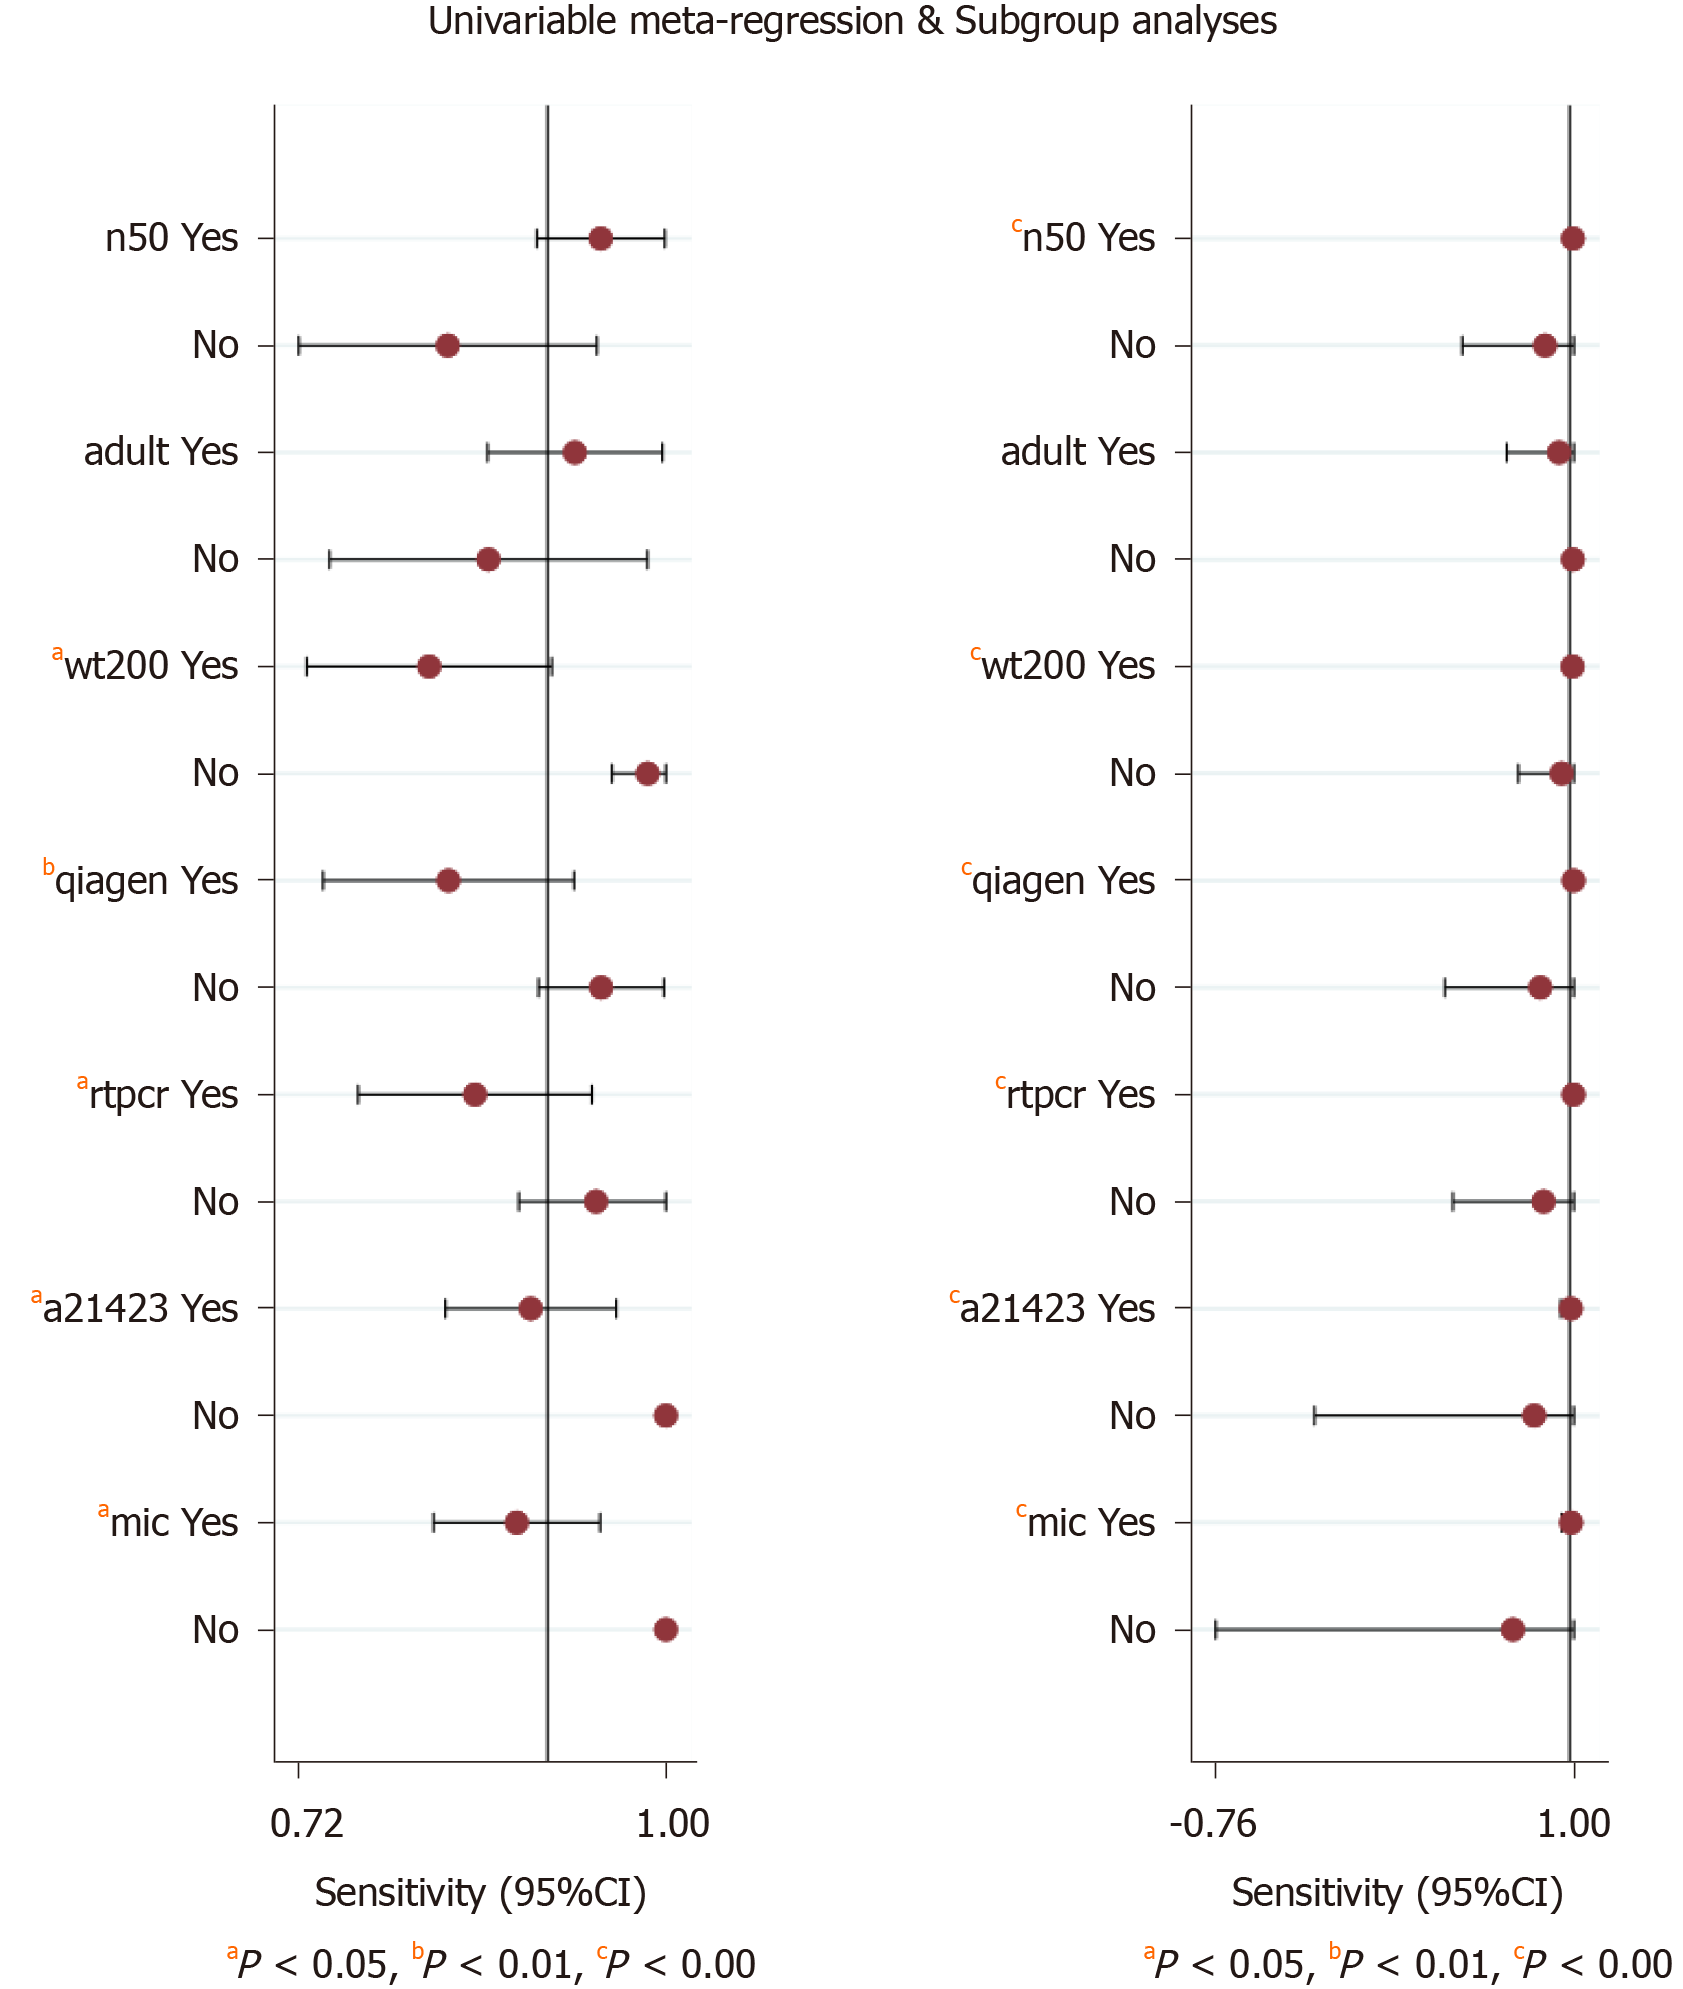
Figure 7 Univariable meta-regression and subgroup analysis.
a21423: A2142 and A2143; CI: Confidence interval; mic: Minimal inhibitory concentration; n50: The number of patients was 50; wt200: Sample weight was 200 mg.
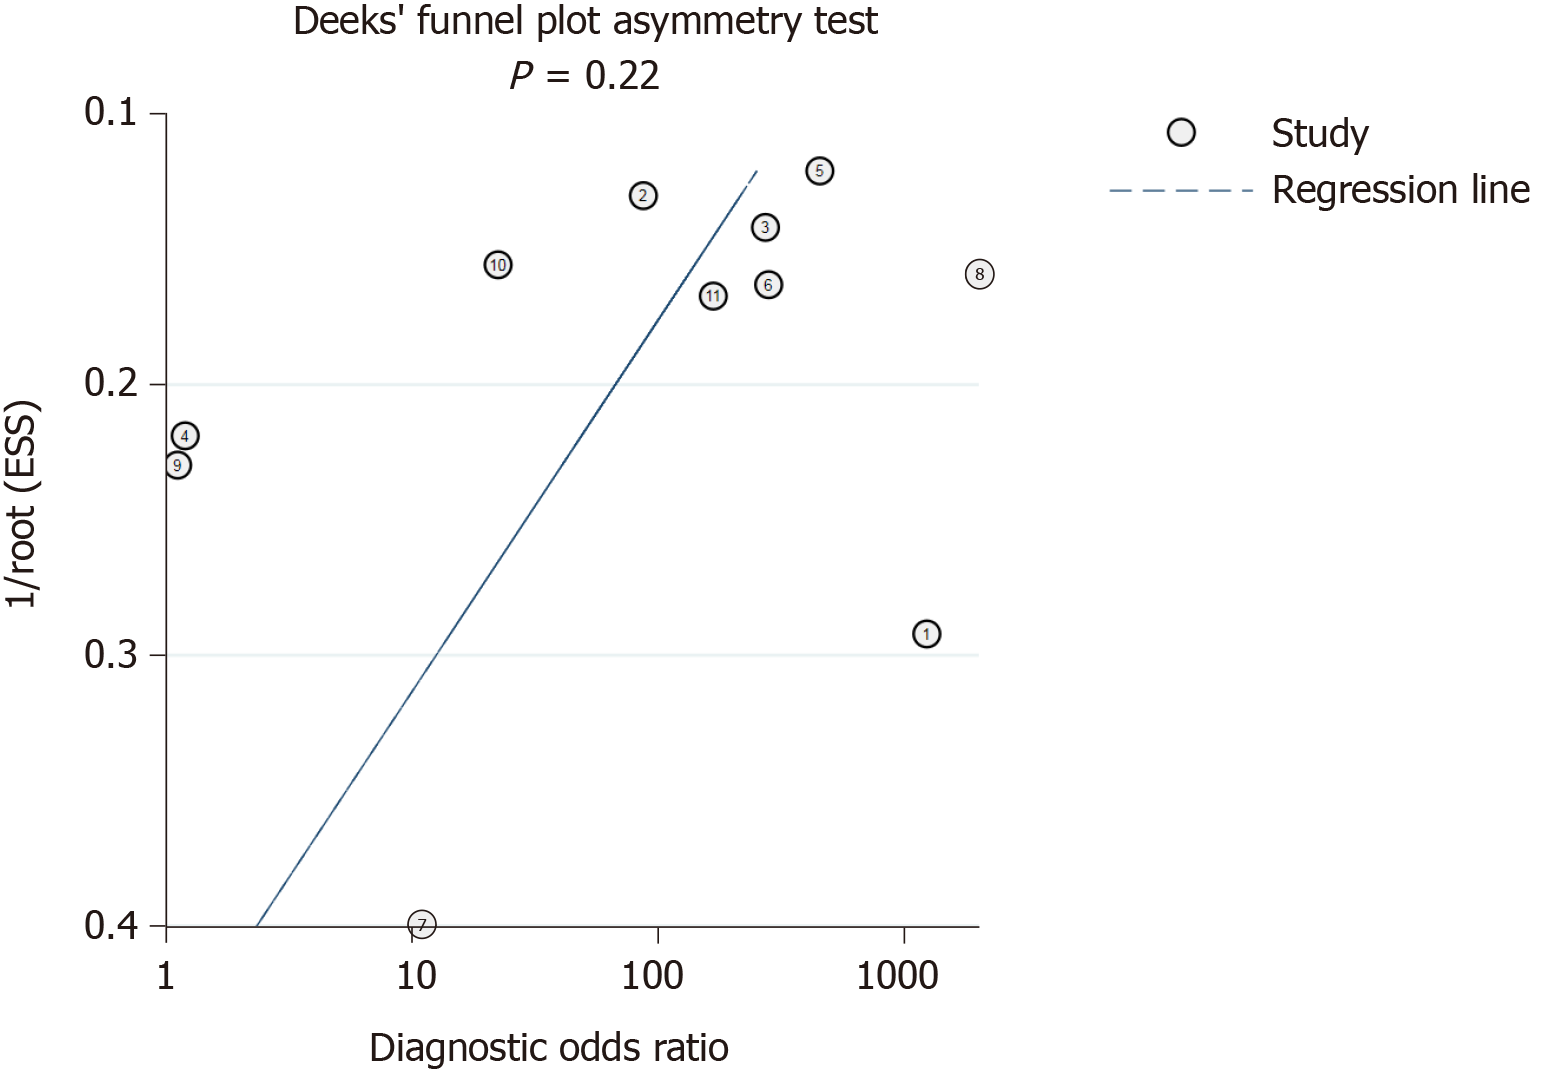
Figure 8 Deeks’ funnel plot.
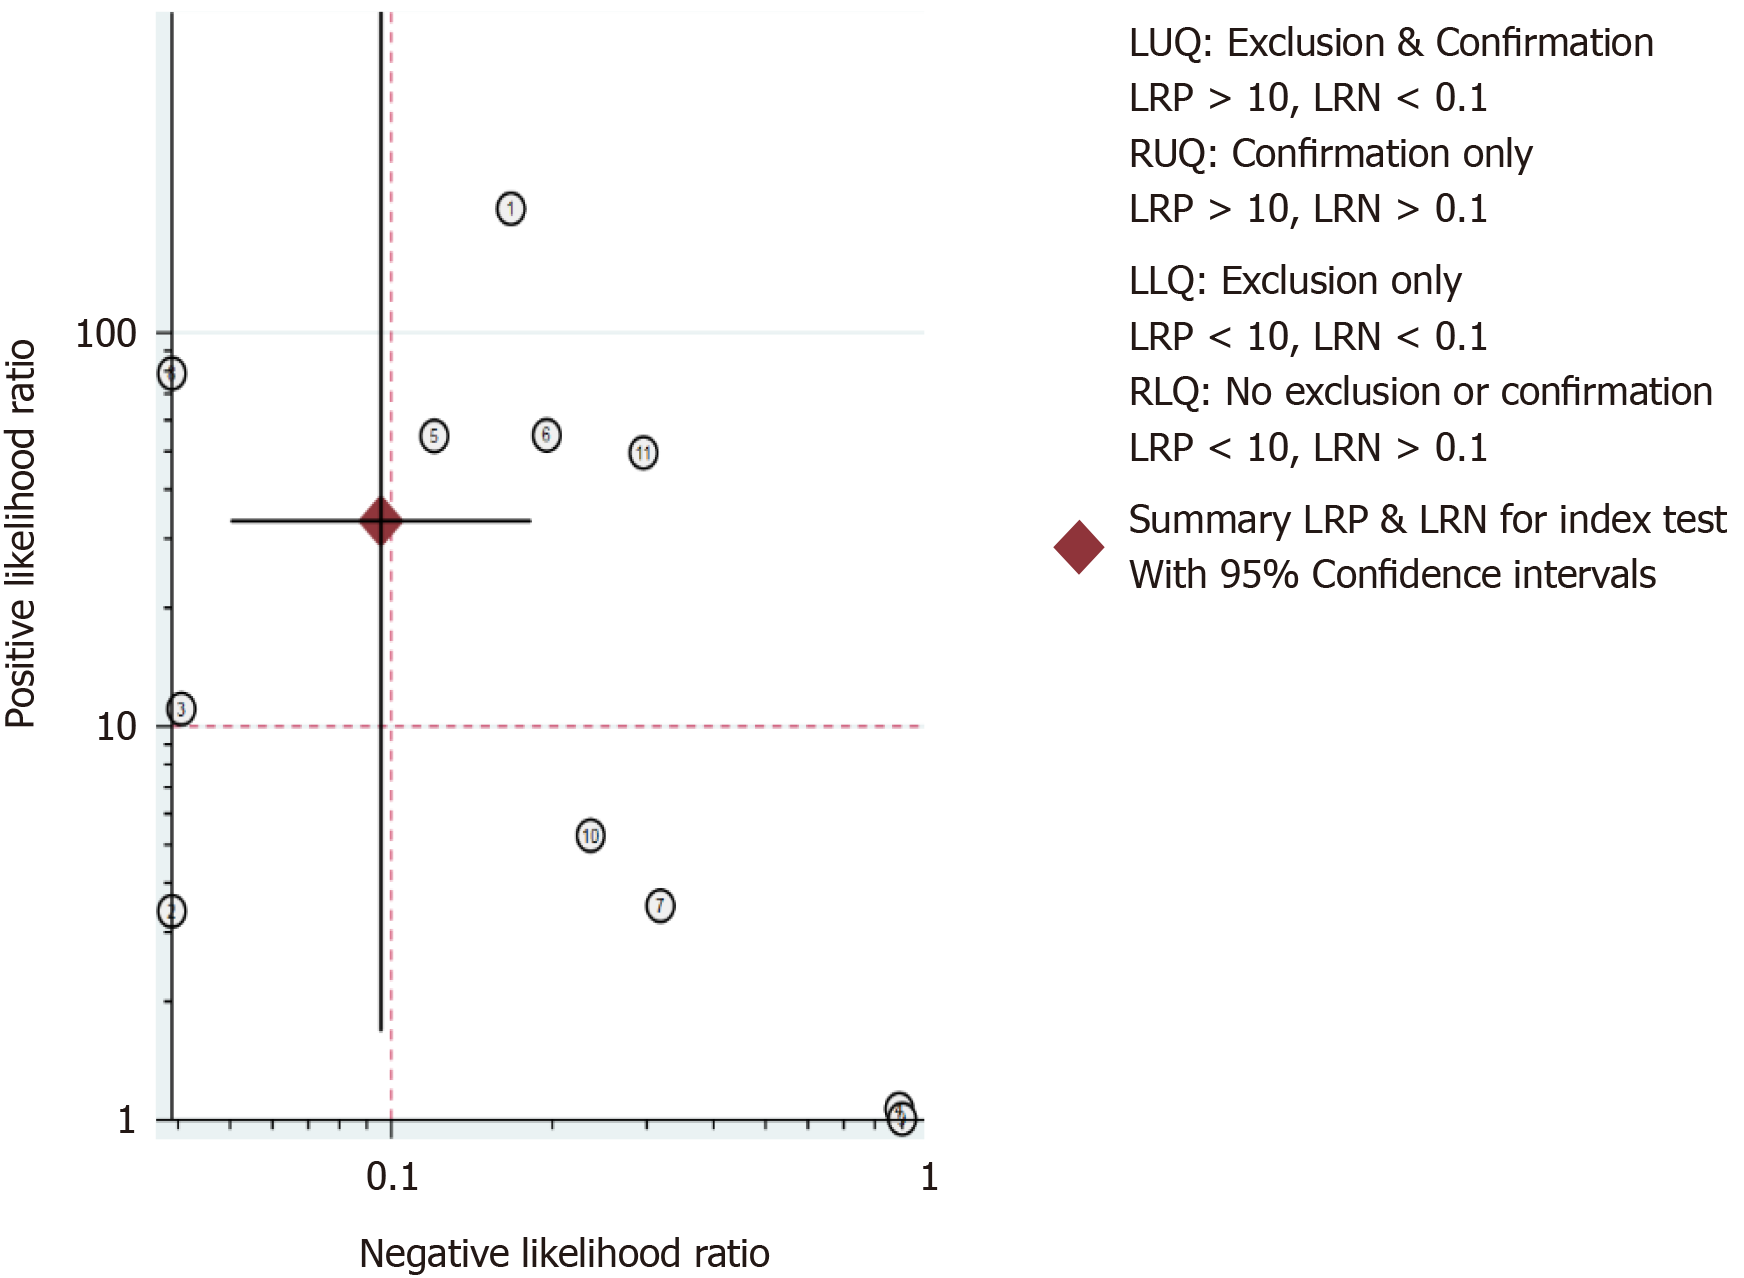
Figure 9 Likelihood ratio scatter graph.
- Citation: Gong RJ, Xu CX, Li H, Liu XM. Polymerase chain reaction-based tests for detecting Helicobacter pylori clarithromycin resistance in stool samples: A meta-analysis. World J Clin Cases 2021; 9(1): 133-147
- URL: https://www.wjgnet.com/2307-8960/full/v9/i1/133.htm
- DOI: https://dx.doi.org/10.12998/wjcc.v9.i1.133


