Copyright
©The Author(s) 2020.
World J Clin Cases. May 6, 2020; 8(9): 1608-1619
Published online May 6, 2020. doi: 10.12998/wjcc.v8.i9.1608
Published online May 6, 2020. doi: 10.12998/wjcc.v8.i9.1608
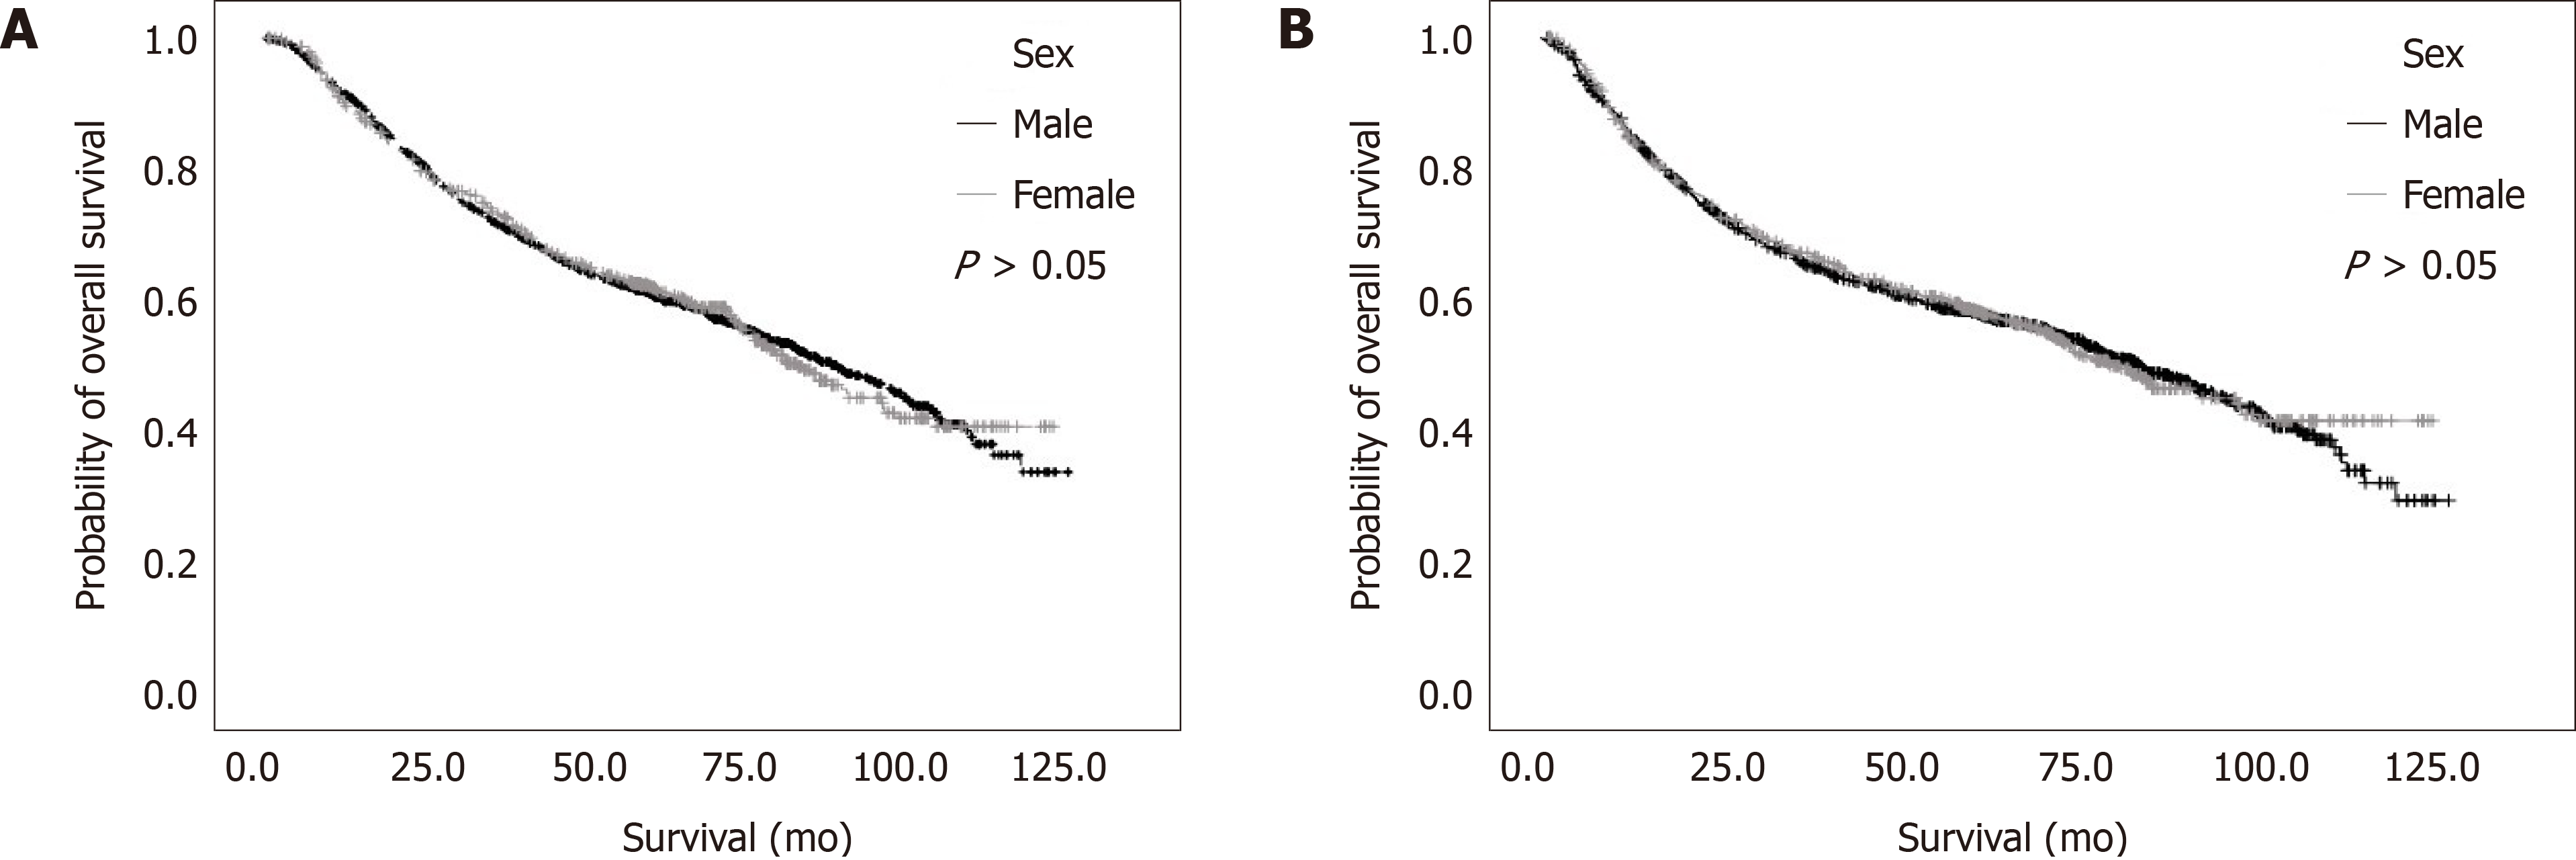
Figure 1 Kaplan-Meier curves.
A: Overall survival; B: Relapse-free survival according to sex.
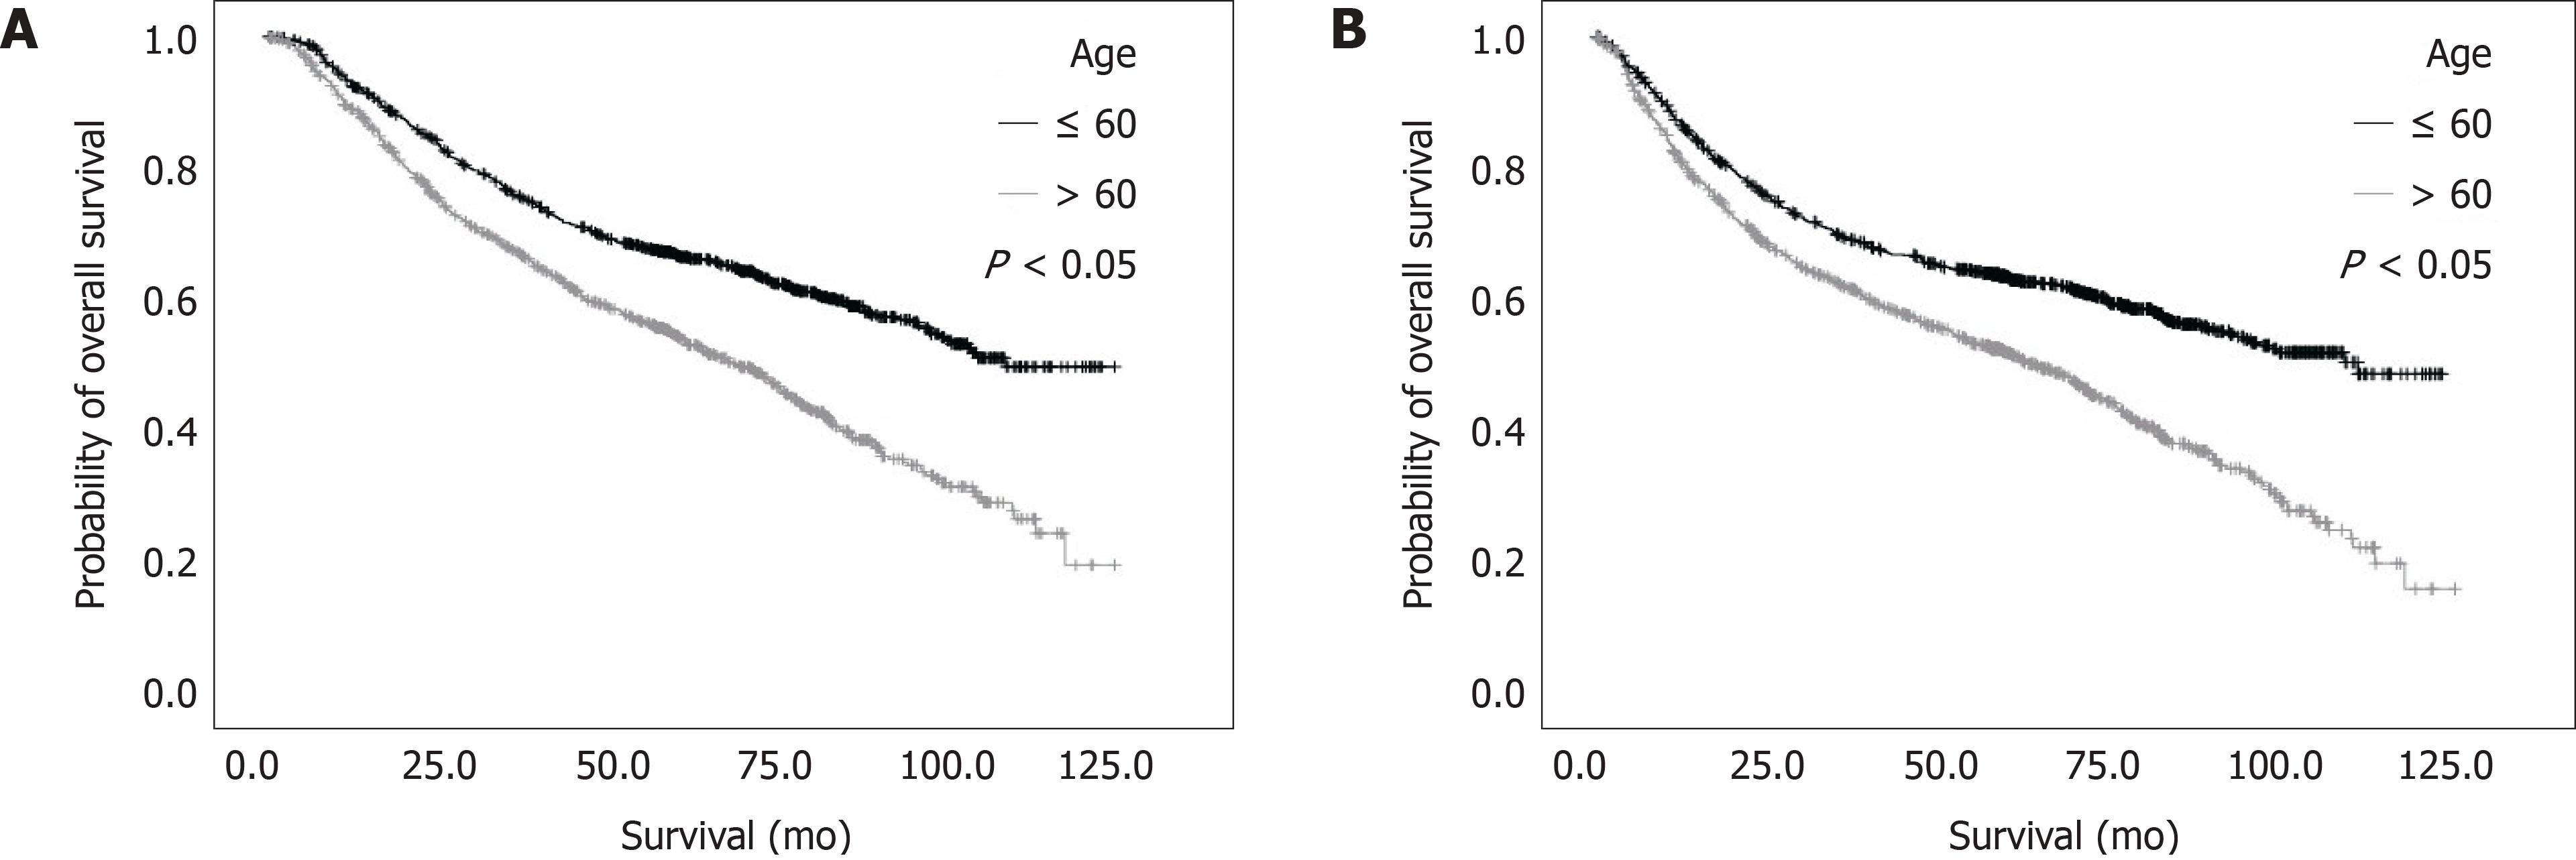
Figure 2 Kaplan-Meier curves.
A: Overall survival; B: Relapse-free survival according to age.
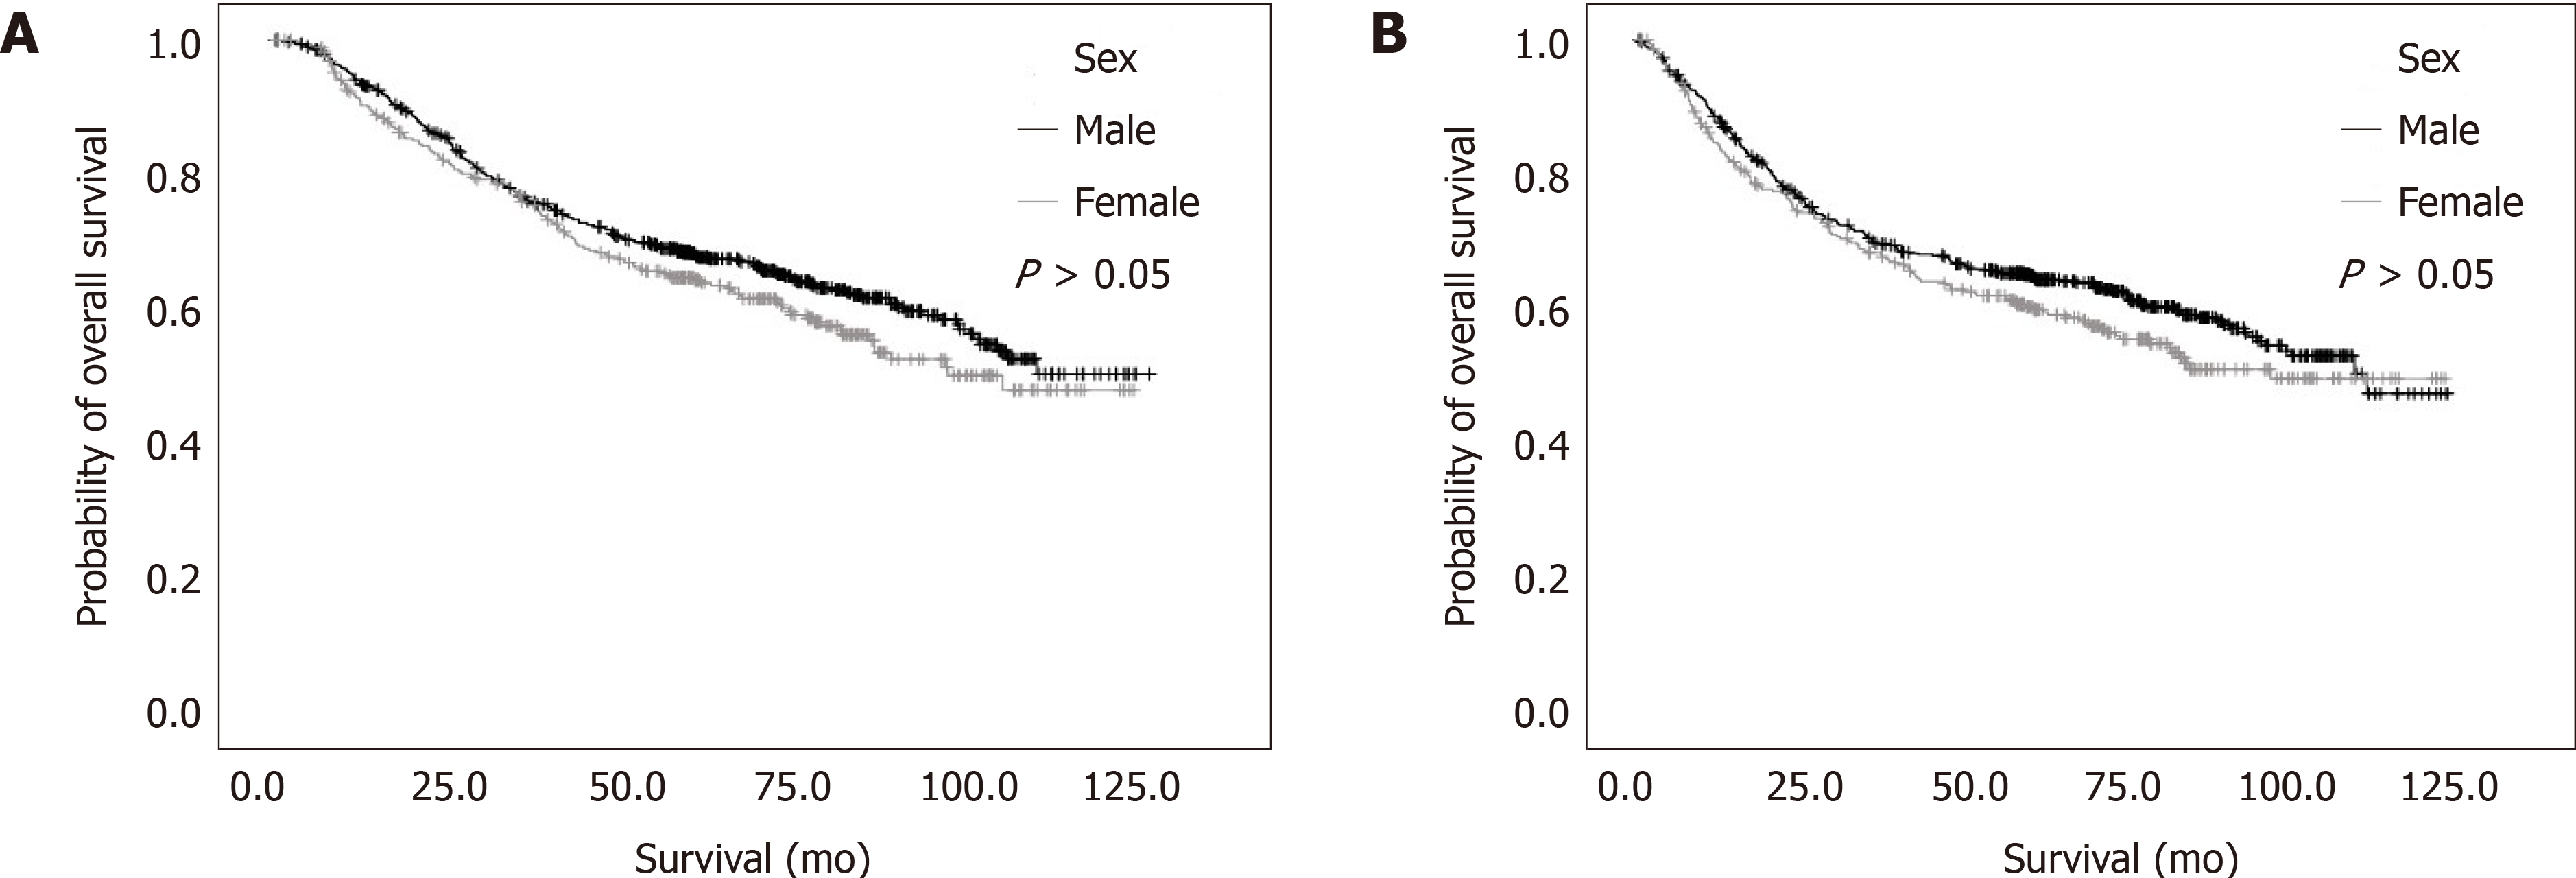
Figure 3 Kaplan-Meier curves.
A: Overall survival; B: Relapse-free survival according to sex among younger patients (≤ 60 years old).
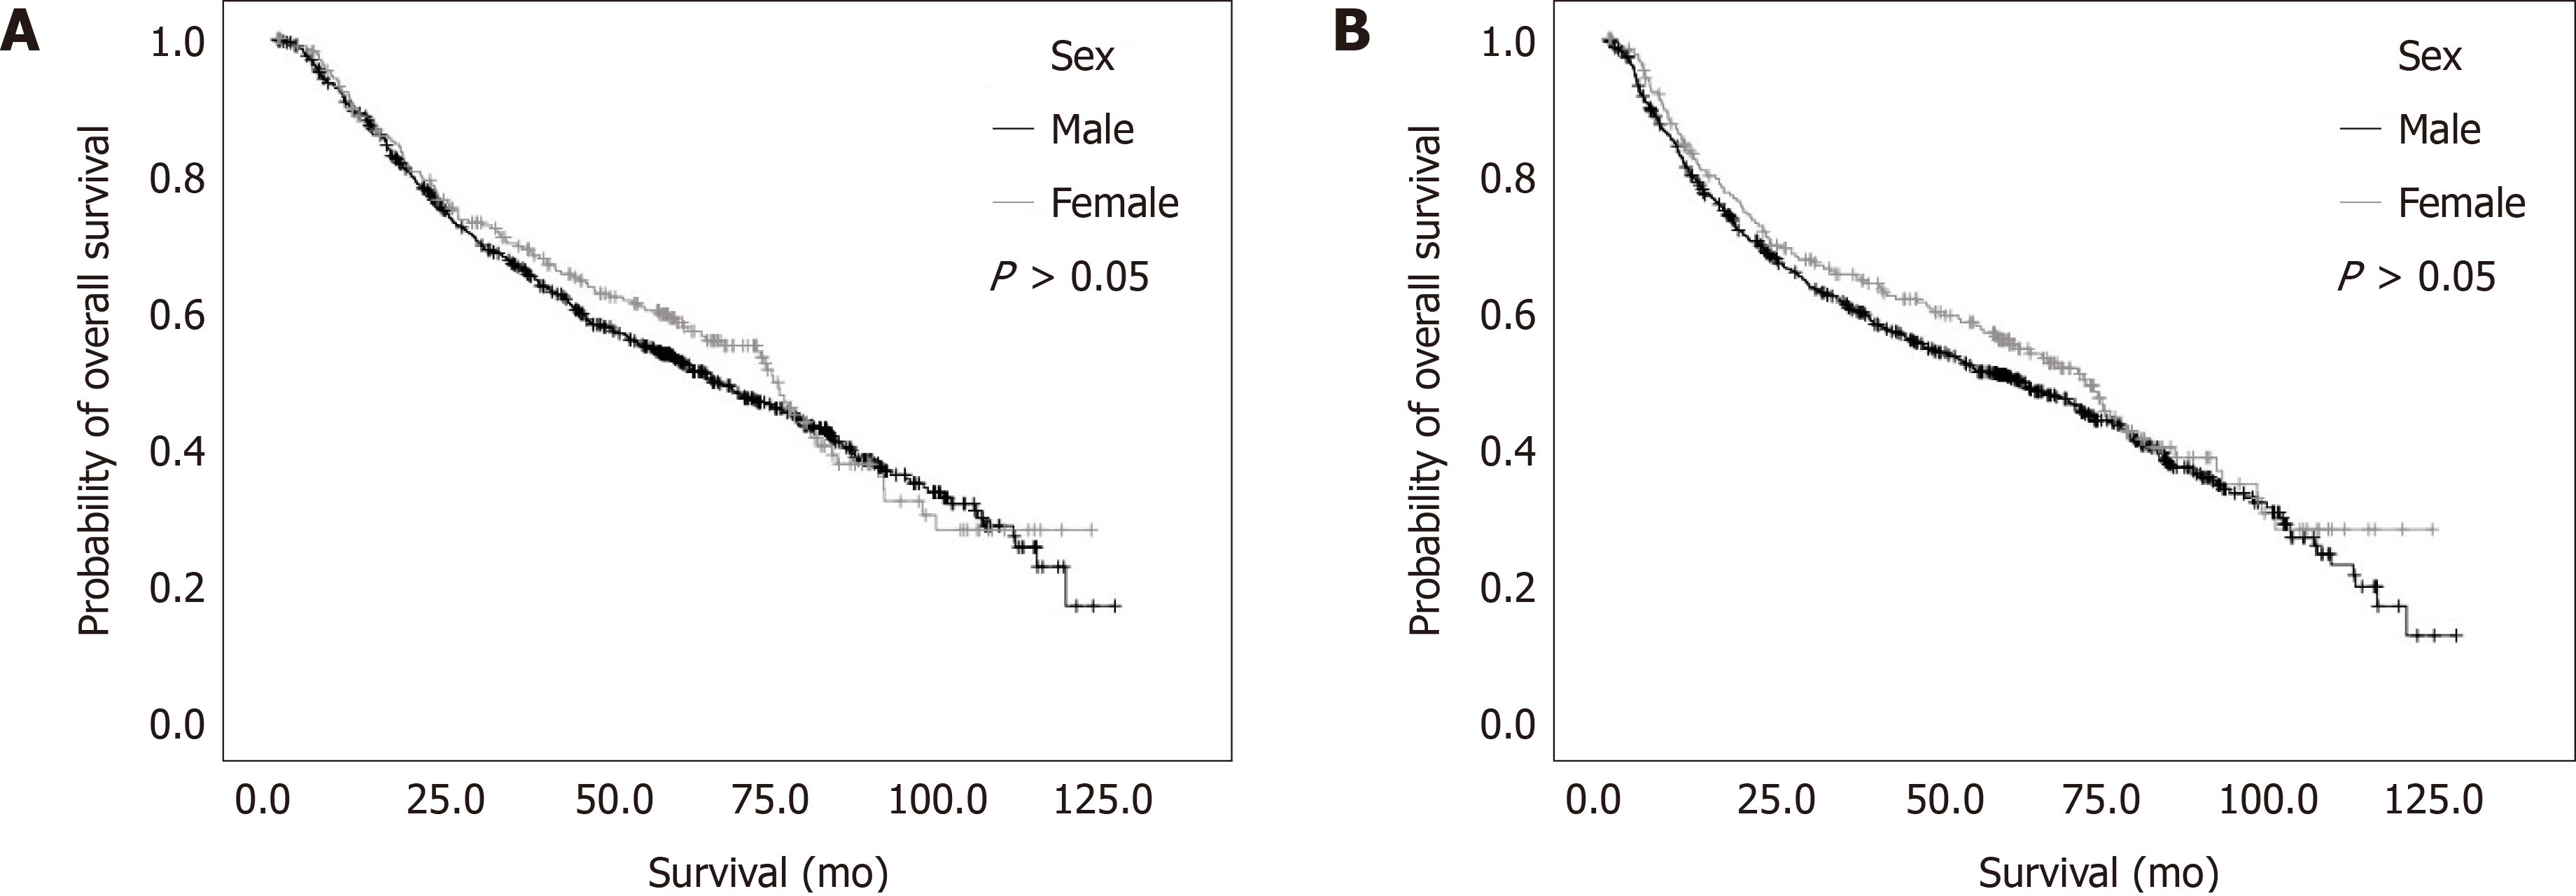
Figure 4 Kaplan-Meier curves.
A: Overall survival; B: Relapse-free survival according to sex among older patients (> 60 years old).
- Citation: Alshehri A, Alanezi H, Kim BS. Prognosis factors of advanced gastric cancer according to sex and age. World J Clin Cases 2020; 8(9): 1608-1619
- URL: https://www.wjgnet.com/2307-8960/full/v8/i9/1608.htm
- DOI: https://dx.doi.org/10.12998/wjcc.v8.i9.1608


