Copyright
©The Author(s) 2020.
World J Clin Cases. Apr 26, 2020; 8(8): 1495-1501
Published online Apr 26, 2020. doi: 10.12998/wjcc.v8.i8.1495
Published online Apr 26, 2020. doi: 10.12998/wjcc.v8.i8.1495
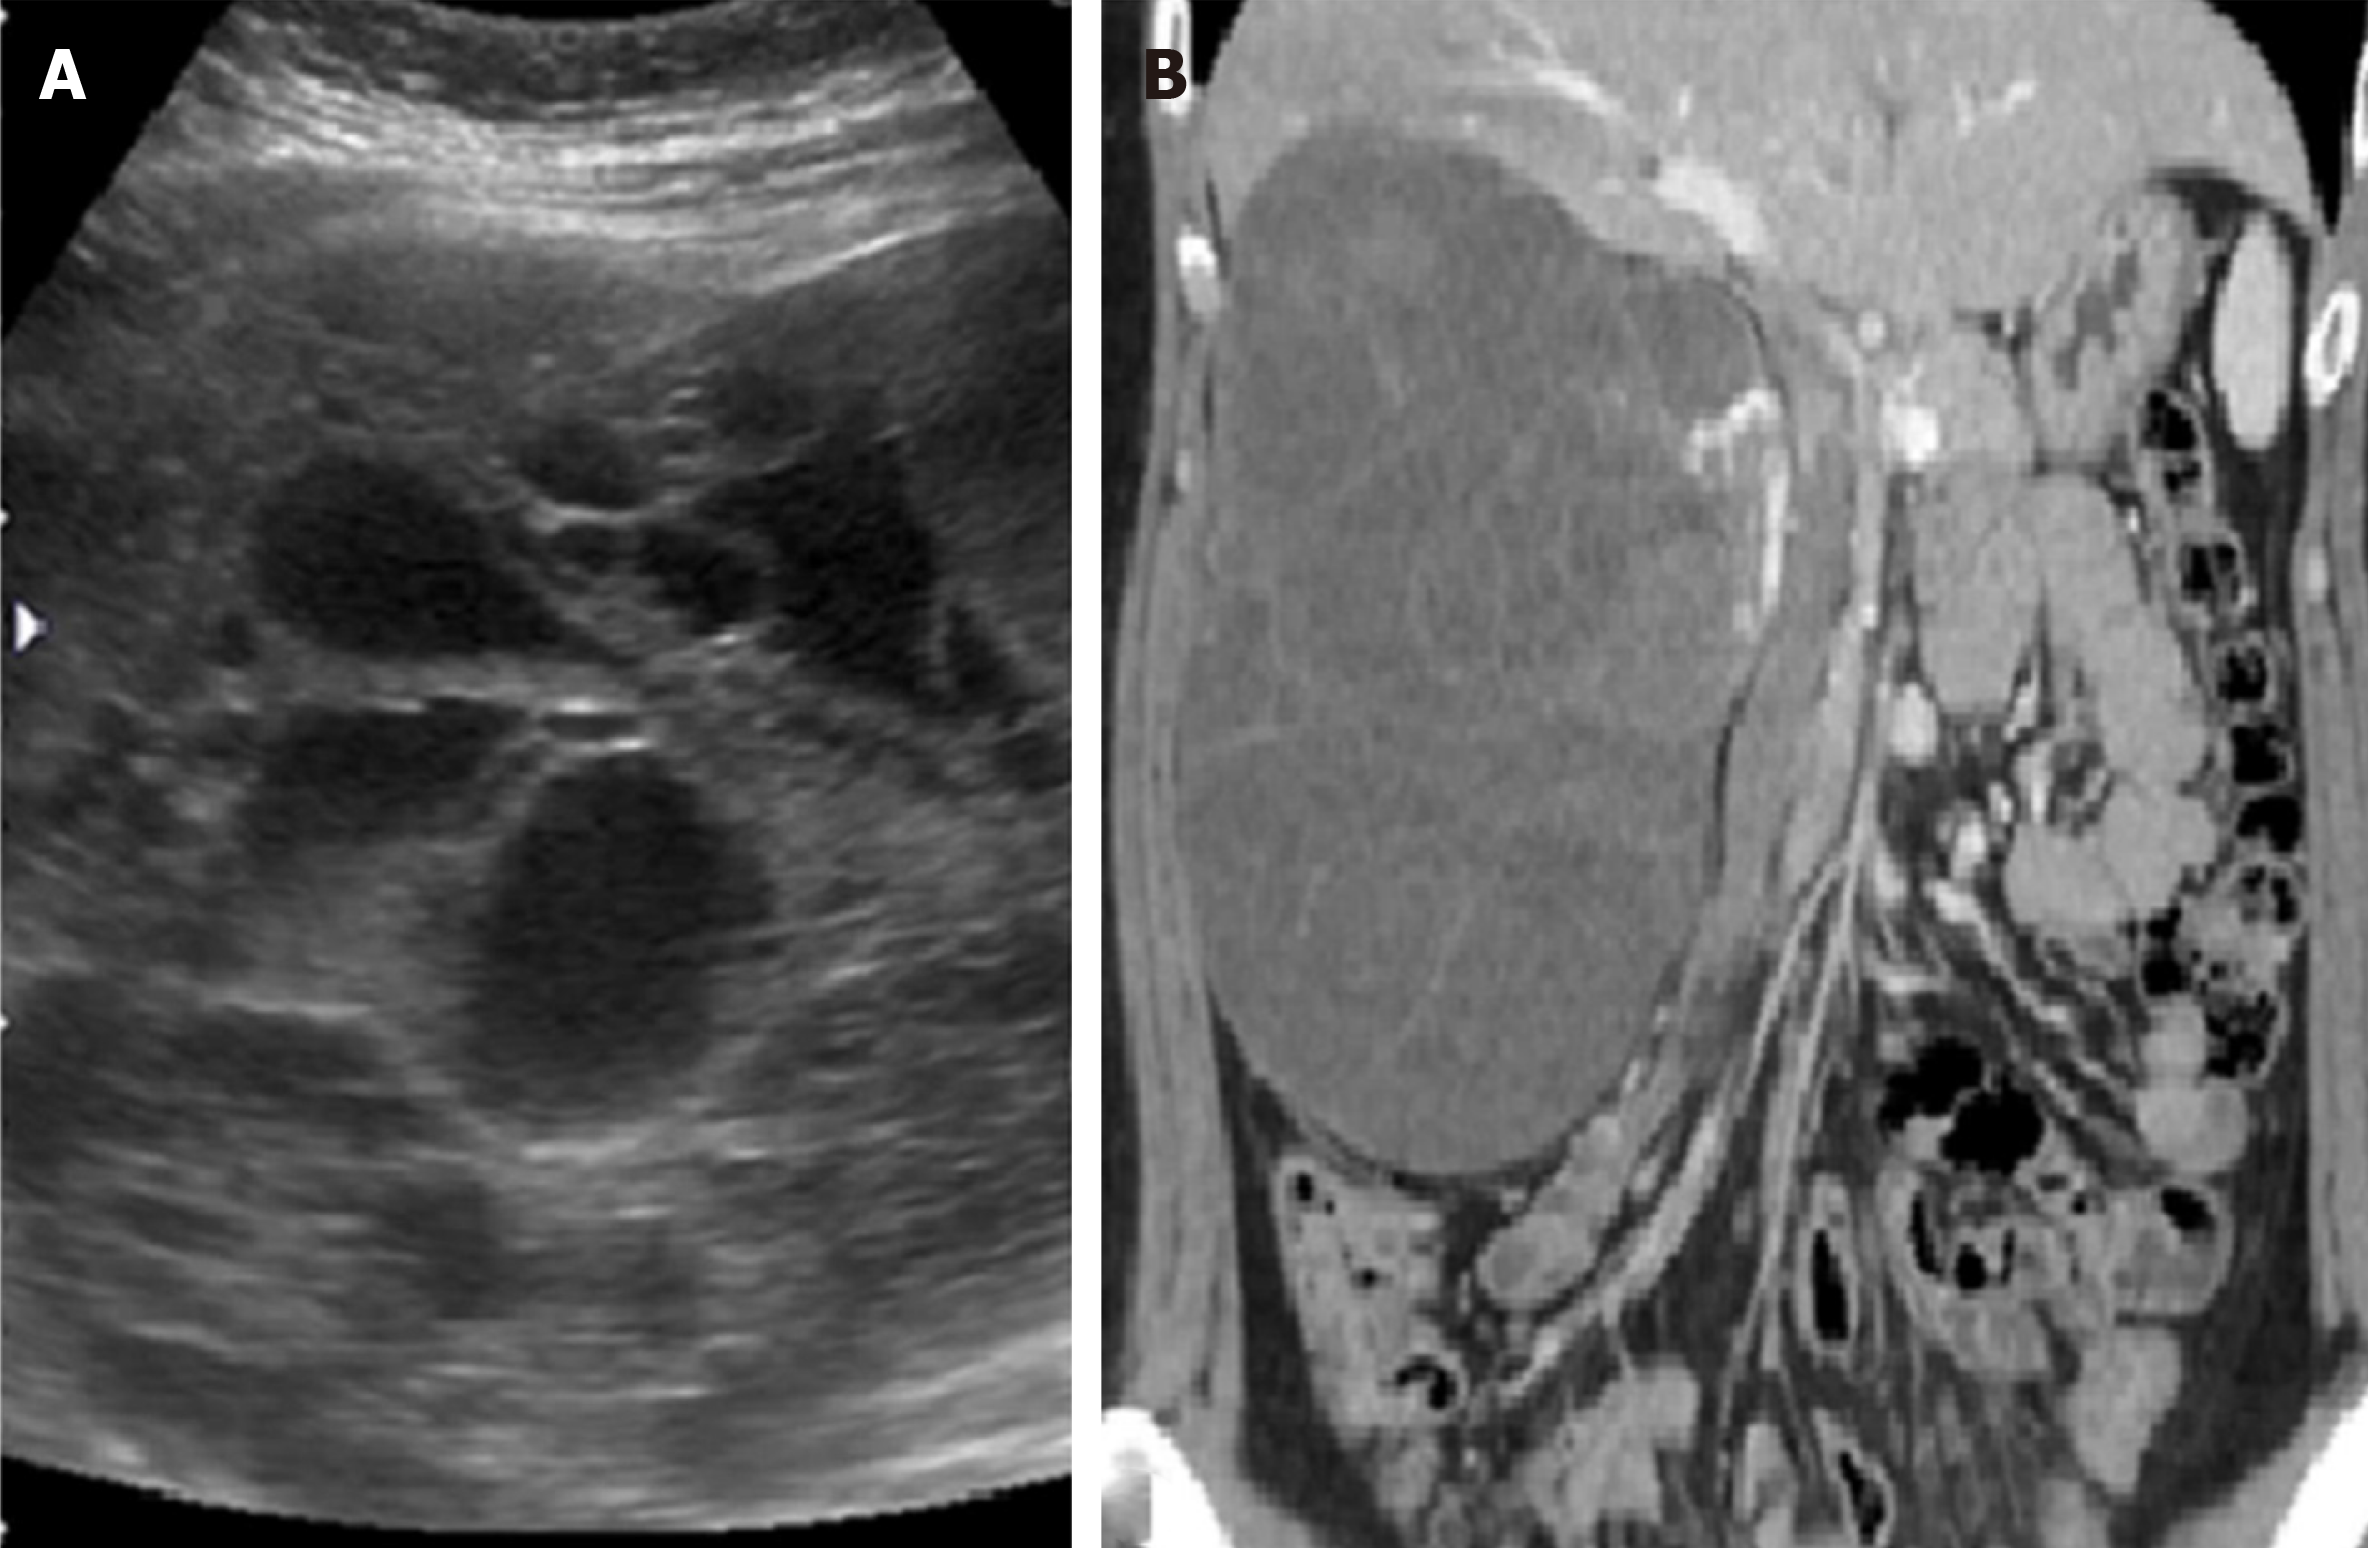
Figure 1 Image of sonography and computed tomography.
A: Sonography; B: Computed tomography. Discordant features of the renal anaplastic sarcoma in the image studies of sonography and computed tomography.
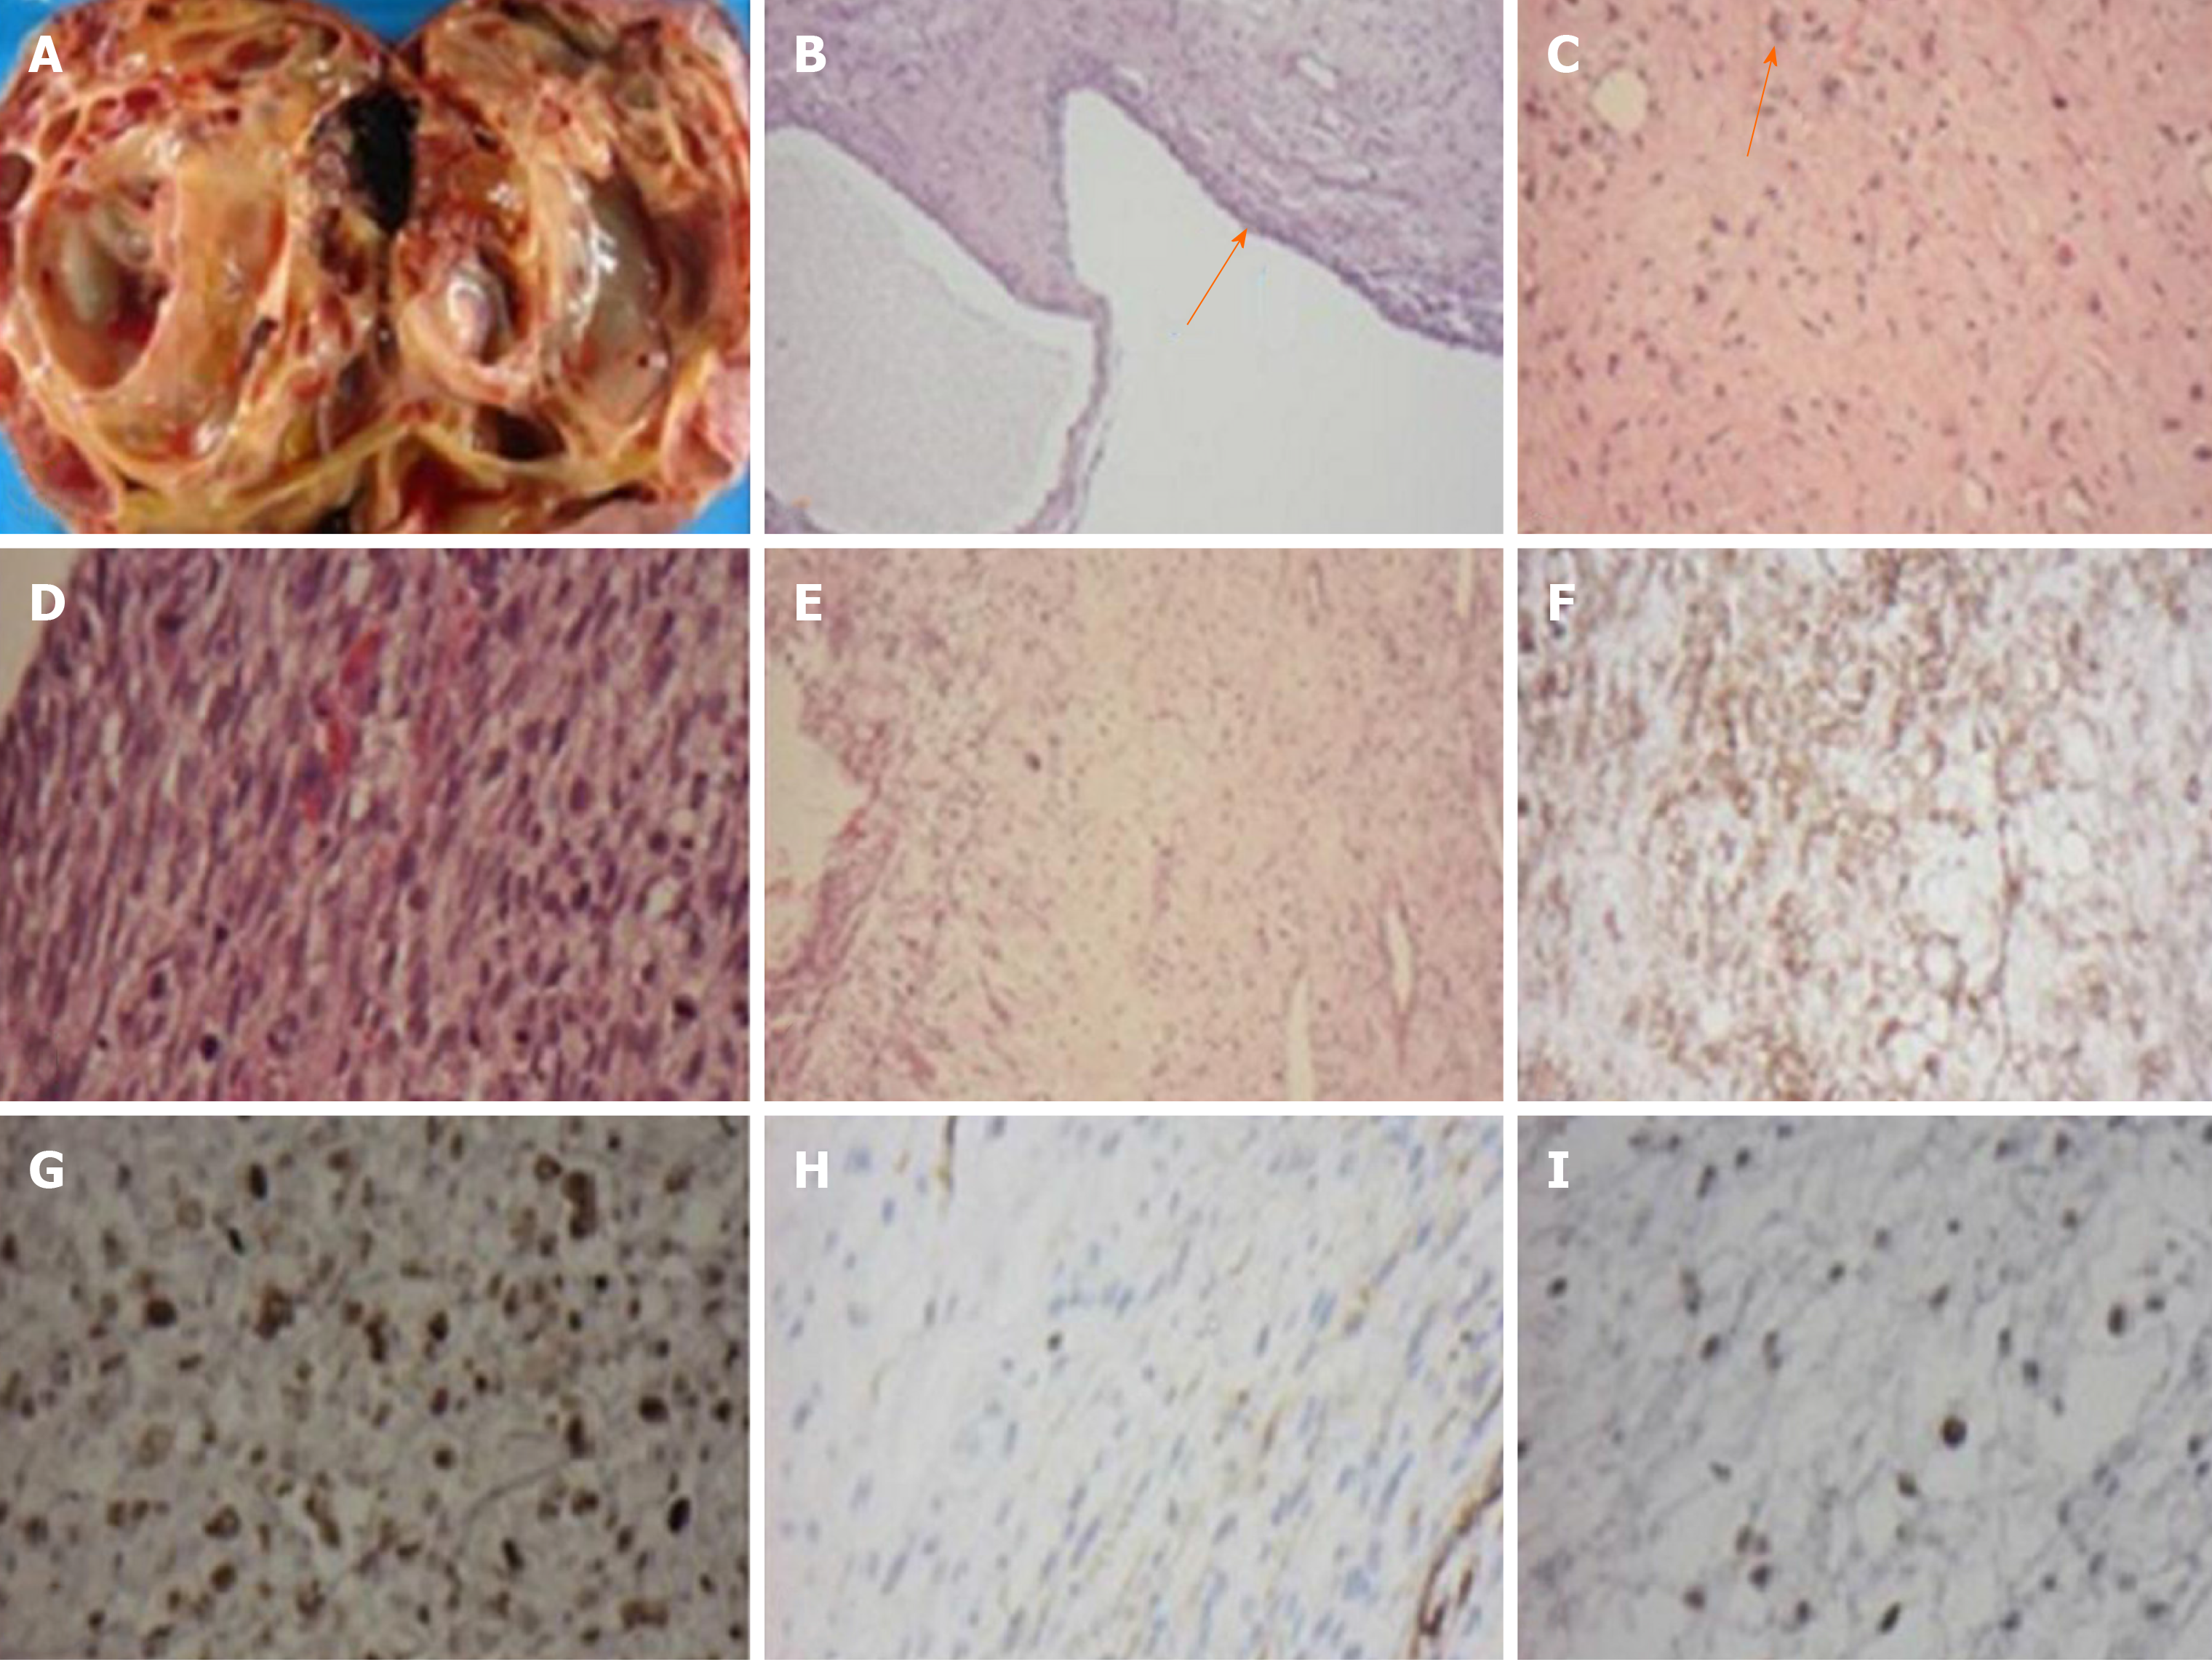
Figure 2 Gross and microscopic findings of the anaplastic sarcoma of the kidney.
A: The cut surface of the kidney showing multiloculated cysts with the solid component; B: The cystic spaces lined by low cuboidal epithelium (arrow) (H&E stain 200 ×); C: The solid areas displaying spindle cells admixed with large multinucleated cells (arrow) (H&E stain 200 ×); D: Cellular areas showing spindle cells with frequent mitosis (H&E stain 400 ×); E: The tumor displaying myxoid changes in focal areas (H&E stain 200 ×); F: CD56 Immunohistochemical stain showing diffuse positive membrane stain (200 ×); G: Tumor cells showing a positive nuclear pattern with anti-P53 (400 ×); H: Tumor cells showing focal positivity for desmin. Immunohistochemical stain (200 ×); I: Tumor cells showing focal positivity for WT-1, nuclear pattern. Immunohistochemical stain (400 ×).
- Citation: Kao JL, Tsung SH, Shiao CC. Rare anaplastic sarcoma of the kidney: A case report. World J Clin Cases 2020; 8(8): 1495-1501
- URL: https://www.wjgnet.com/2307-8960/full/v8/i8/1495.htm
- DOI: https://dx.doi.org/10.12998/wjcc.v8.i8.1495


