Copyright
©The Author(s) 2020.
World J Clin Cases. Mar 26, 2020; 8(6): 1108-1115
Published online Mar 26, 2020. doi: 10.12998/wjcc.v8.i6.1108
Published online Mar 26, 2020. doi: 10.12998/wjcc.v8.i6.1108
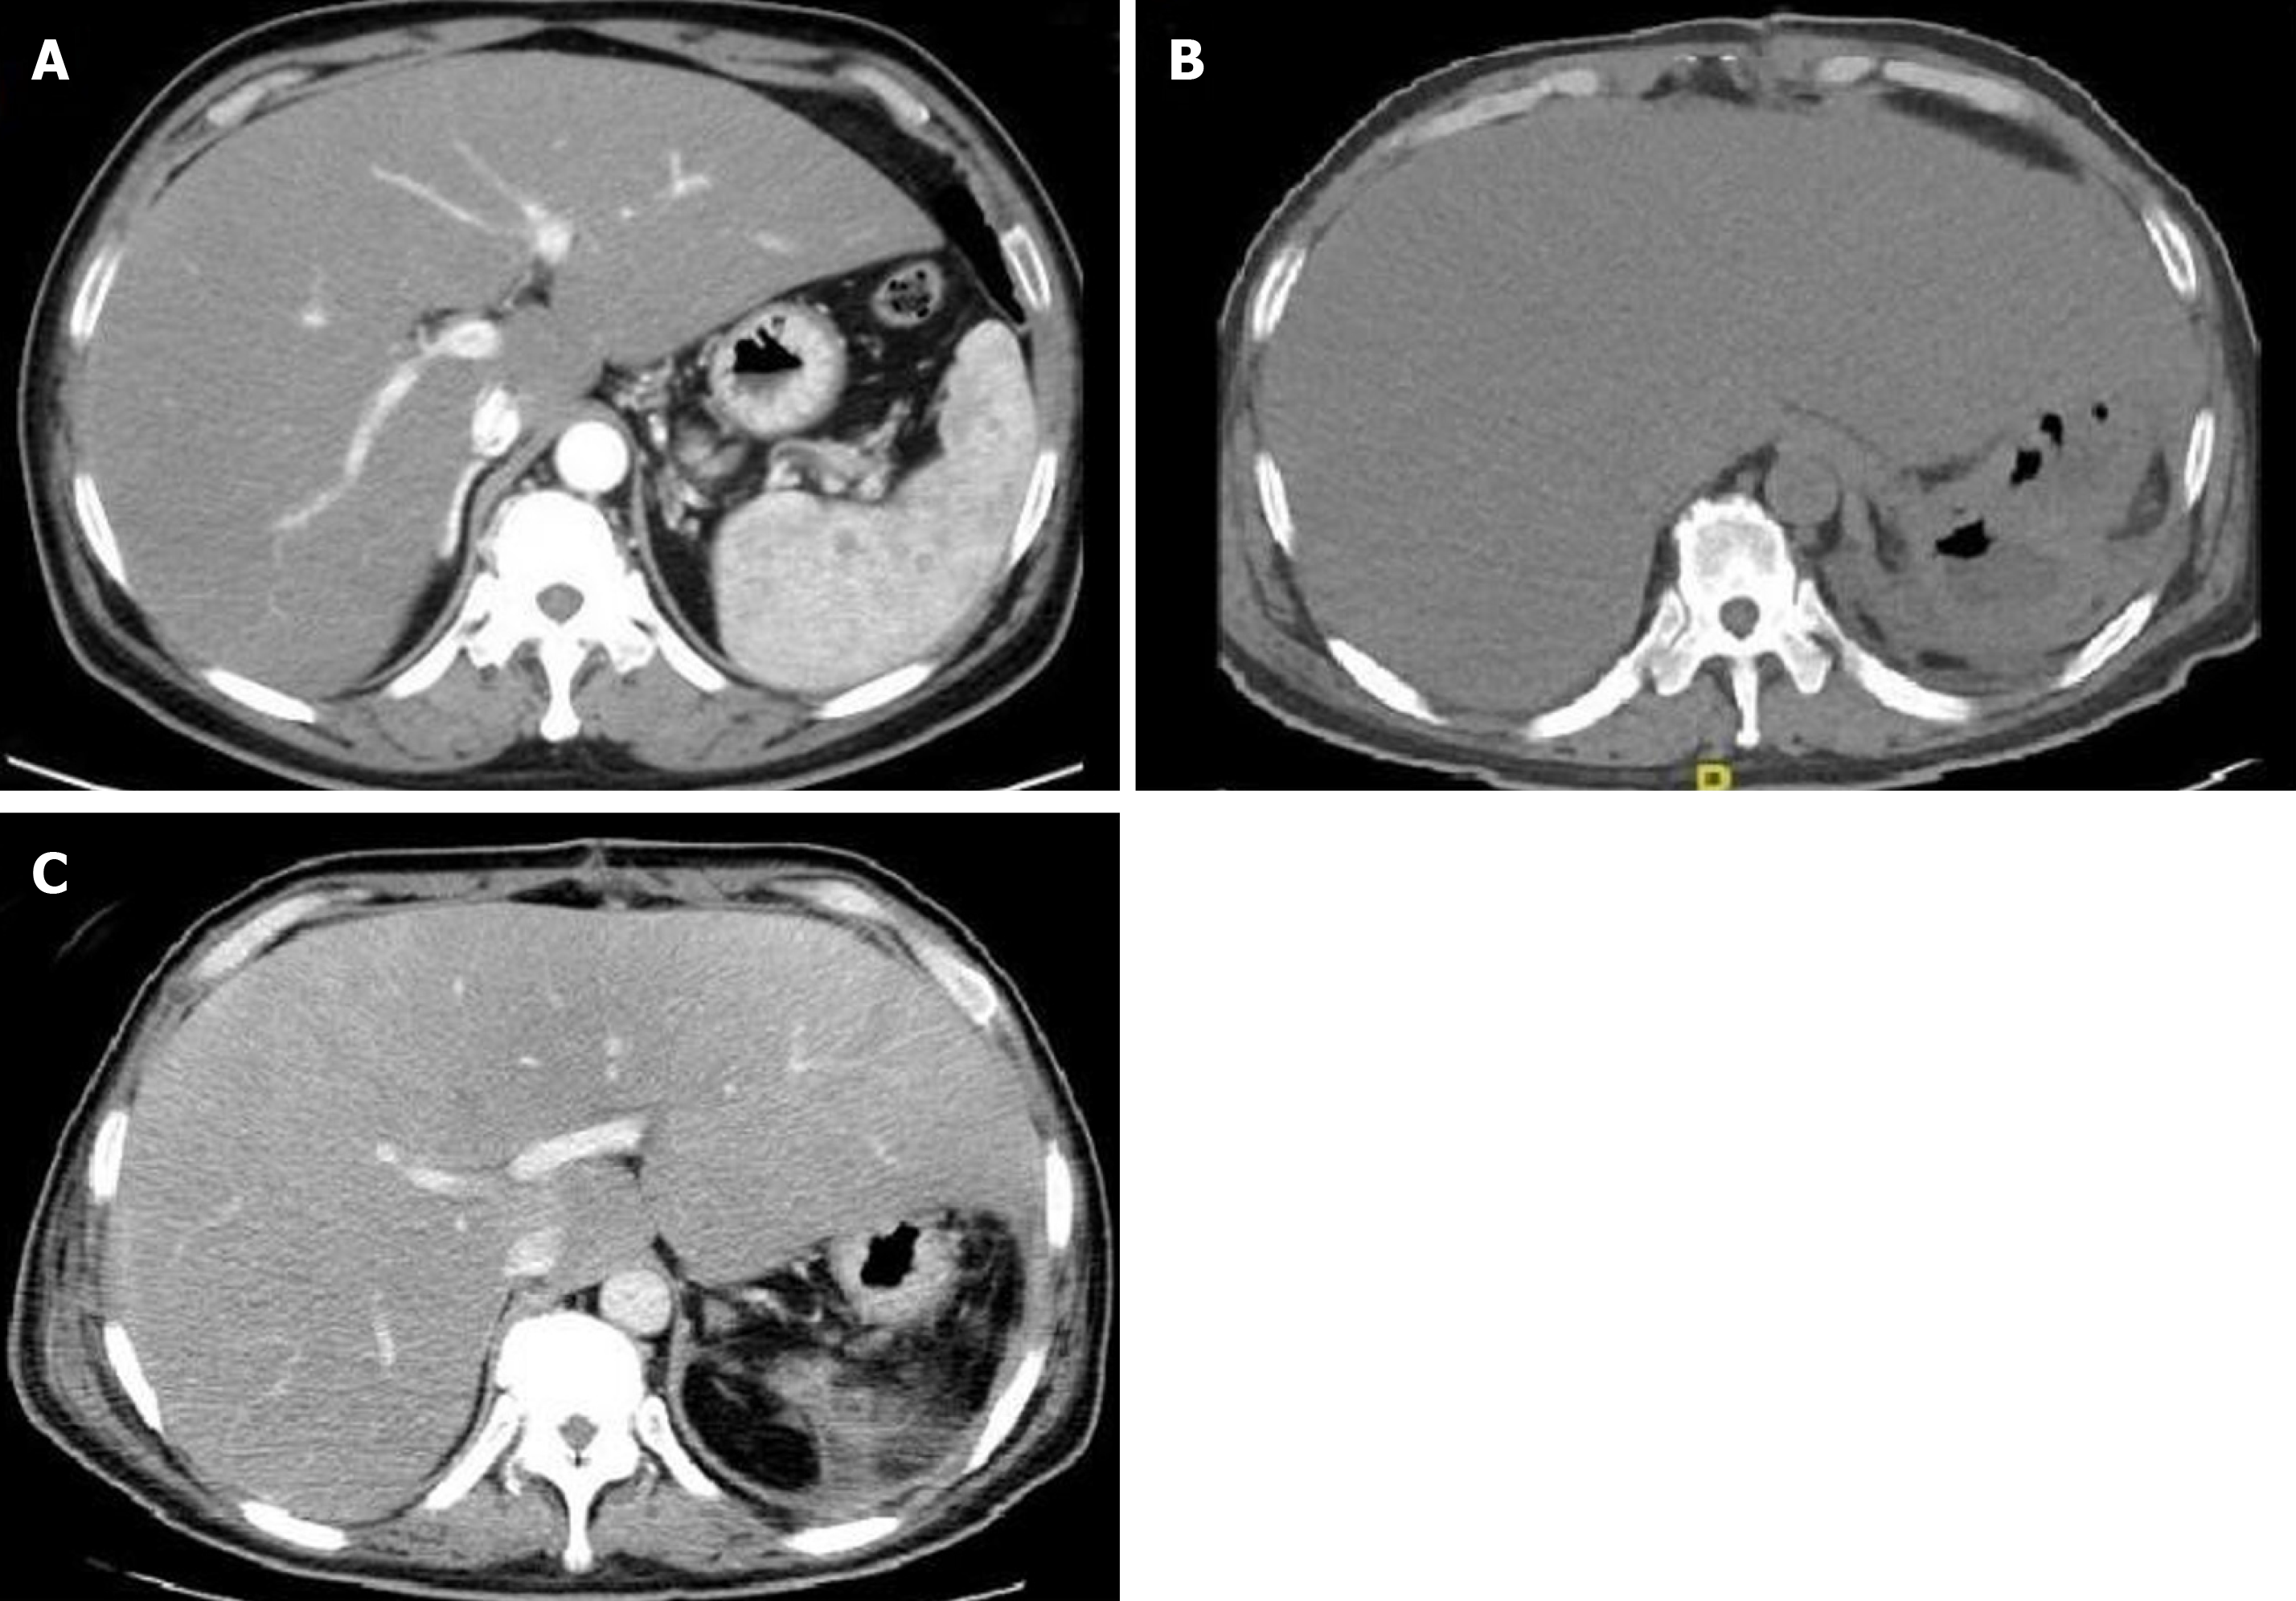
Figure 1 Computed tomography images.
A: Computed tomography (CT) scan performed 4 mo before admission showed haepatomegaly, diffuse hypodense liver lesions, and low-density plaques in the spleen; B: CT scan after surgery showed haepatomegaly and diffuse hypodense liver lesions; C: CT scan after jaundice appeared showed haepatomegaly and diffuse hypodense liver lesions.
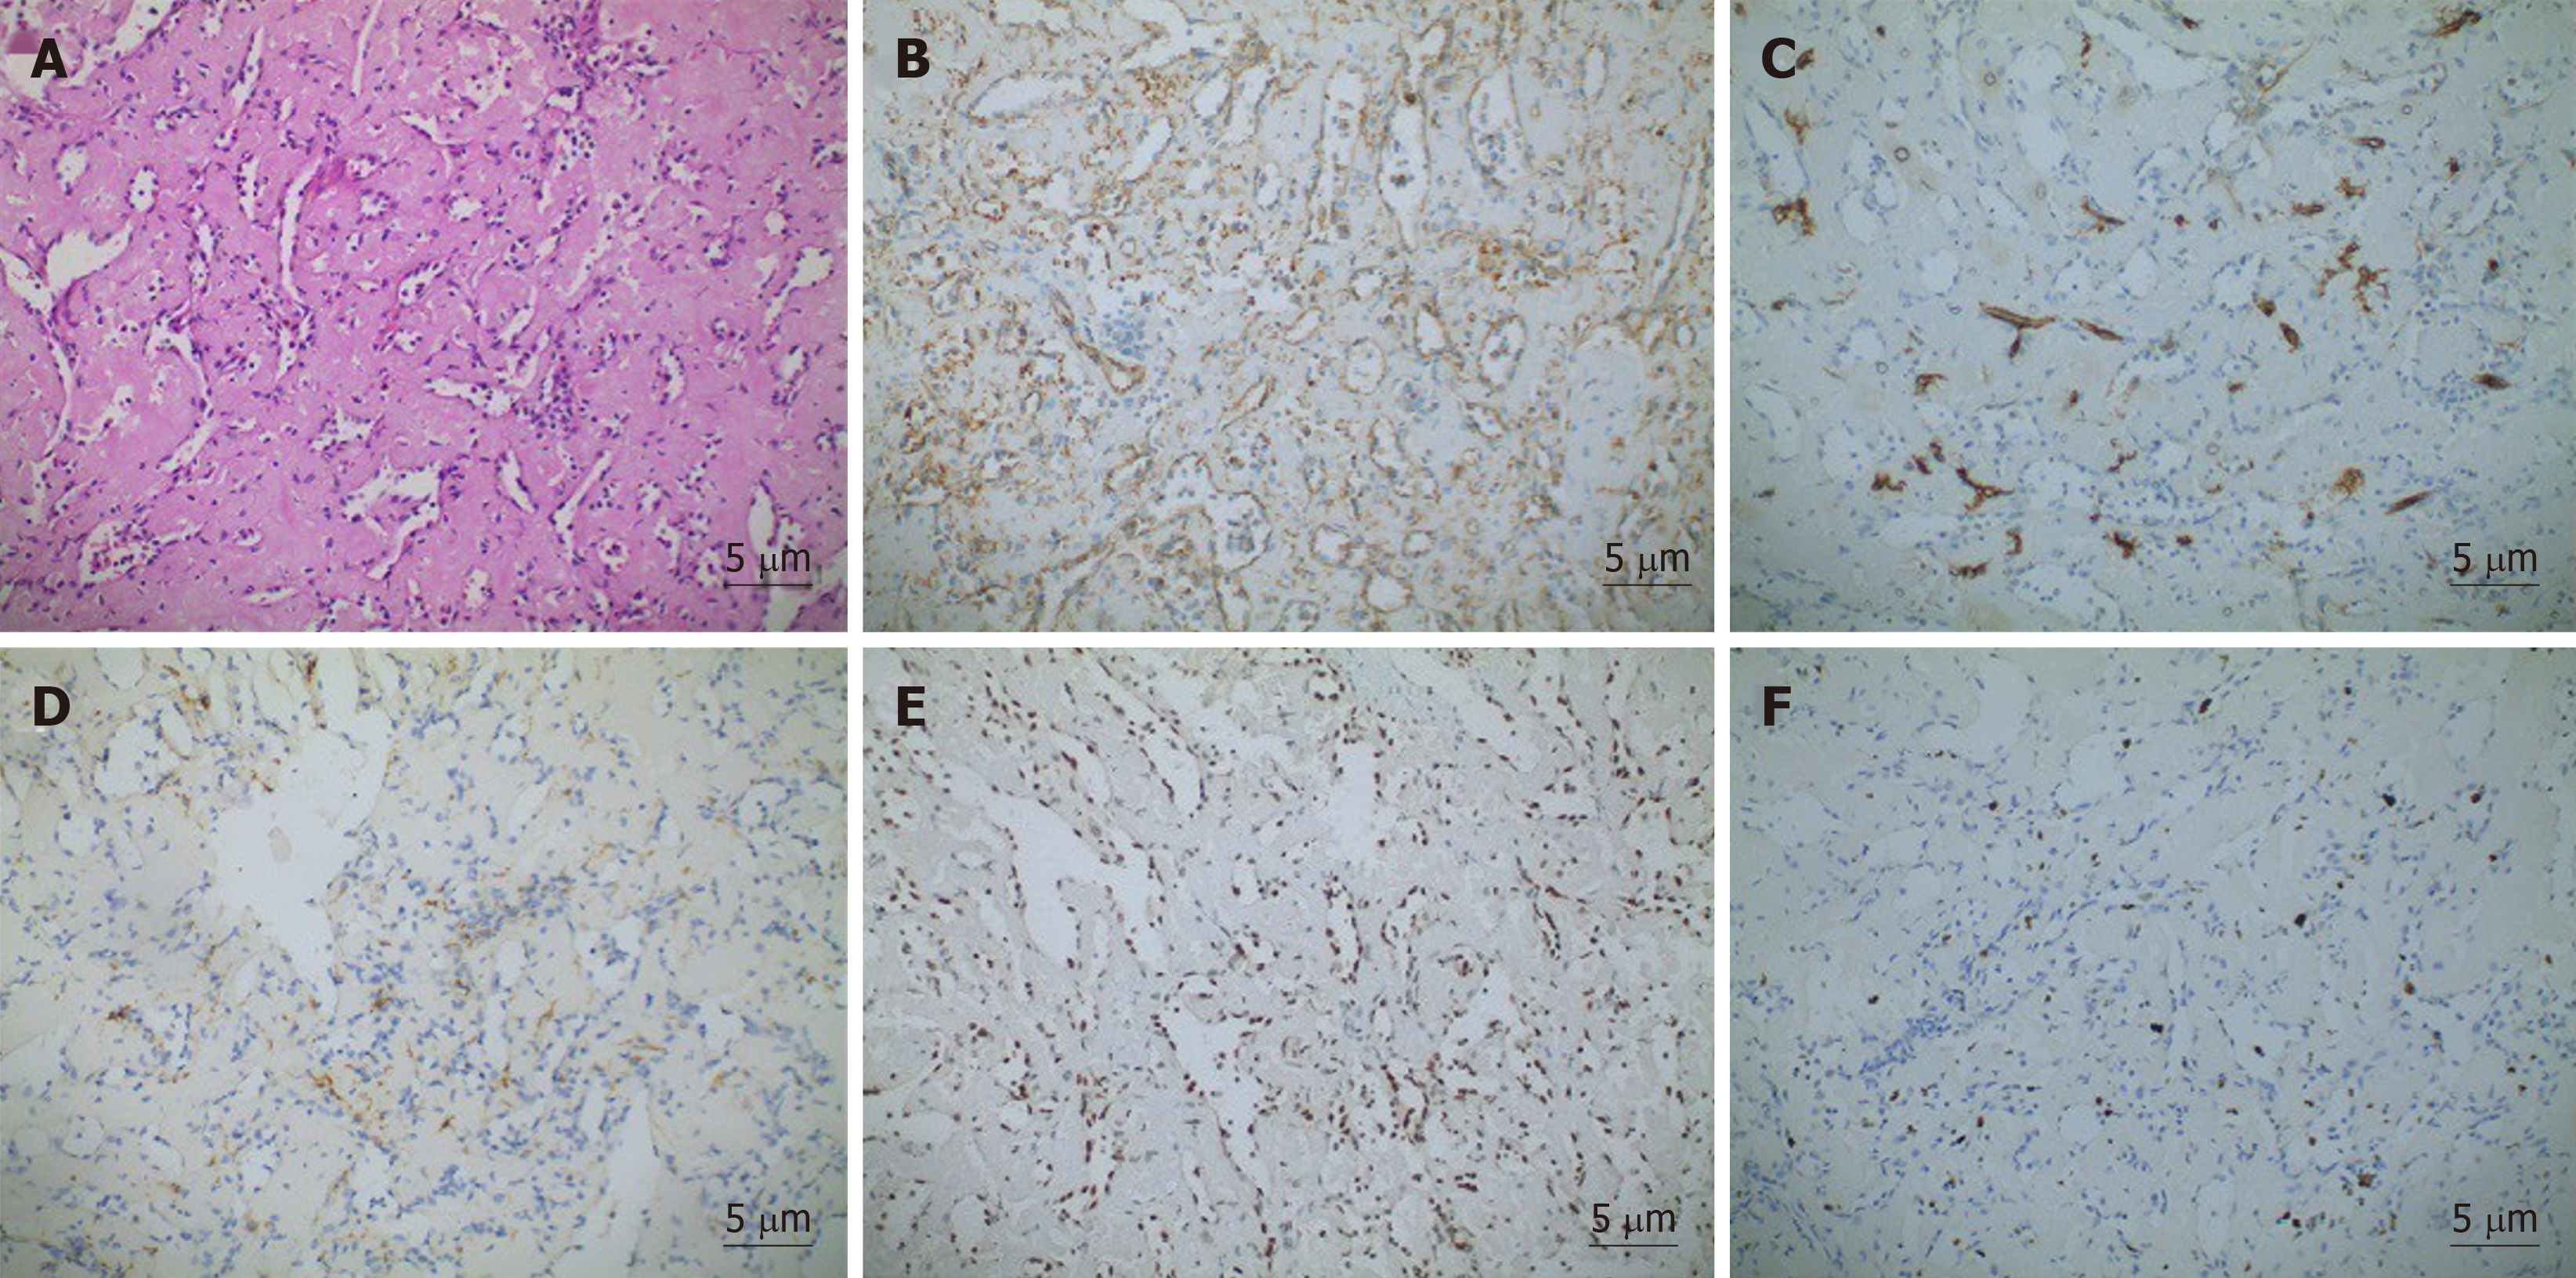
Figure 2 Microscopic appearance and immunophenotypes of the spleen.
A: Haematoxylin and eosin staining of the biopsy specimen displayed elongated arborising vessels arranged in an anastomosing pattern (Haematoxylin and eosin staining, × 200); B: Platelet endothelial cell adhesion molecule-1 [cluster of differentiation (CD) 31] (× 200); C: CD34 antigen (CD34) (× 200); D: Cytokeratin (× 200); E: Friend leukemia integration 1 (× 200); F: Ki-67 antigen (× 200).
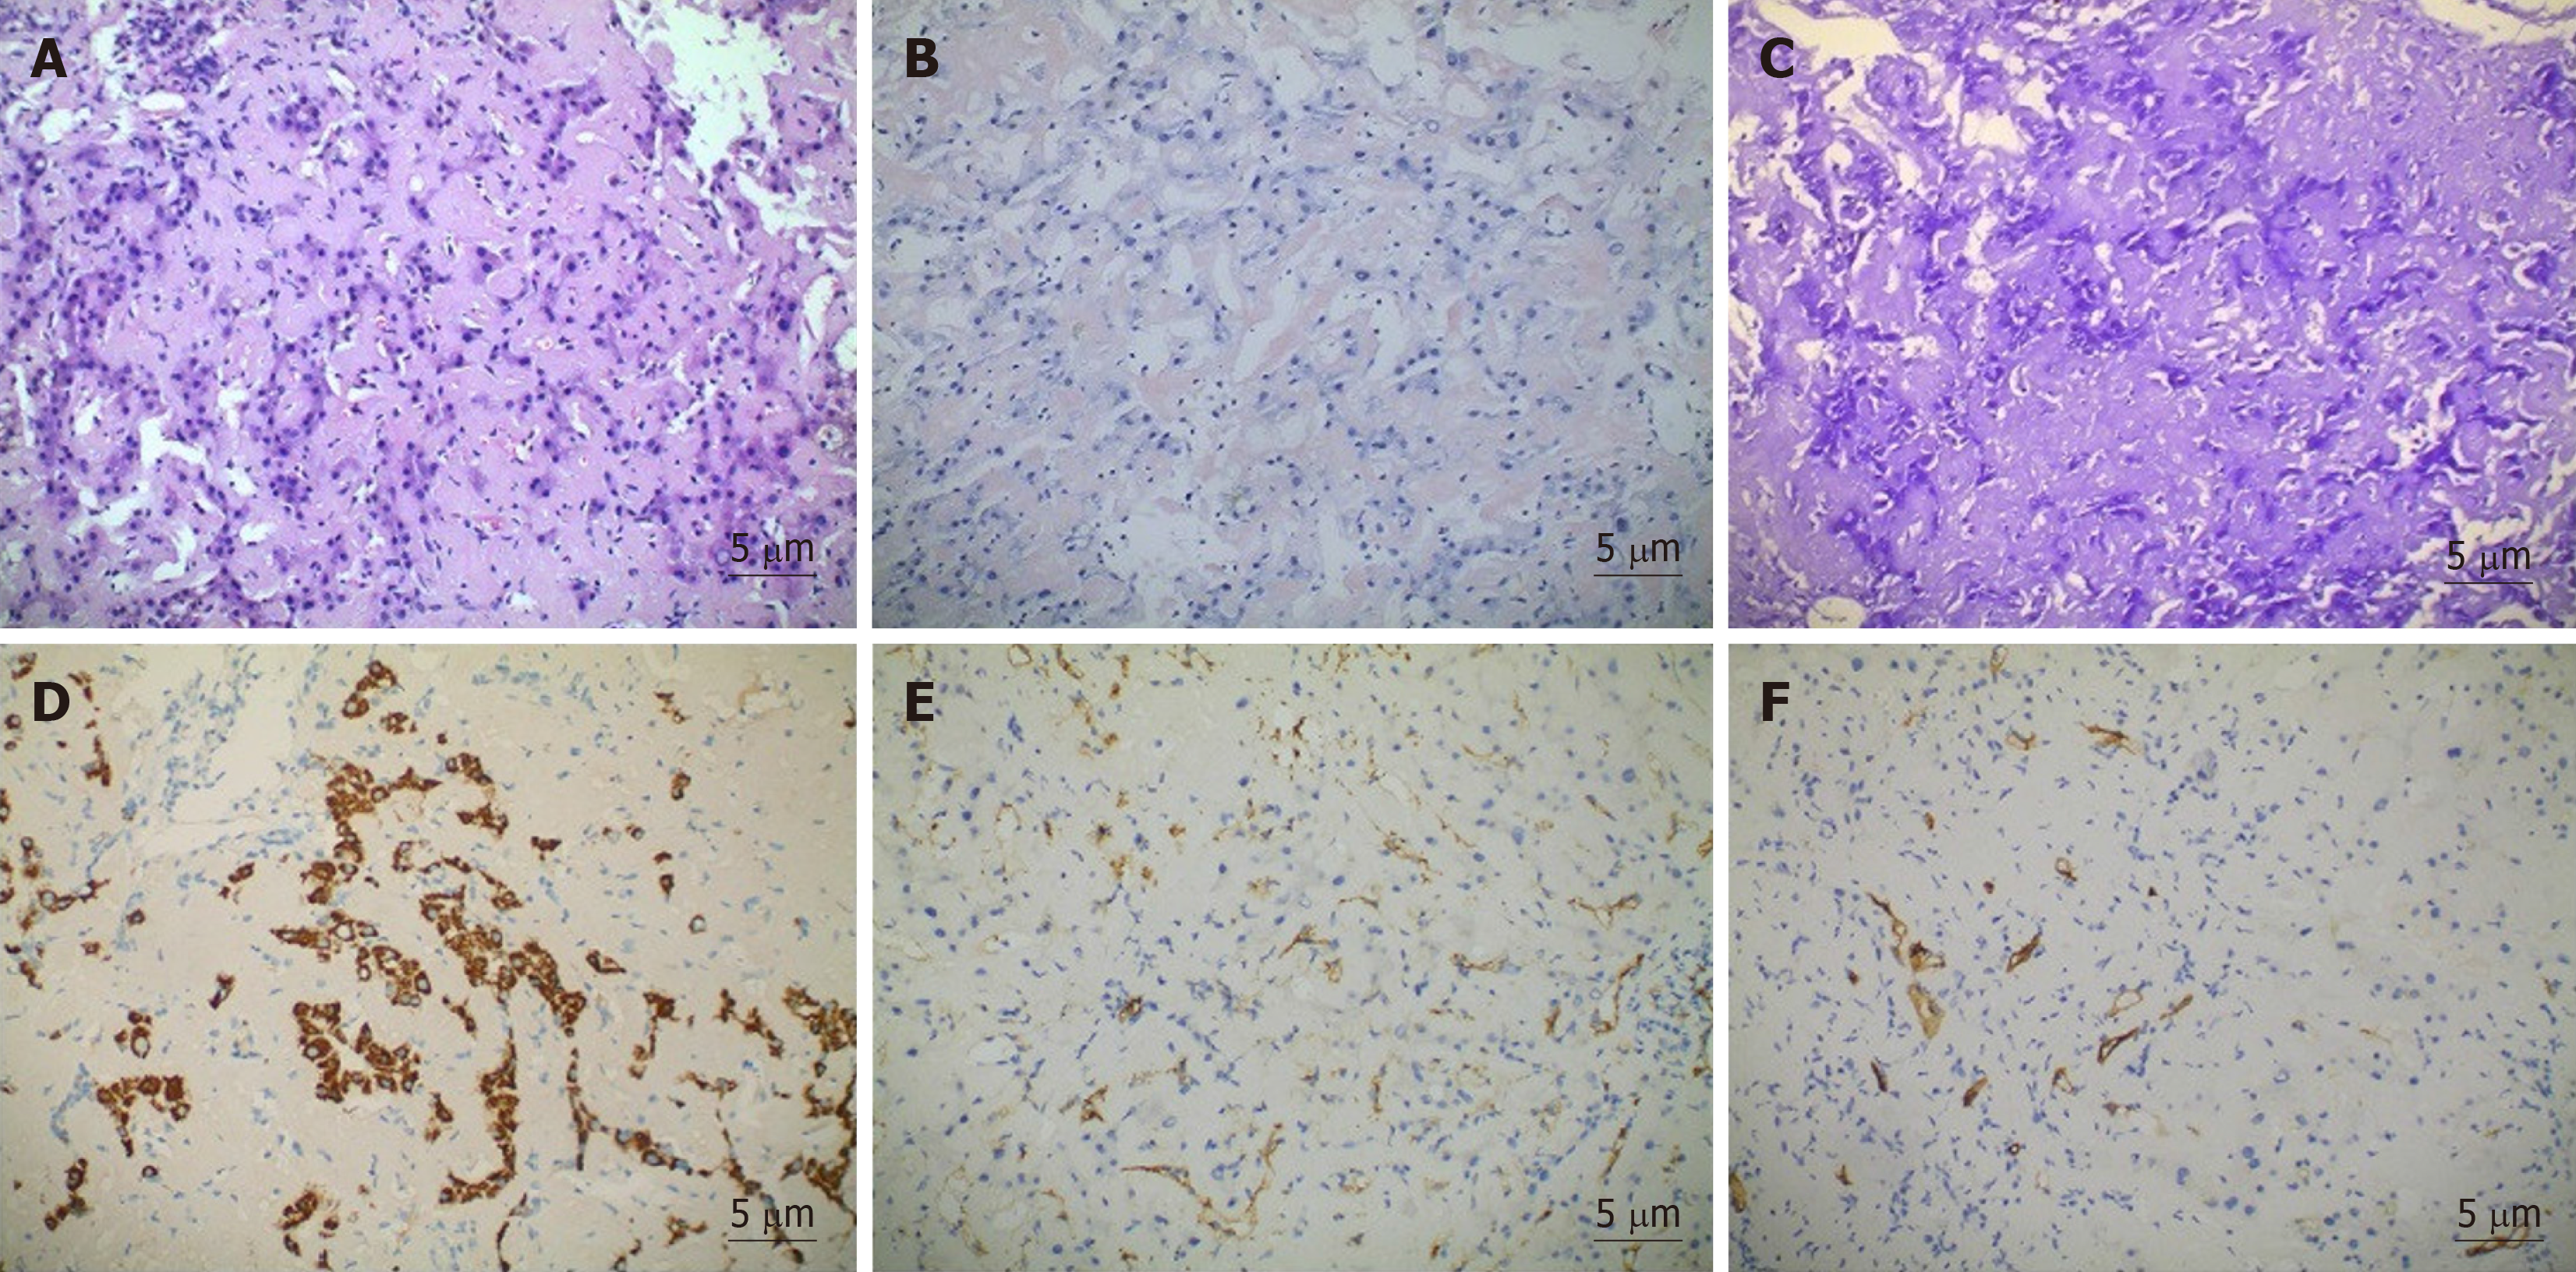
Figure 3 Microscopic appearance and immunophenotypes of liver biopsy.
A: Haematoxylin and eosin staining of the biopsy specimen revealed deposits of acellular amyloid matrix (Haematoxylin and eosin staining, × 200); B: Positive staining for Congo red could be observed; C: Positive staining for methyl violet could be observed; D: Positive staining for haepatocytes could be observed; E: Platelet endothelial cell adhesion molecule-1 [cluster of differentiation (CD) 31] (× 200); F: CD34 antigen (CD34) (× 200).
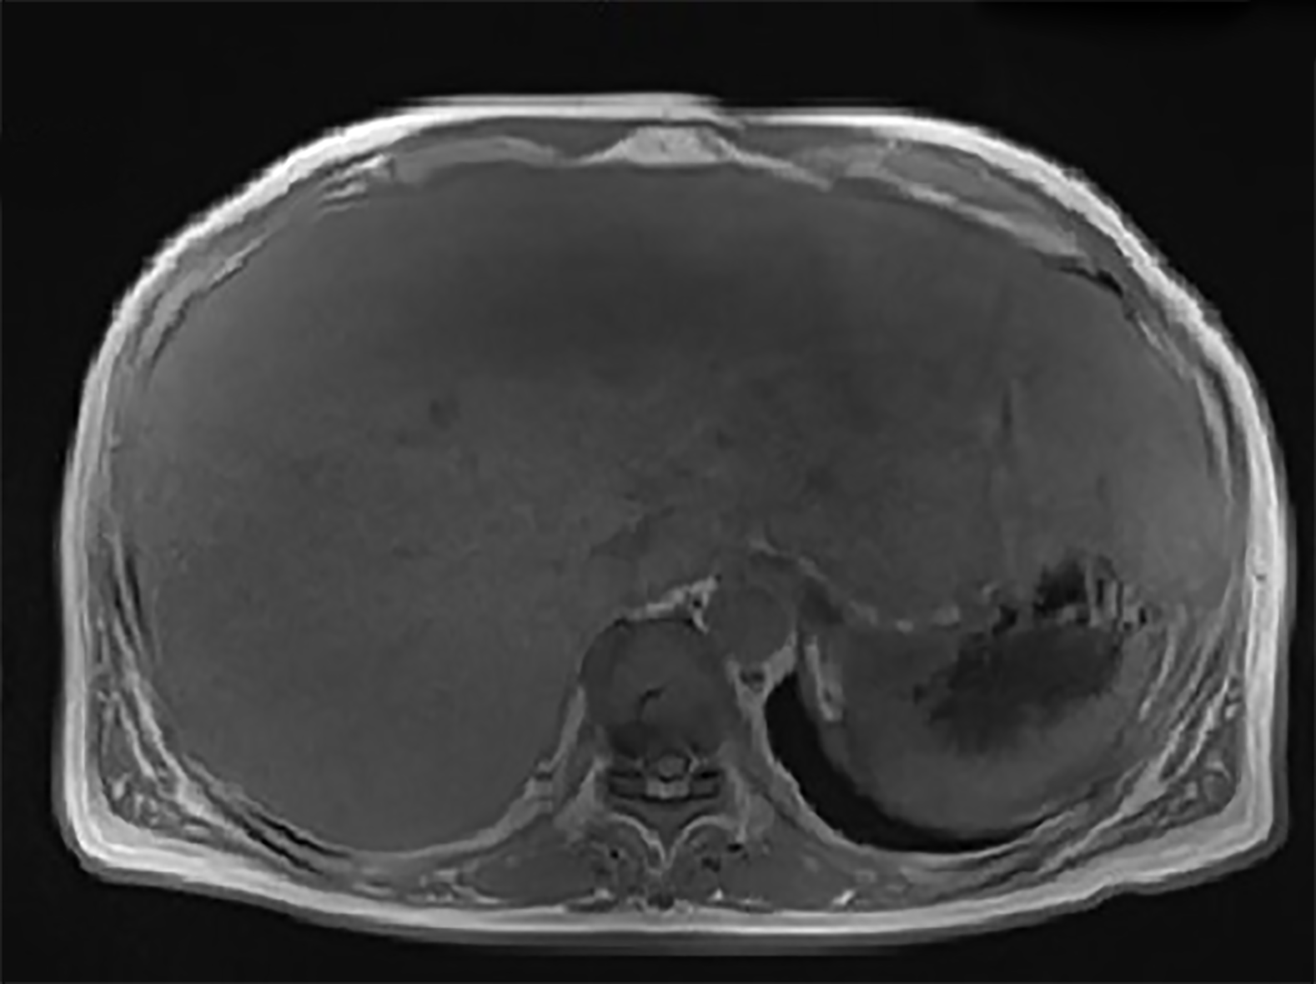
Figure 4 Magnetic resonance imaging showing diffuse haepatomegaly and even signals.
- Citation: Sun KD, Zhang YJ, Zhu LP, Yang B, Wang SY, Yu ZH, Zhang HC, Chen X. Abnormal serum carbohydrate antigen 19-9 levels in a patient with splenic retiform haemangioendothelioma concomitant with hepatic amyloidosis: A case report. World J Clin Cases 2020; 8(6): 1108-1115
- URL: https://www.wjgnet.com/2307-8960/full/v8/i6/1108.htm
- DOI: https://dx.doi.org/10.12998/wjcc.v8.i6.1108


