Copyright
©The Author(s) 2020.
World J Clin Cases. Mar 26, 2020; 8(6): 1087-1103
Published online Mar 26, 2020. doi: 10.12998/wjcc.v8.i6.1087
Published online Mar 26, 2020. doi: 10.12998/wjcc.v8.i6.1087
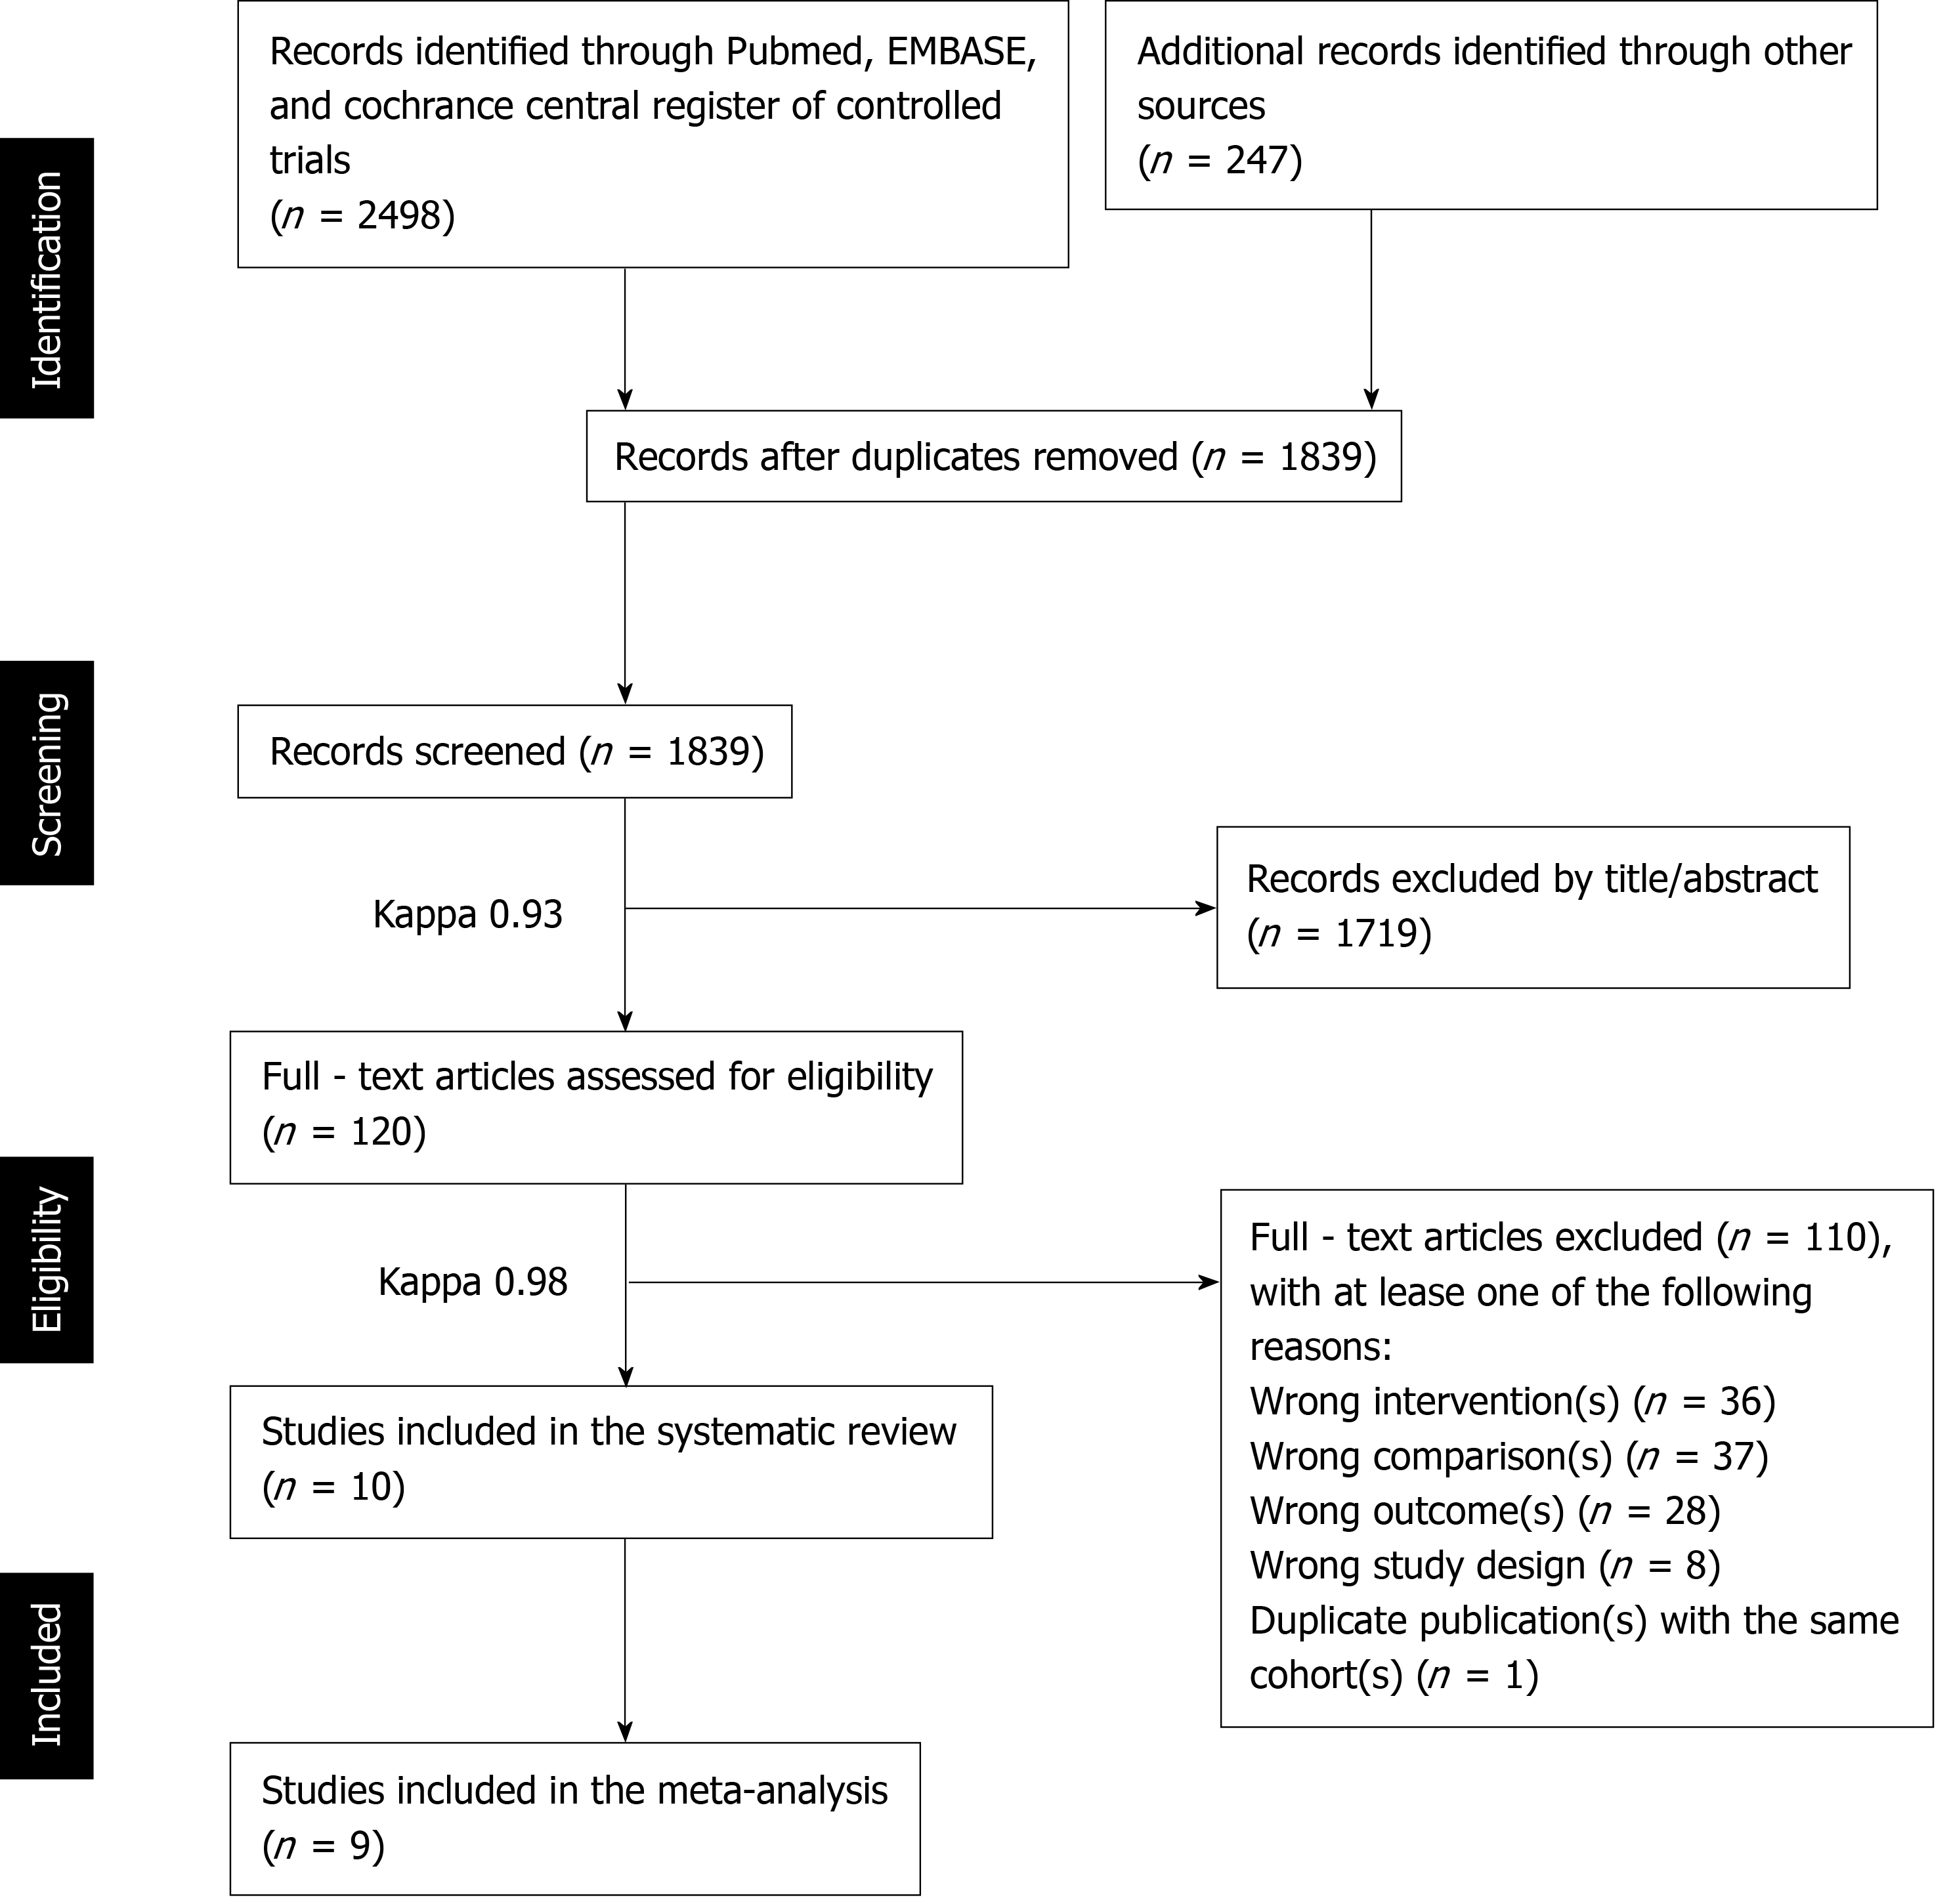
Figure 1 PRISMA flow diagram of the study selection process.
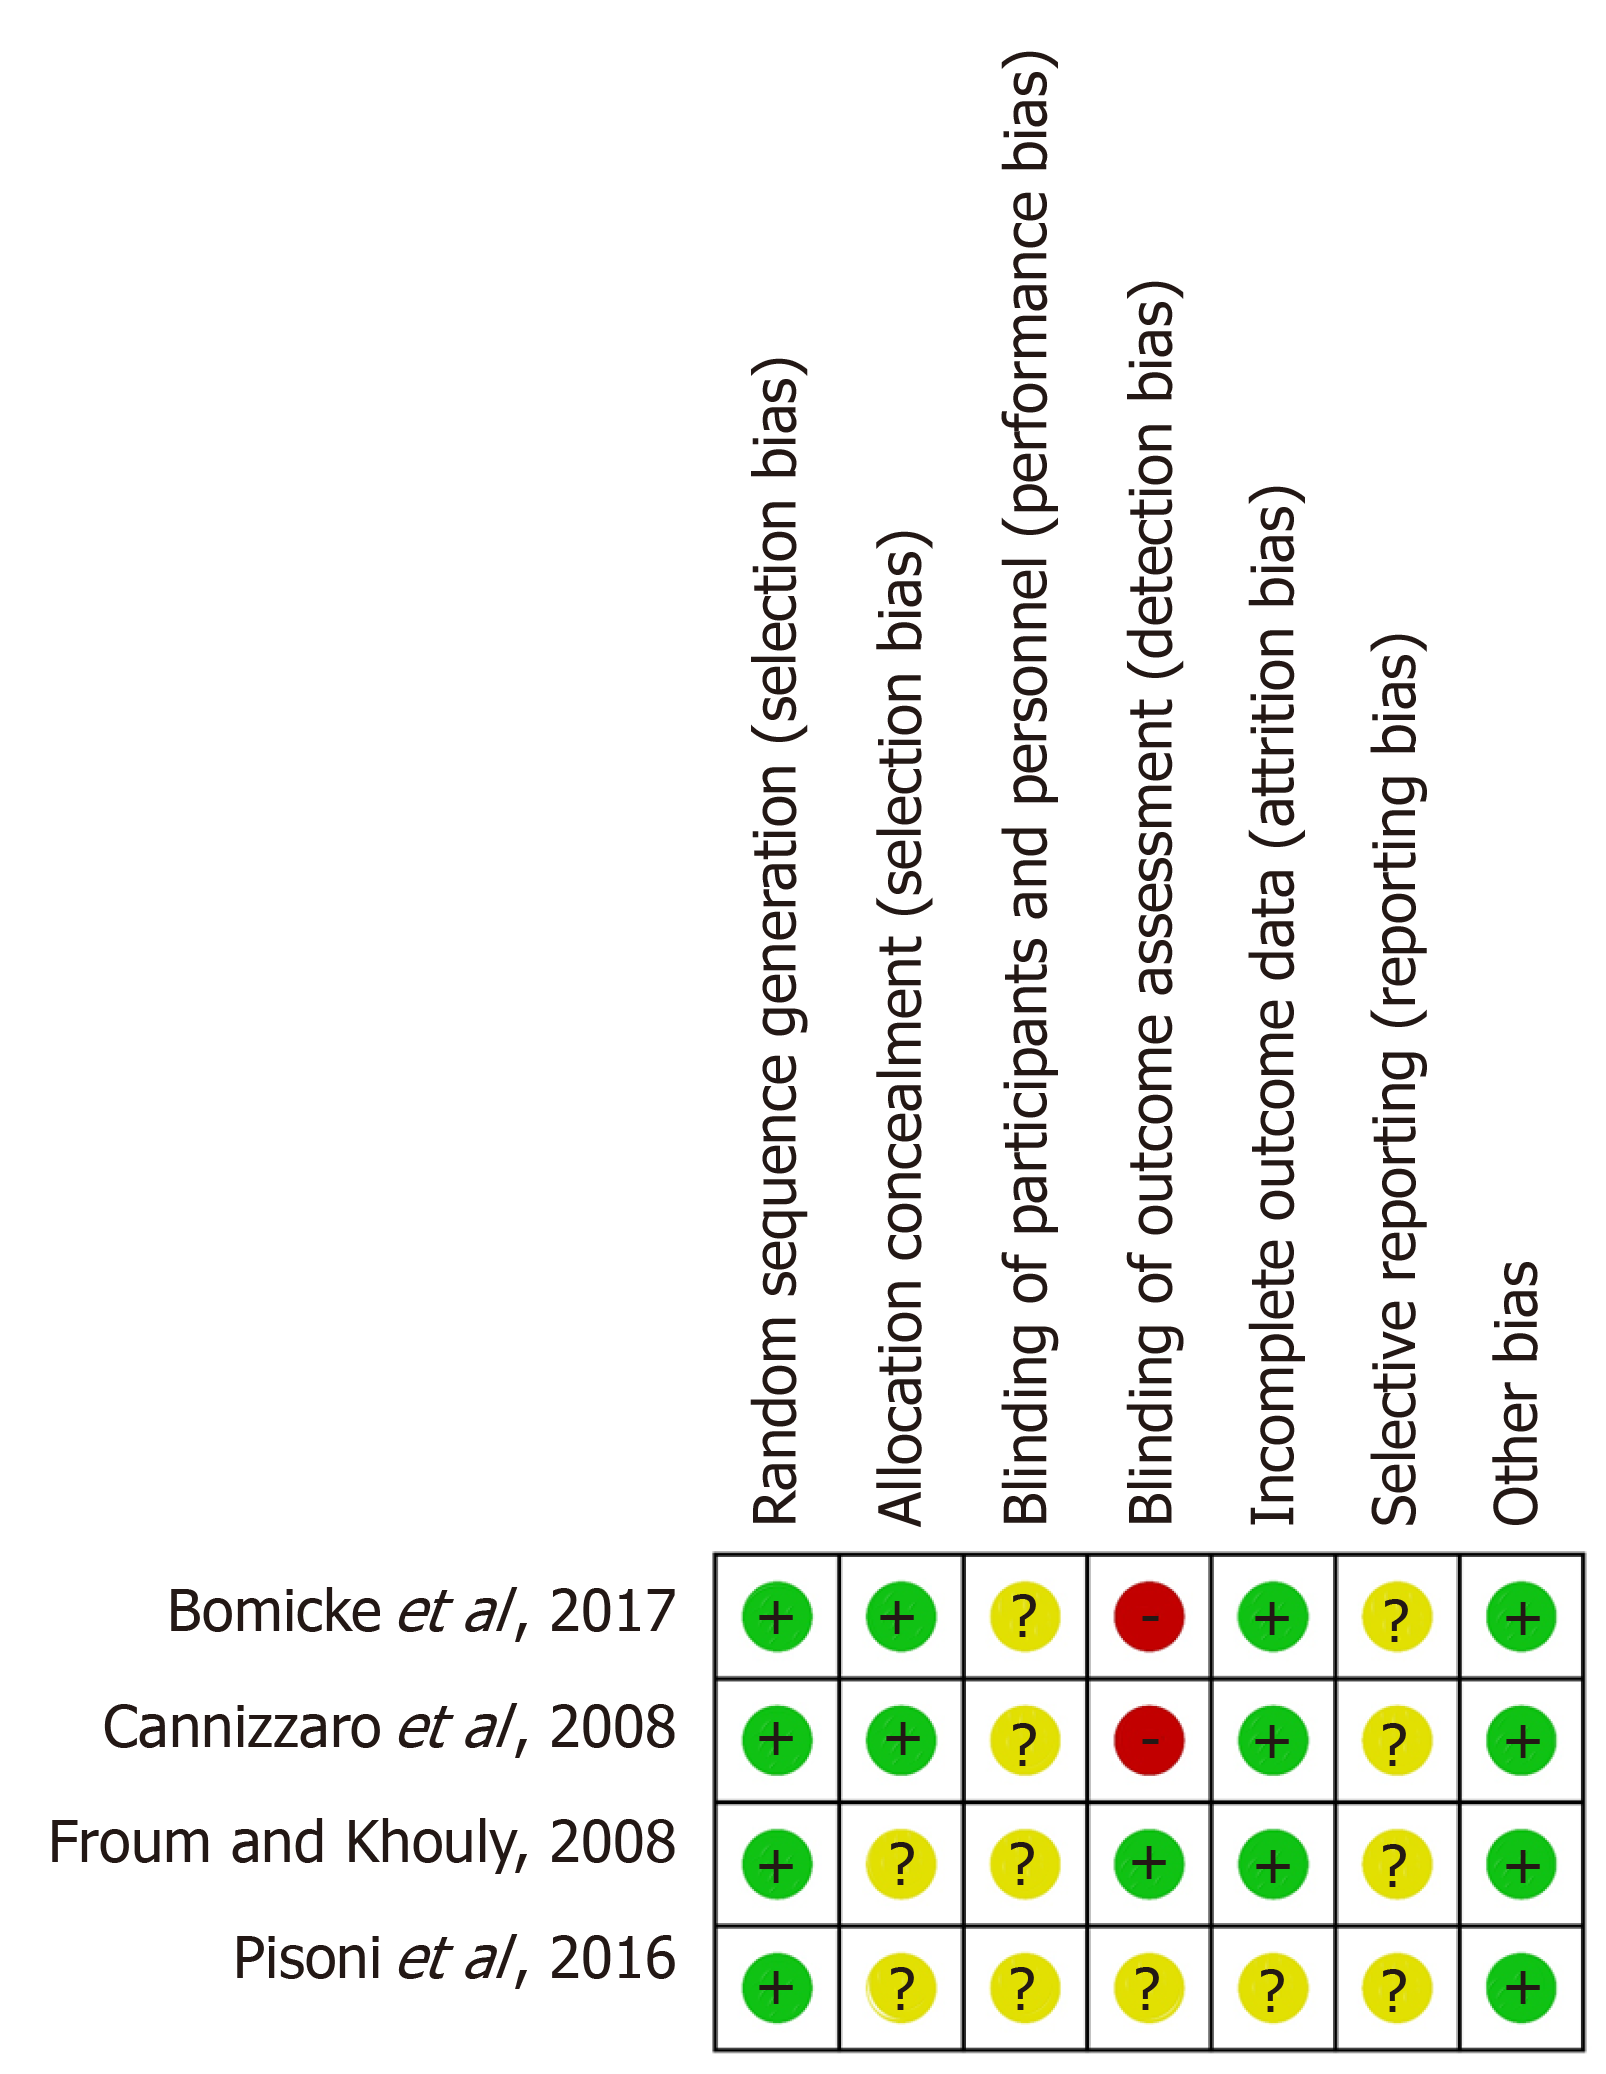
Figure 2 Quality assessment and risk of bias of the included randomised controlled trials.
The reviewers’ judgements regarding each risk of bias item for each selected randomised controlled trial are summarised. Green represents low risk of bias, yellow represents unclear risk of bias, and red indicates high risk of bias.
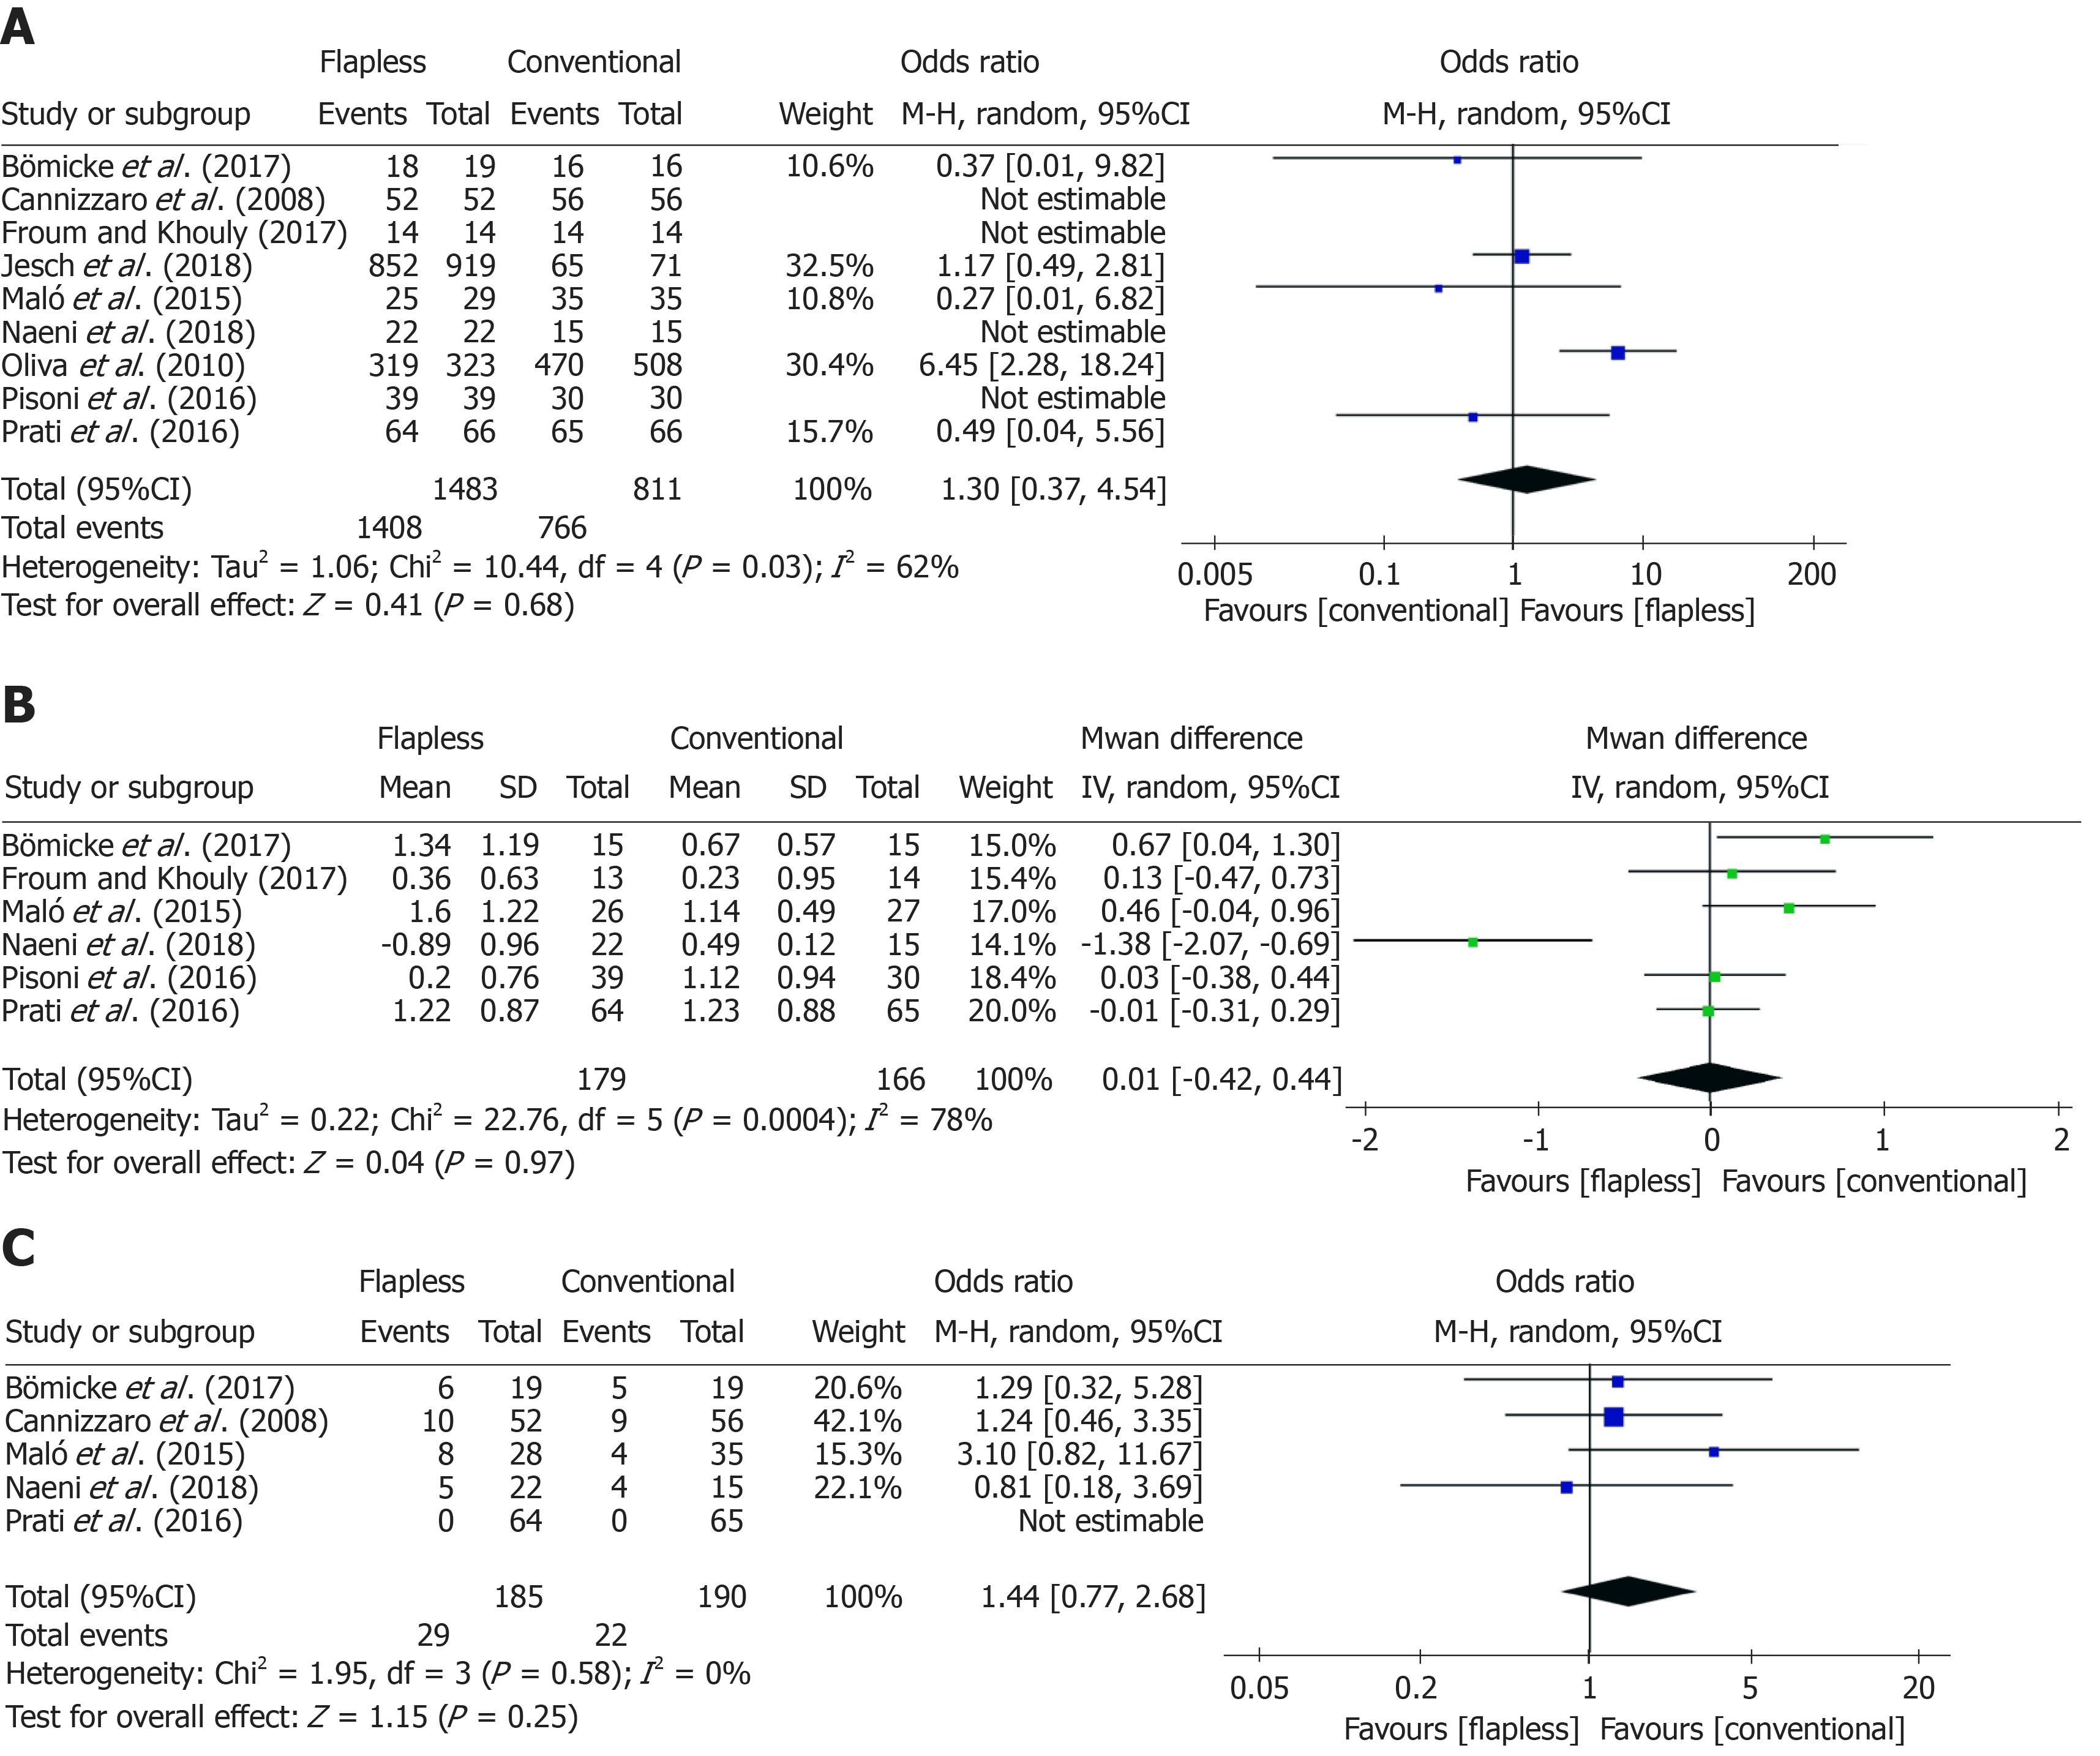
Figure 3 Forest plots of the meta-analyses results comparing the long-term clinical performance of the flapless and conventional surgery groups.
A: Implant survival; B: Marginal bone loss; C: Complications. The sample sizes of the two research groups in each study varied slightly for different outcomes due to missing data.
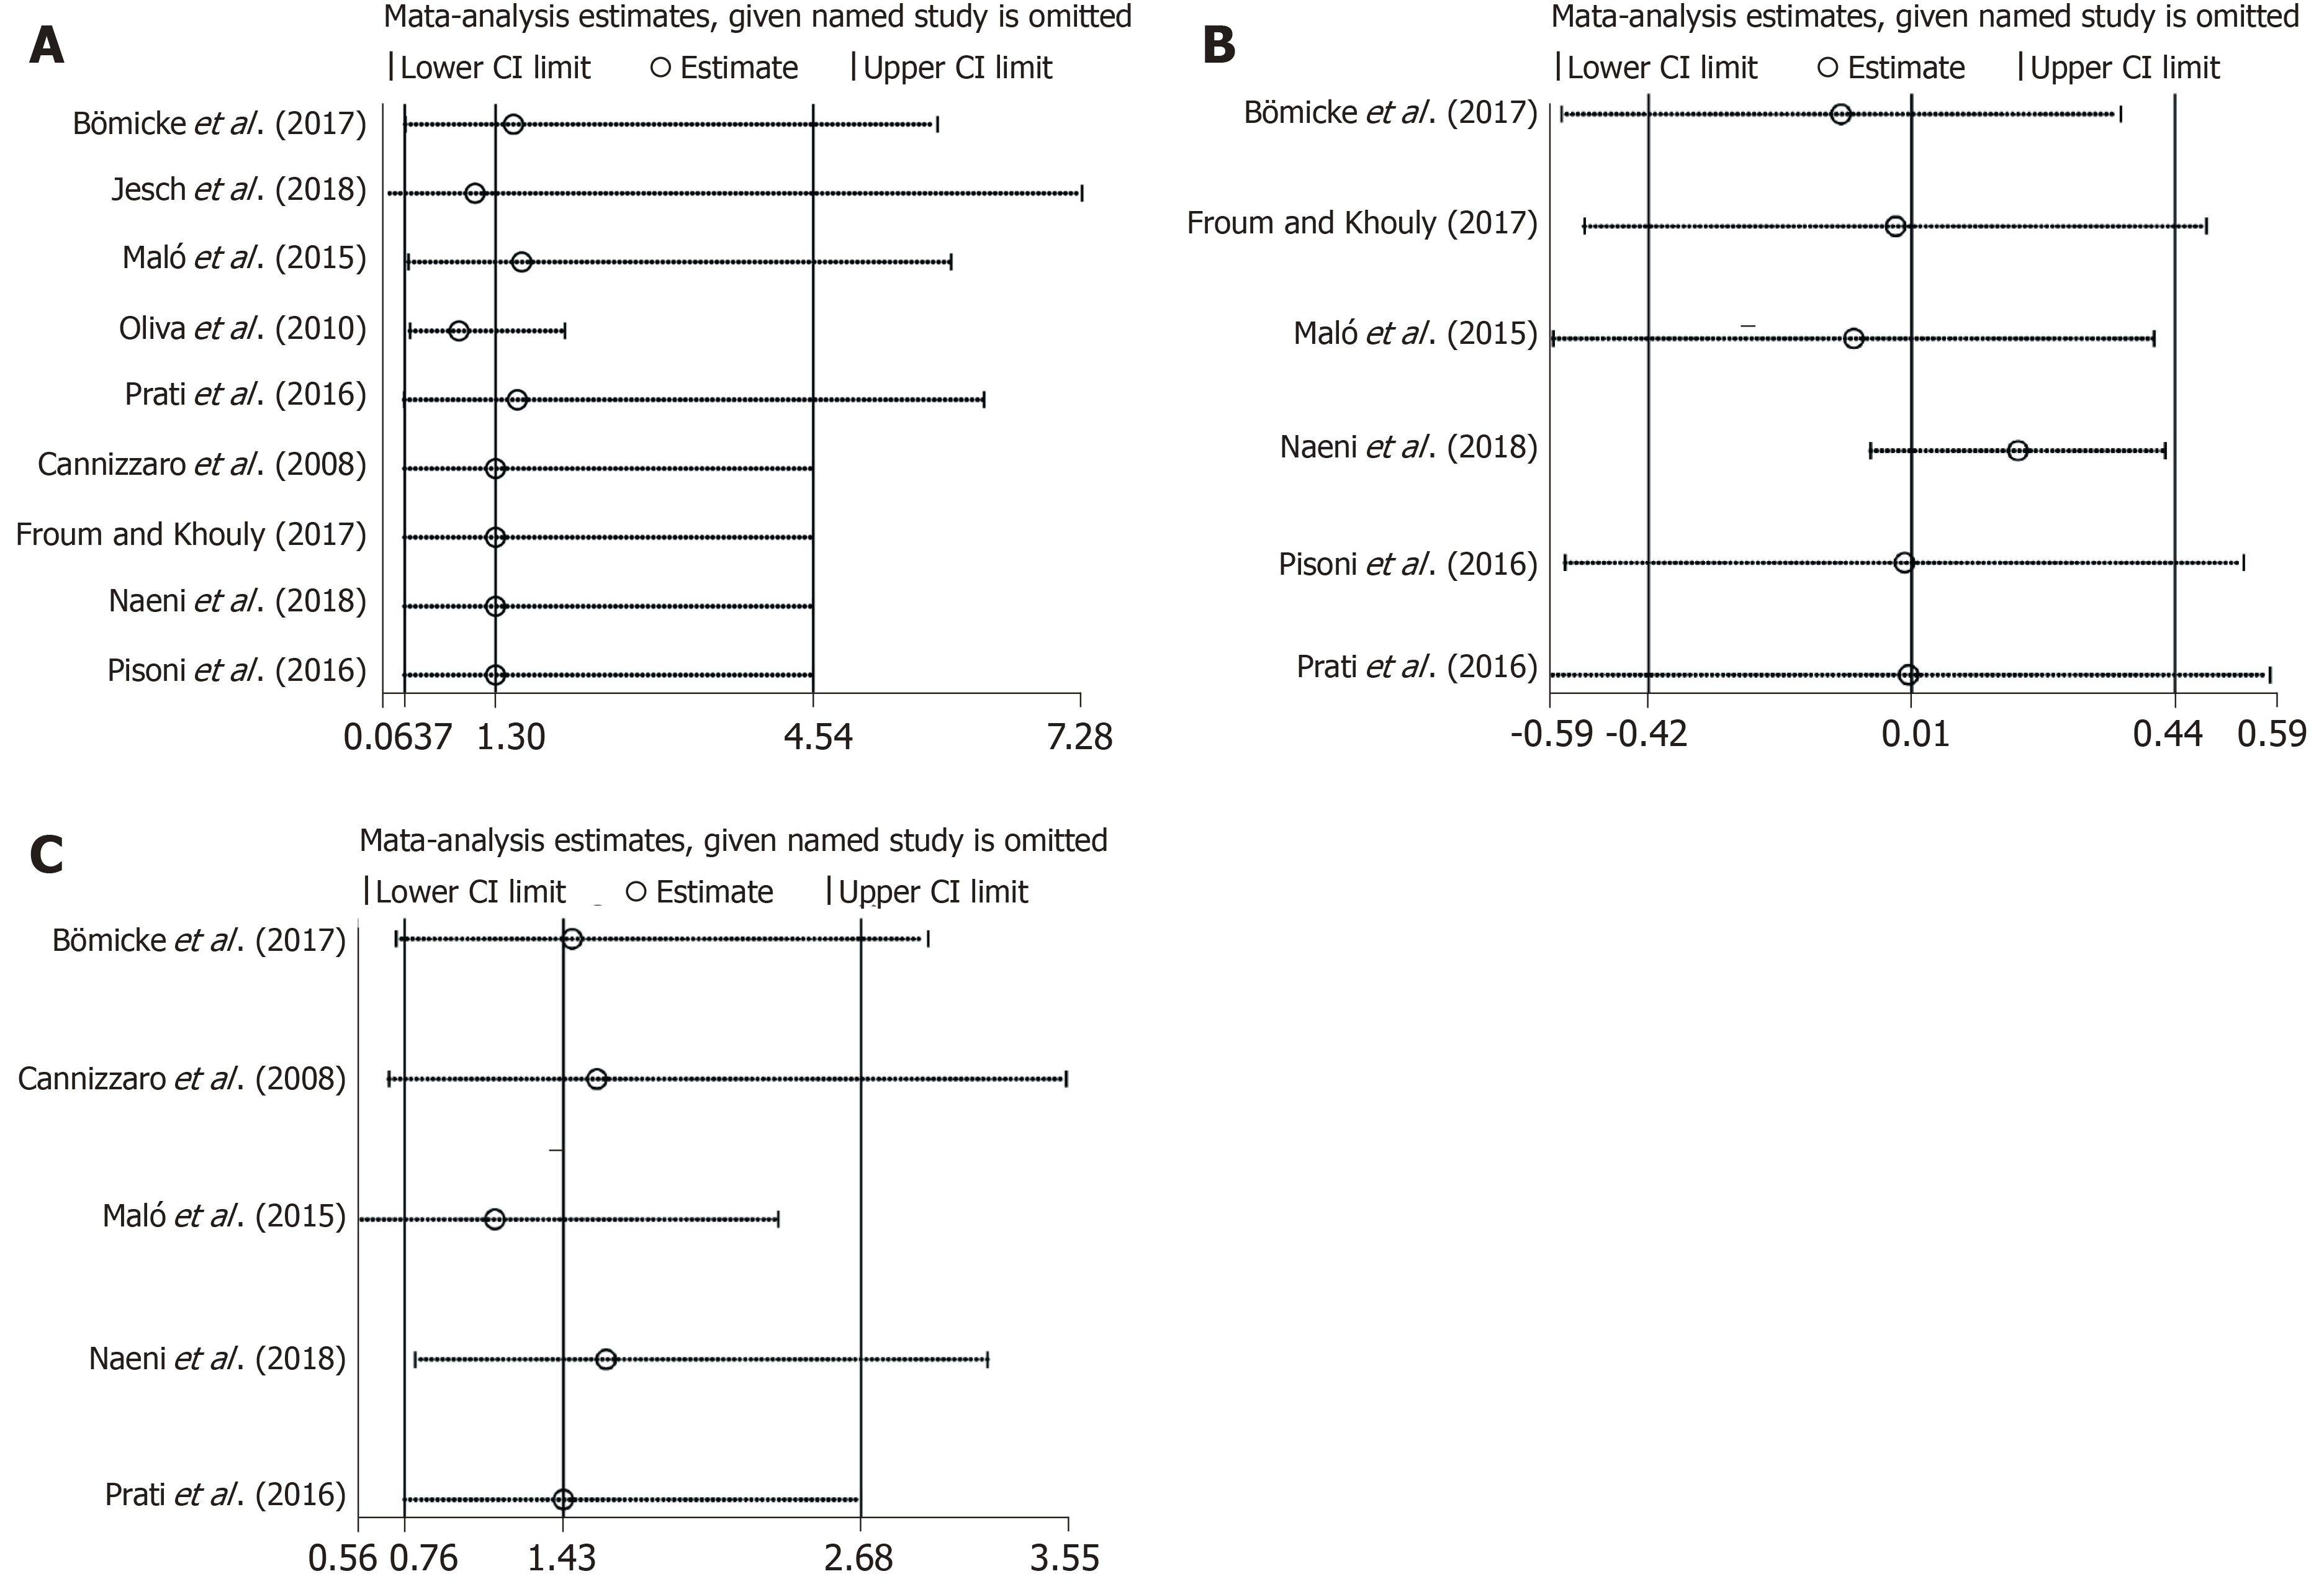
Figure 4 Sensitivity analyses of the comparison of long-term clinical performance between the flapless and conventional surgery groups.
A: Implant survival; B: Marginal bone loss; C: Complications.
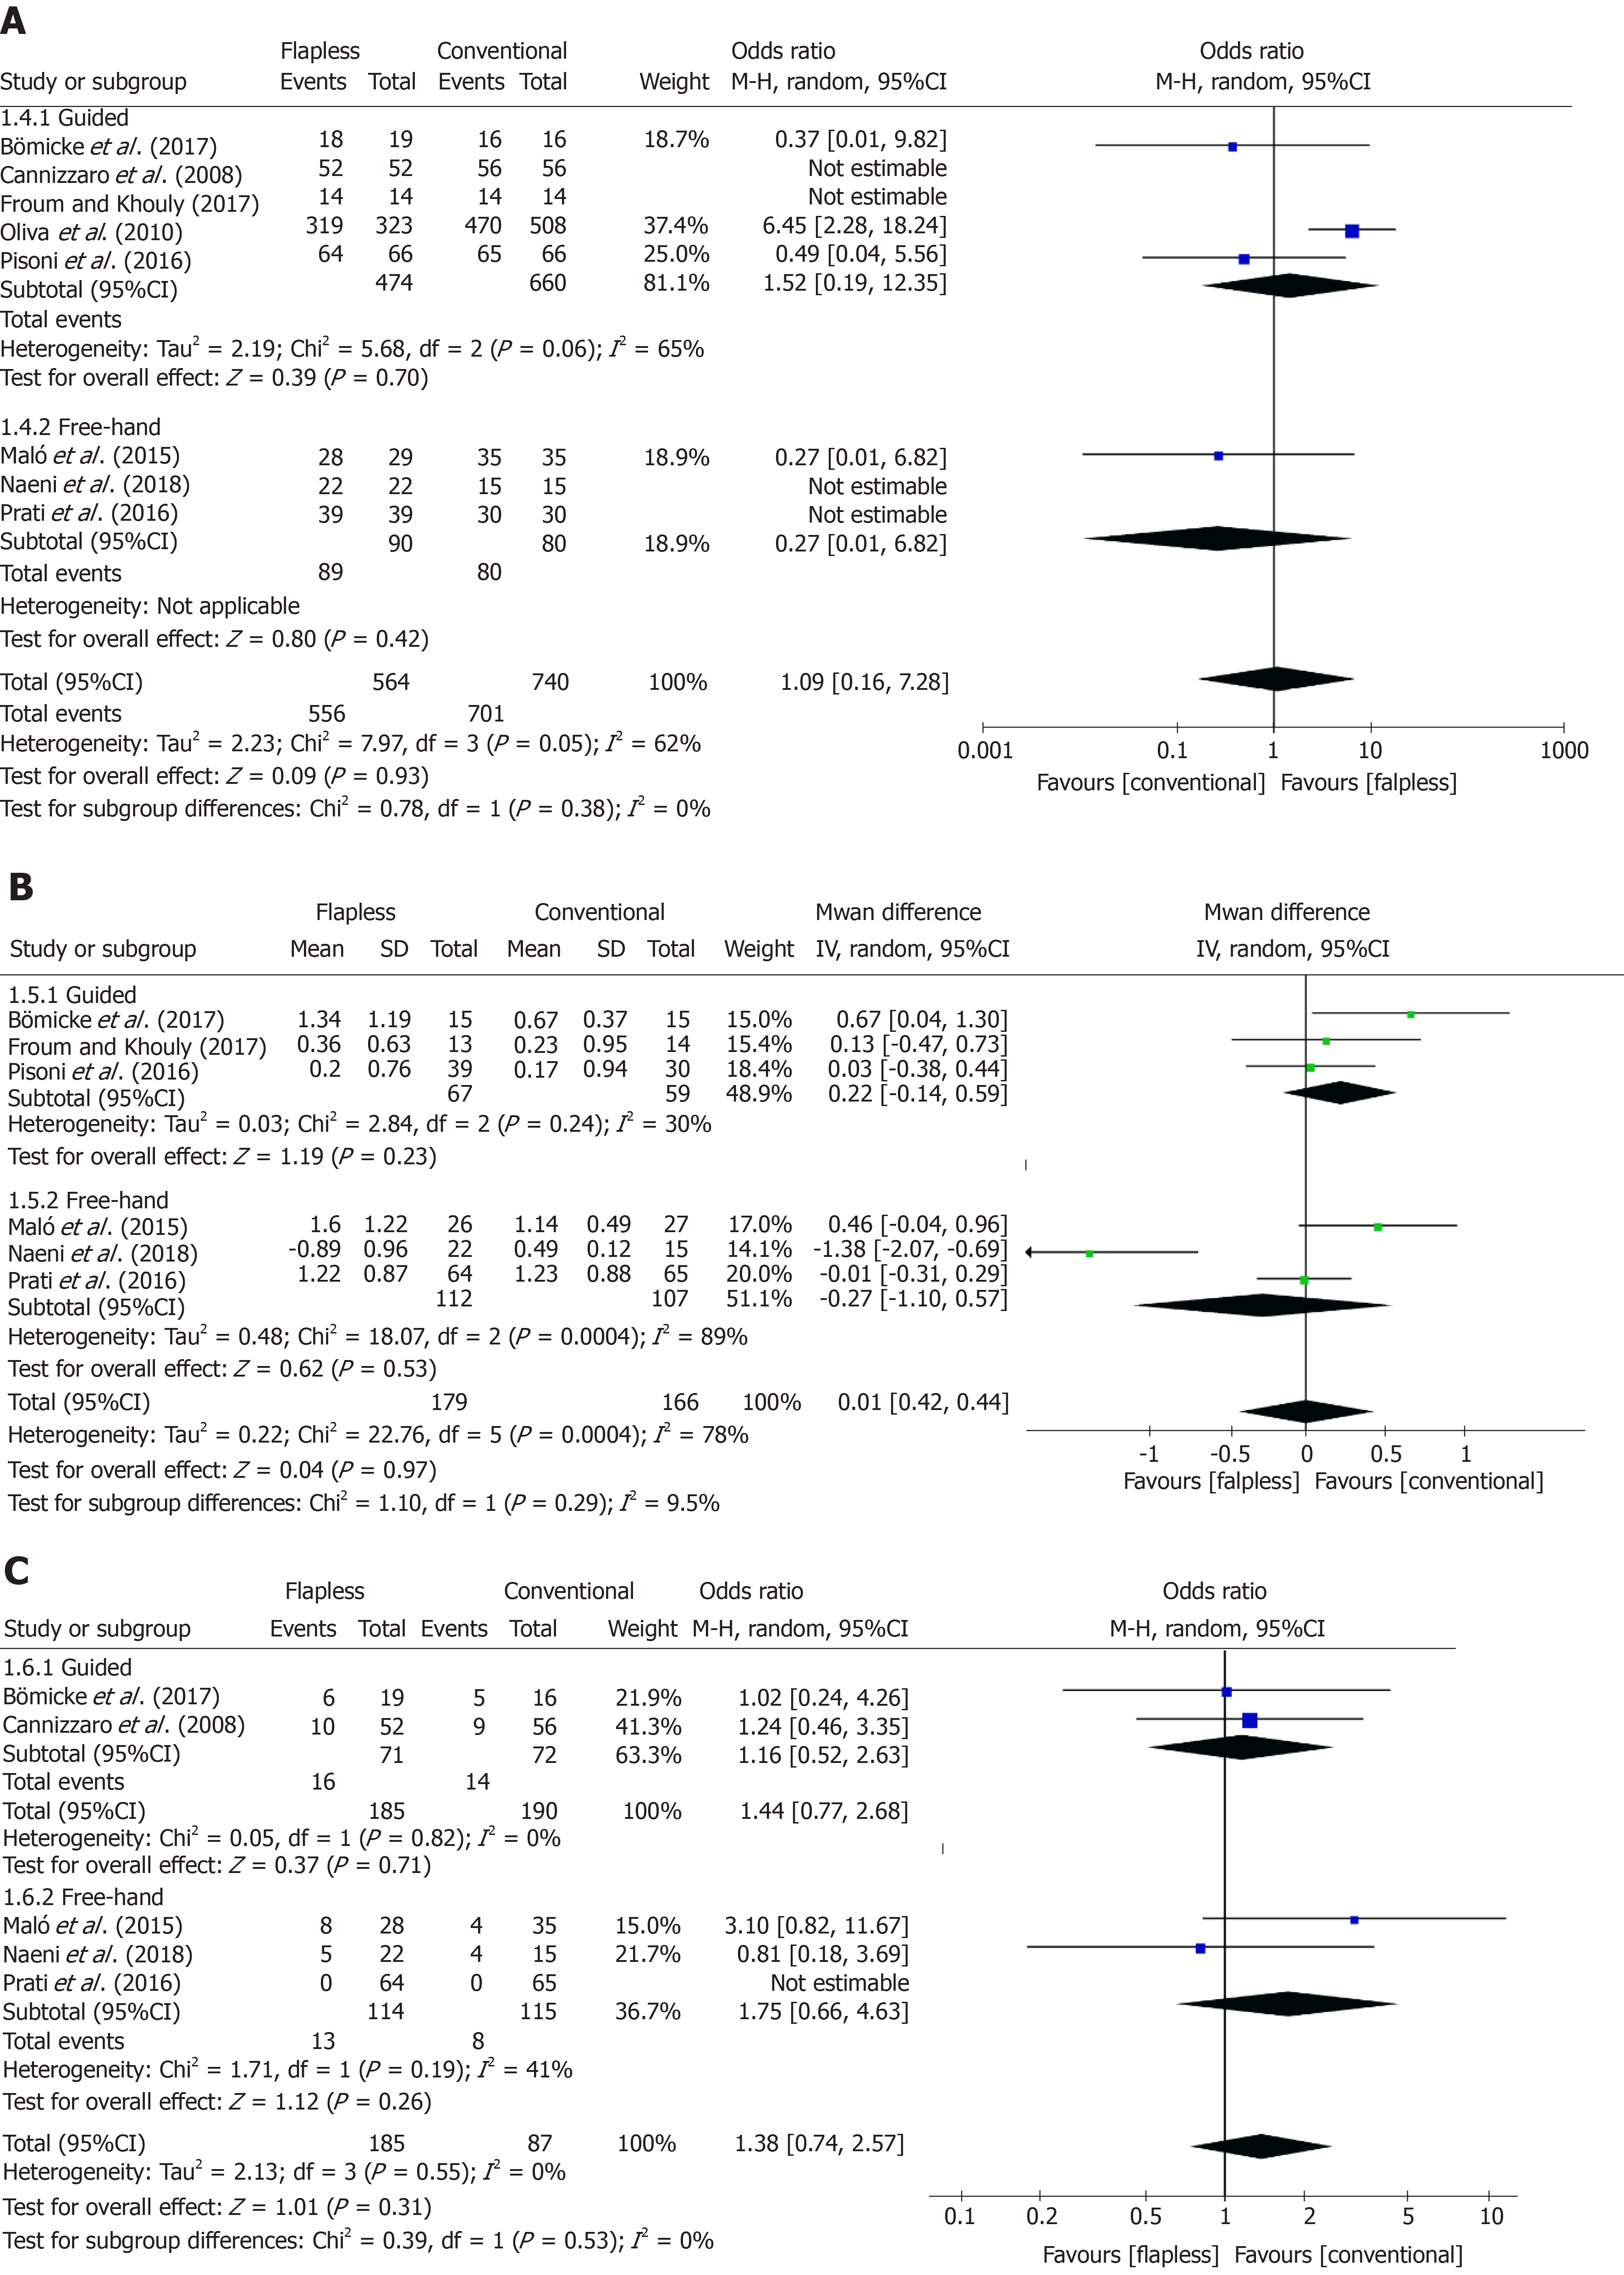
Figure 5 Forest plots of the results of subgroup analyses to compare long-term clinical performance between the guided/free-hand flapless surgery subgroup and the conventional surgery group.
A: Implant survival; B: Marginal bone loss; C: Complications. The sample size of each research group in each study varied slightly for different outcomes due to missing data.
- Citation: Cai H, Liang X, Sun DY, Chen JY. Long-term clinical performance of flapless implant surgery compared to the conventional approach with flap elevation: A systematic review and meta-analysis. World J Clin Cases 2020; 8(6): 1087-1103
- URL: https://www.wjgnet.com/2307-8960/full/v8/i6/1087.htm
- DOI: https://dx.doi.org/10.12998/wjcc.v8.i6.1087


