Copyright
©The Author(s) 2020.
World J Clin Cases. Mar 6, 2020; 8(5): 874-886
Published online Mar 6, 2020. doi: 10.12998/wjcc.v8.i5.874
Published online Mar 6, 2020. doi: 10.12998/wjcc.v8.i5.874
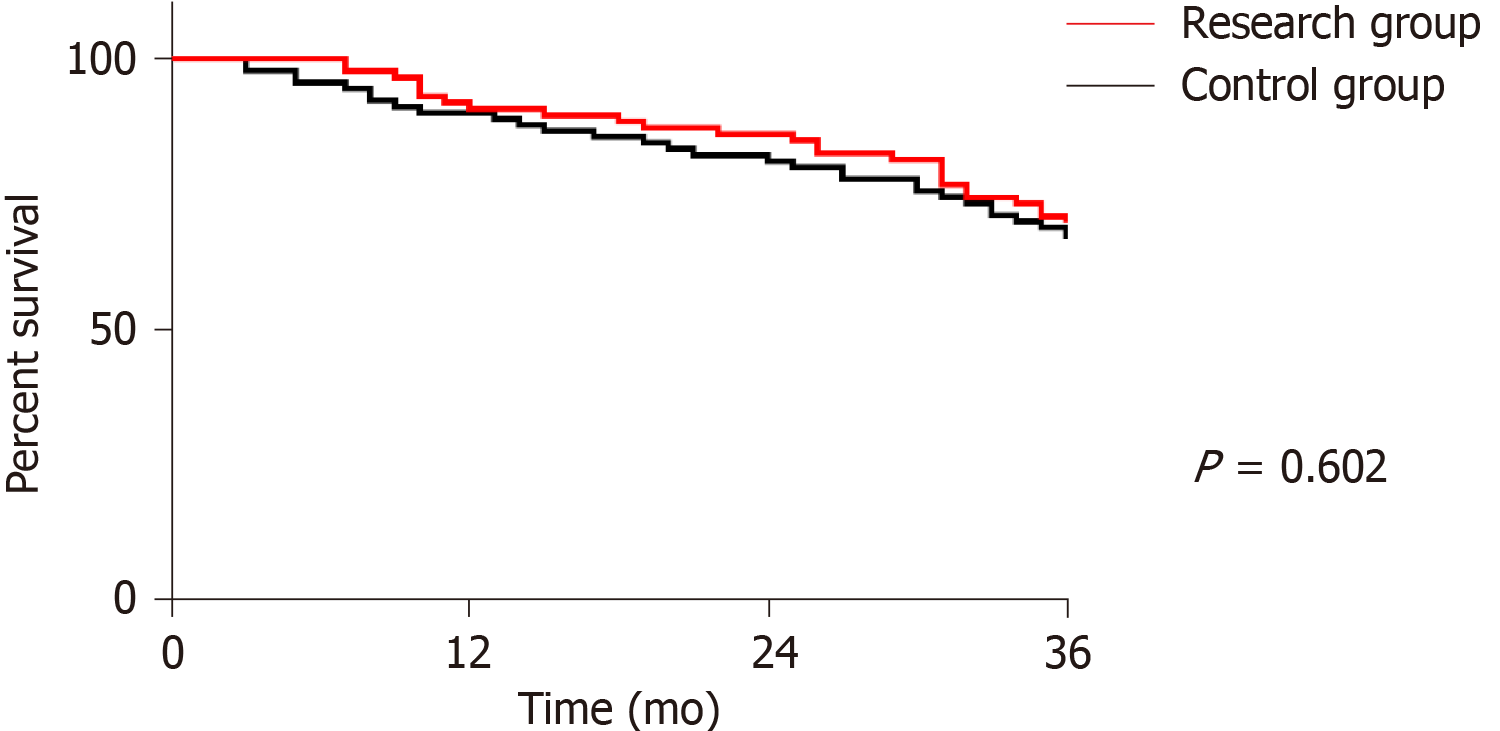
Figure 1 Three year survival curve of the two groups.
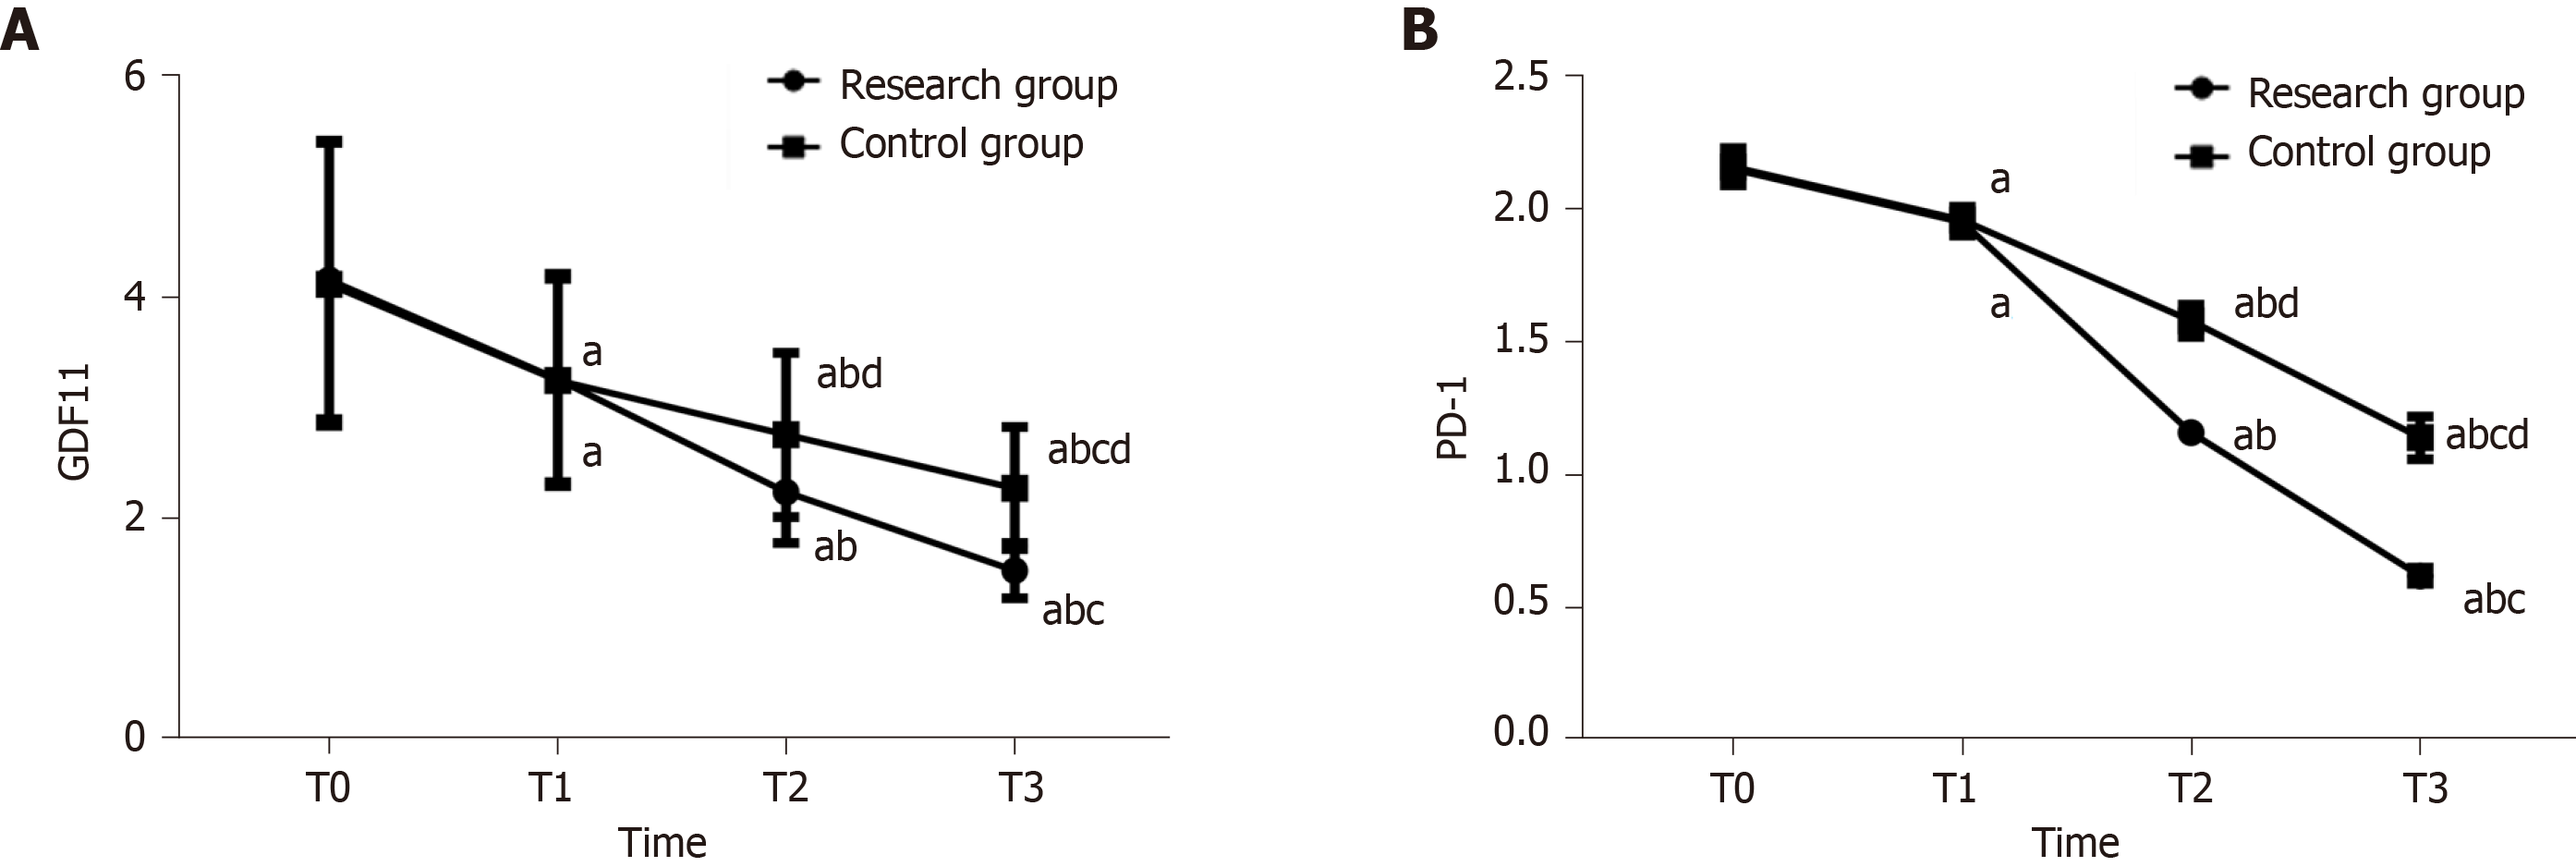
Figure 2 Changes in growth differentiation factor 11 and programmed death receptor-1 during treatment.
A: Differentiation factor 11 during treatment in both groups; B: programmed death receptor-1 during treatment in both groups. a indicates comparison with T0 in the same group (aP < 0.05); b indicates comparison with T1 in the same group (aP < 0.05); c indicates comparison with T2 in the same group (aP < 0.05); d indicates comparison with the RG at the same time (aP < 0.05). PD-1: Programmed death receptor-1; GDF11: Growth differentiation factor 11.
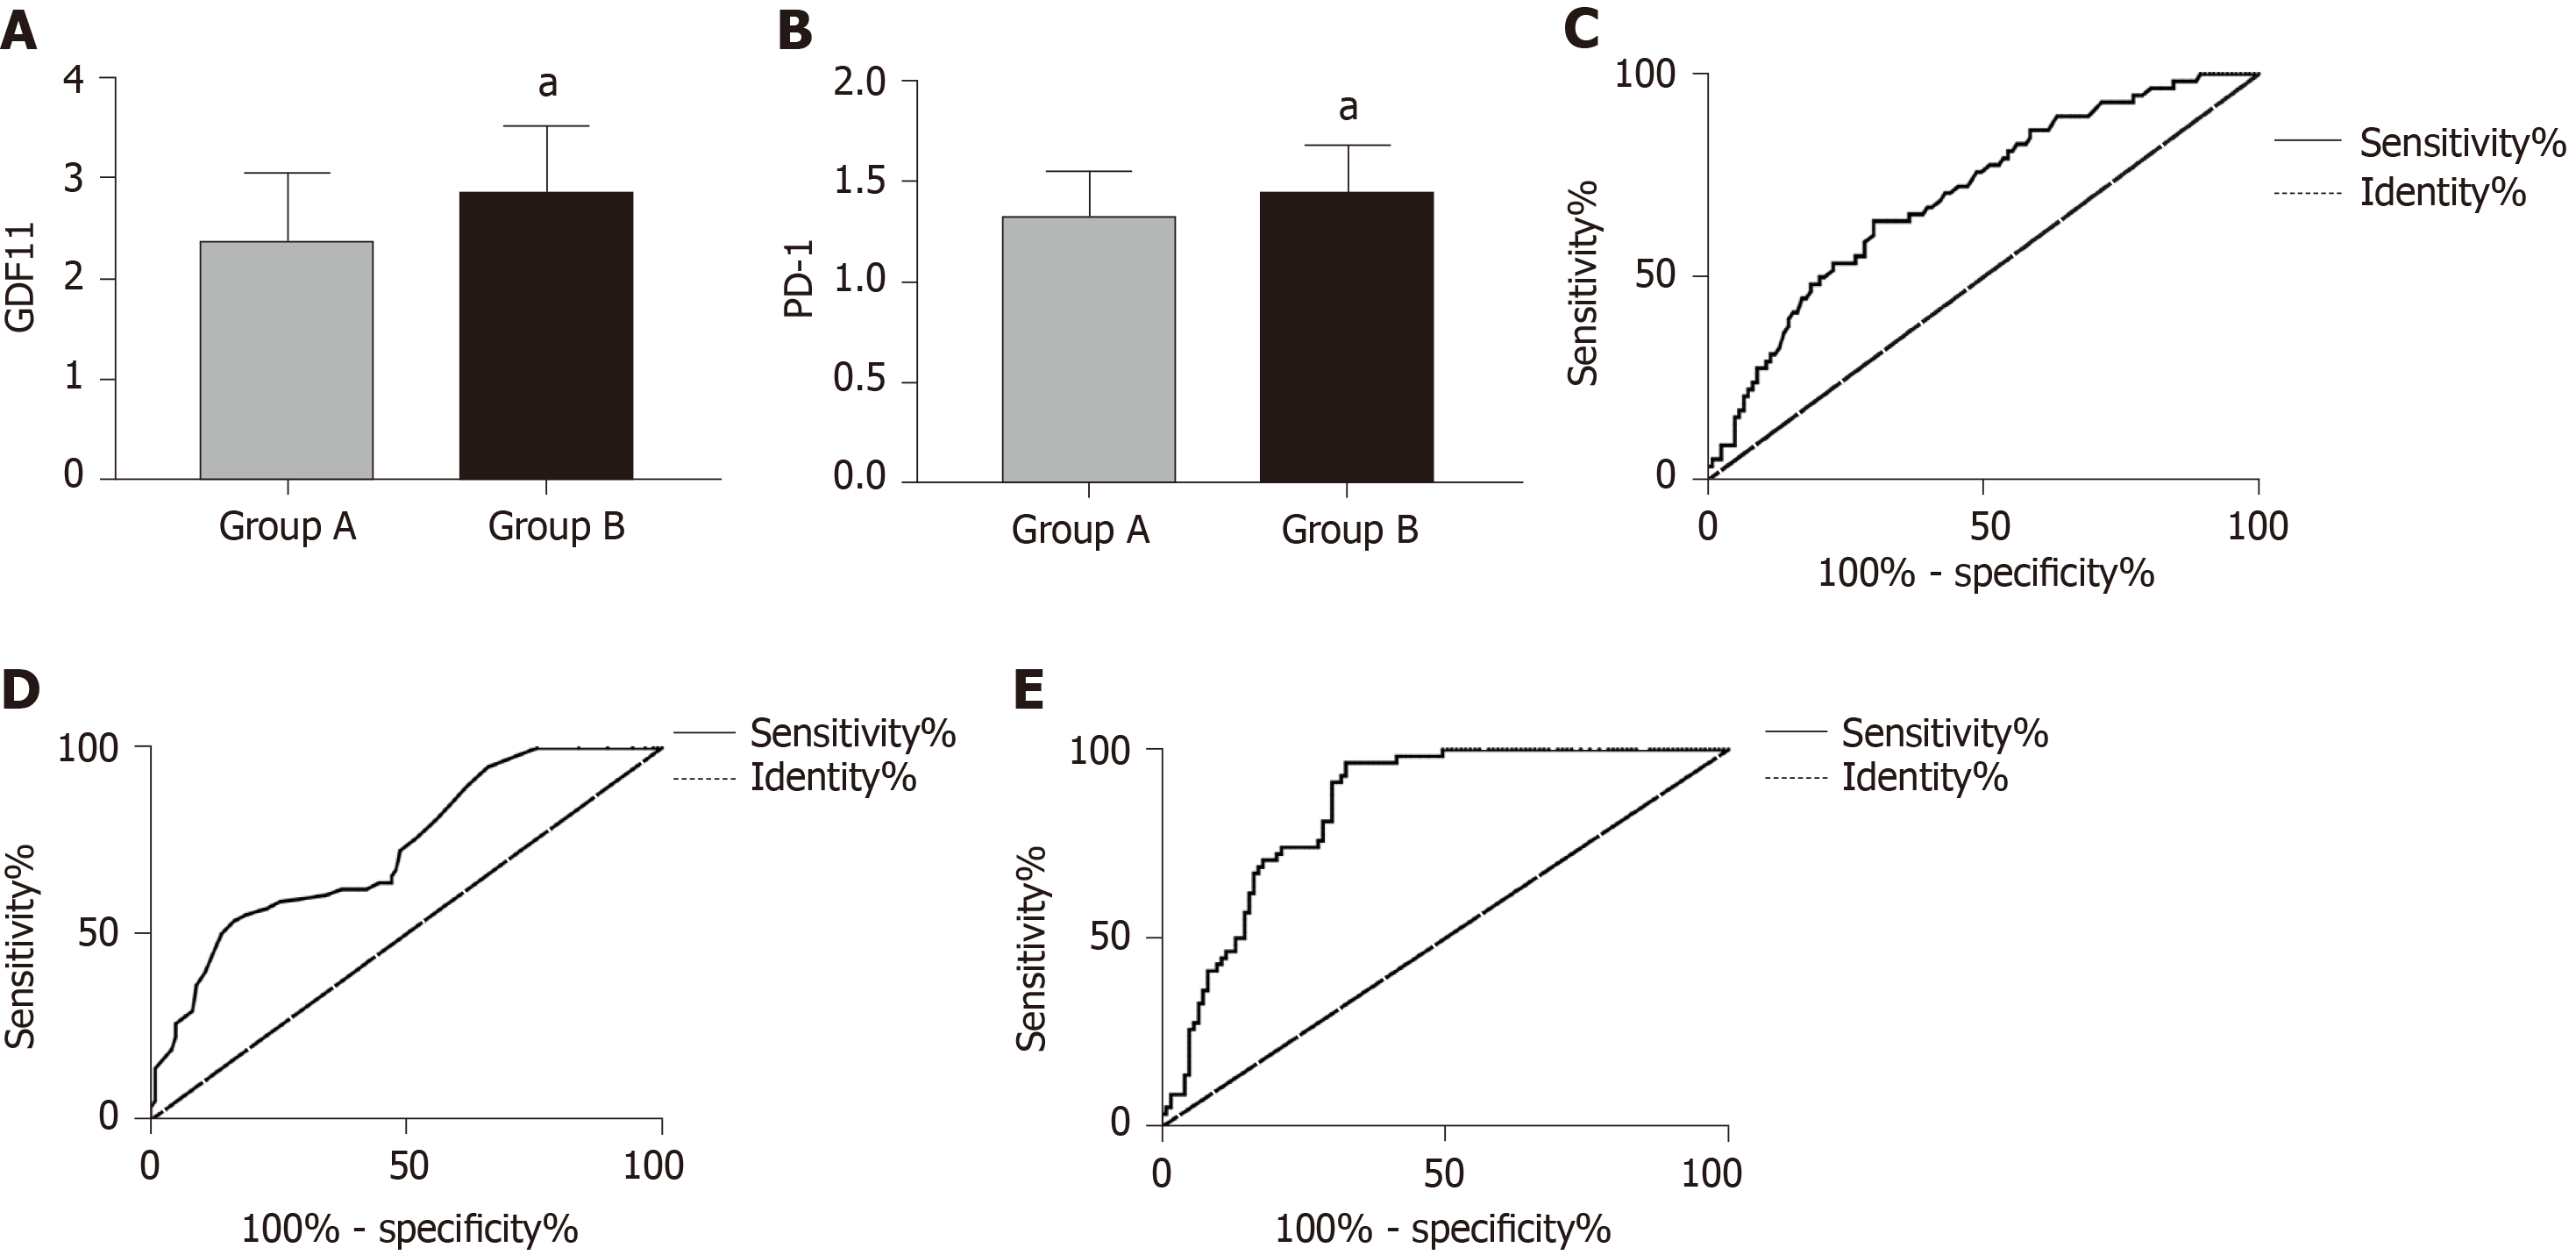
Figure 3 Predictive value of growth differentiation factor 11 and programmed death receptor-1 for efficacy.
A: Comparison of growth differentiation factor 11 (GDF11) in group A and group B, aP < 0.05; B: Comparison of programmed death receptor-1 (PD-1) in group A and group B, aP < 0.05; C: ROC curve of GDF11 for predicting efficacy; D: ROC curve of PD-1 for predicting efficacy; E: ROC curve of GDF11 combined with PD-1 for predicting efficacy. PD-1: Programmed death receptor-1; GDF11: Growth differentiation factor 11.
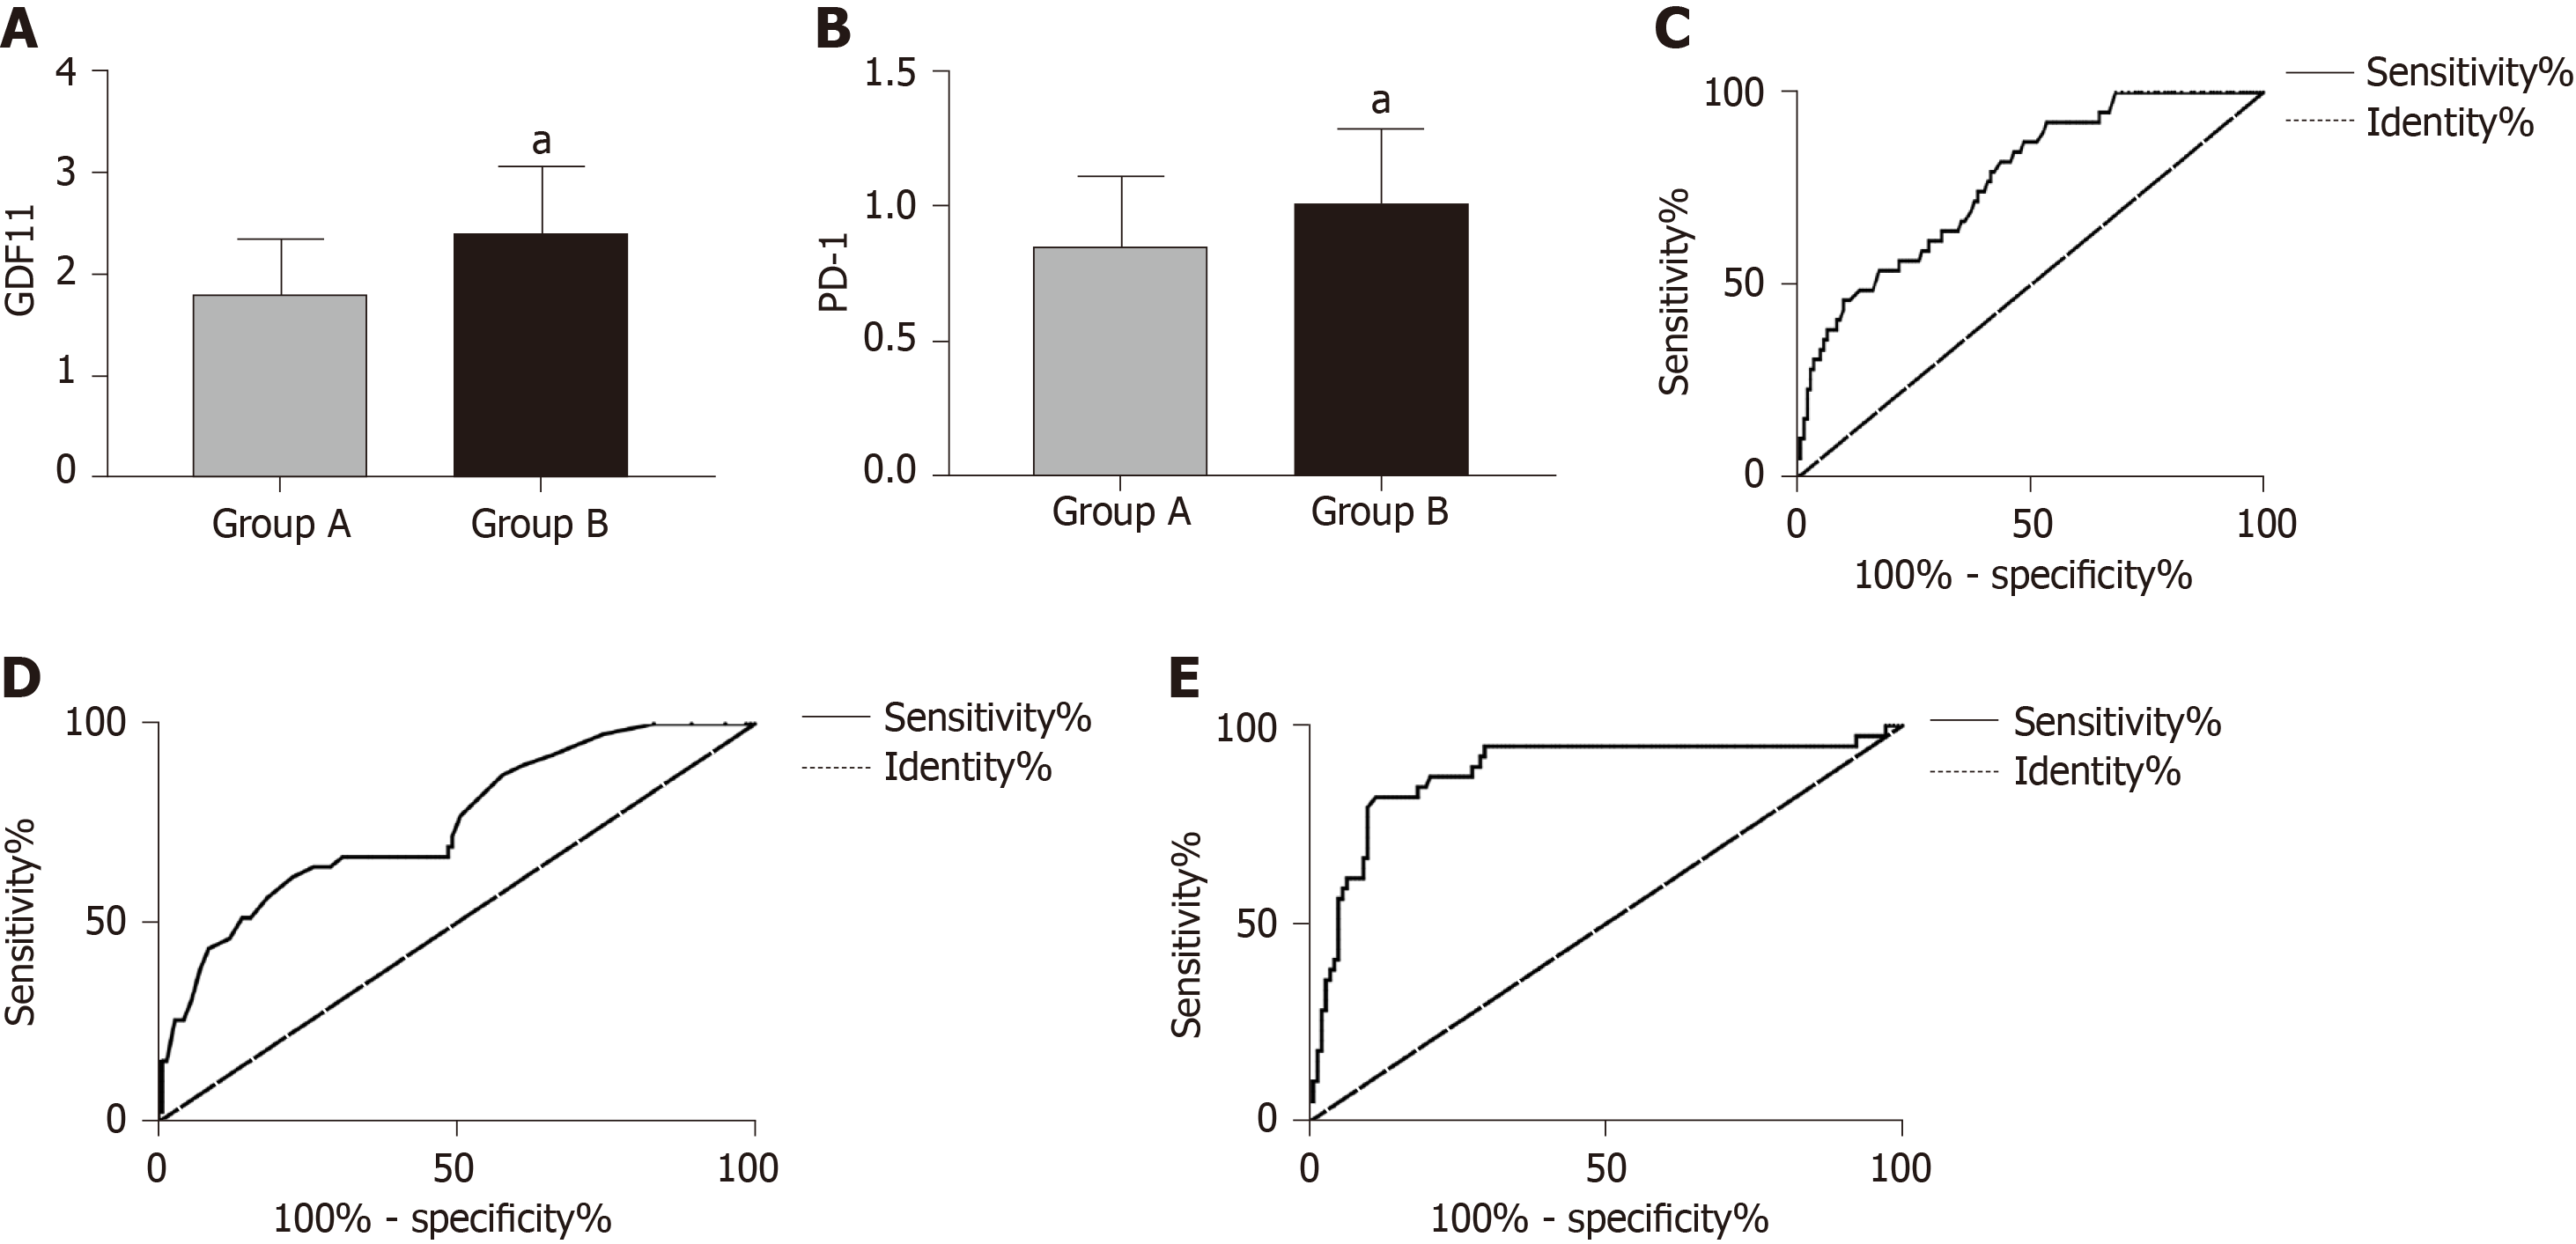
Figure 4 Predictive value of growth differentiation factor 11 and programmed death receptor-1 for recurrence.
A: Comparison of growth differentiation factor 11 (GDF11) in group A and group B, aP < 0.05; B: Comparison of programmed death receptor-1 (PD-1) in group A and group B, aP < 0.05; C: ROC curve of GDF11 for recurrence prediction; D: ROC curve of PD-1 for recurrence prediction; E: ROC curve of GDF11 combined with PD-1 for recurrence prediction. PD-1: Programmed death receptor-1; GDF11: Growth differentiation factor 11.
- Citation: Xue G, Feng Y, Li JB. Significance of 125I radioactive seed implantation on growth differentiation factor and programmed death receptor-1 during treatment of oral cancer. World J Clin Cases 2020; 8(5): 874-886
- URL: https://www.wjgnet.com/2307-8960/full/v8/i5/874.htm
- DOI: https://dx.doi.org/10.12998/wjcc.v8.i5.874


