Copyright
©The Author(s) 2020.
World J Clin Cases. Mar 6, 2020; 8(5): 864-873
Published online Mar 6, 2020. doi: 10.12998/wjcc.v8.i5.864
Published online Mar 6, 2020. doi: 10.12998/wjcc.v8.i5.864
Figure 1 Correlation analysis of pregnancy-associated plasma protein A, triglyceride, and 25-hydroxyvitamin D levels with fasting blood glucose in gestational diabetes mellitus patients.
A: Pearson analysis demonstrated that pregnancy-associated plasma protein A and fasting blood glucose (FBG) were negatively correlated (r = -0.605, P < 0.001); B: Pearson analysis revealed a positive correlation between triglyceride and FBG (r = 0.558, P < 0.001); C: Pearson analysis indicated a negative correlation between 25-hydroxyvitamin D and FBG (r = -0.629, P < 0.001). PAPP-A: Pregnancy-associated plasma protein A; TG: Triglyceride; 25-(OH)D: 25-hydroxyvitamin D.
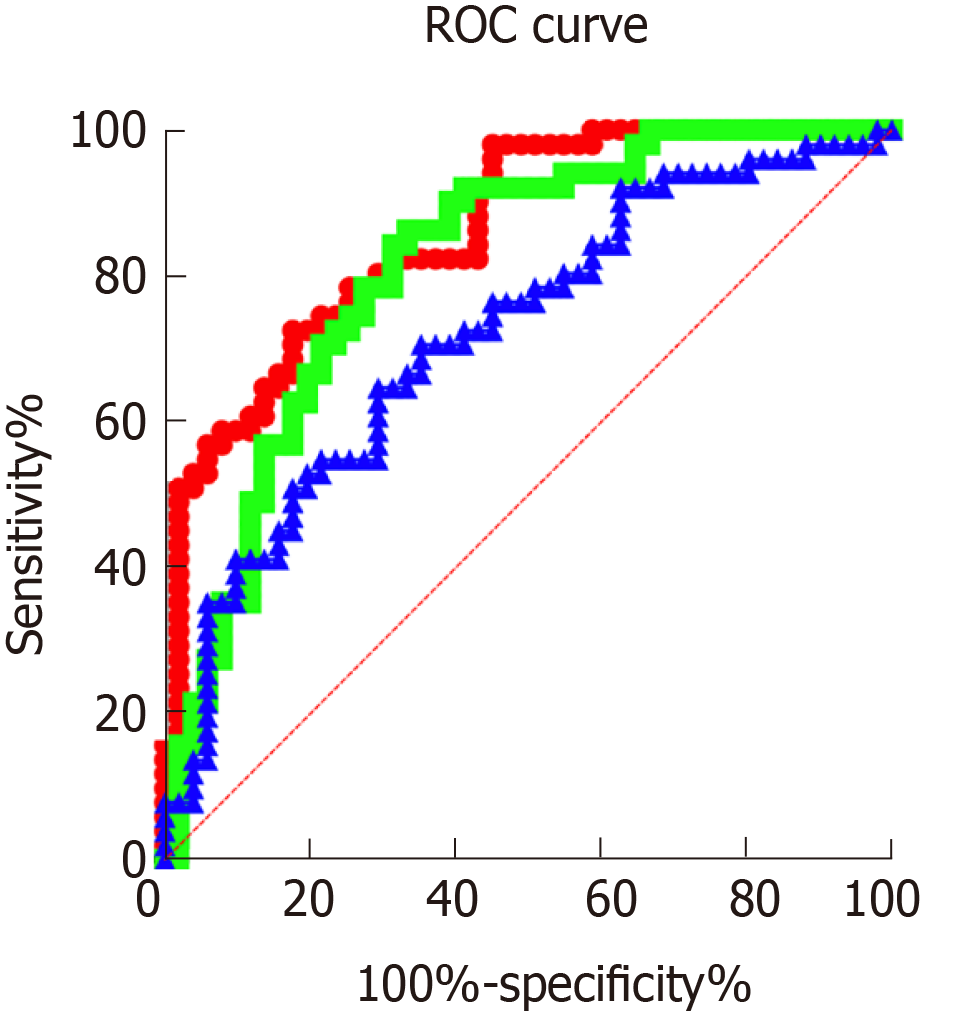
Figure 2 Diagnostic efficacy analysis of pregnancy-associated plasma protein A, triglyceride, and 25-hydroxyvitamin D for gestational diabetes mellitus.
ROC curve analysis demonstrated that the sensitivity, specificity and AUC of serum pregnancy-associated plasma protein A level in the diagnosis of gestational diabetes mellitus (GDM) were 72.55%, 82.35% and 0.861, respectively. The sensitivity and specificity of triglyceride level in diagnosing GDM were 86.27% and 66.67%, the AUC was 0.813, and the optimal cut-off value was 1.796. The sensitivity, specificity, AUC, and optimal cut-off value of 25-hydroxyvitamin D in diagnosing GDM were 64.71%, 70.59%, 0.721, and 23.140, respectively.
- Citation: Ren Z, Zhe D, Li Z, Sun XP, Yang K, Lin L. Study on the correlation and predictive value of serum pregnancy-associated plasma protein A, triglyceride and serum 25-hydroxyvitamin D levels with gestational diabetes mellitus. World J Clin Cases 2020; 8(5): 864-873
- URL: https://www.wjgnet.com/2307-8960/full/v8/i5/864.htm
- DOI: https://dx.doi.org/10.12998/wjcc.v8.i5.864


