Copyright
©The Author(s) 2020.
World J Clin Cases. Dec 26, 2020; 8(24): 6511-6516
Published online Dec 26, 2020. doi: 10.12998/wjcc.v8.i24.6511
Published online Dec 26, 2020. doi: 10.12998/wjcc.v8.i24.6511
Figure 1 Sonographic images of the hematoma in the left gastrocnemius muscle.
A: Axial view; B: Longitudinal view. The dotted line indicates greatest width of the hematoma, and the vertical length is sown in Figure 1B.
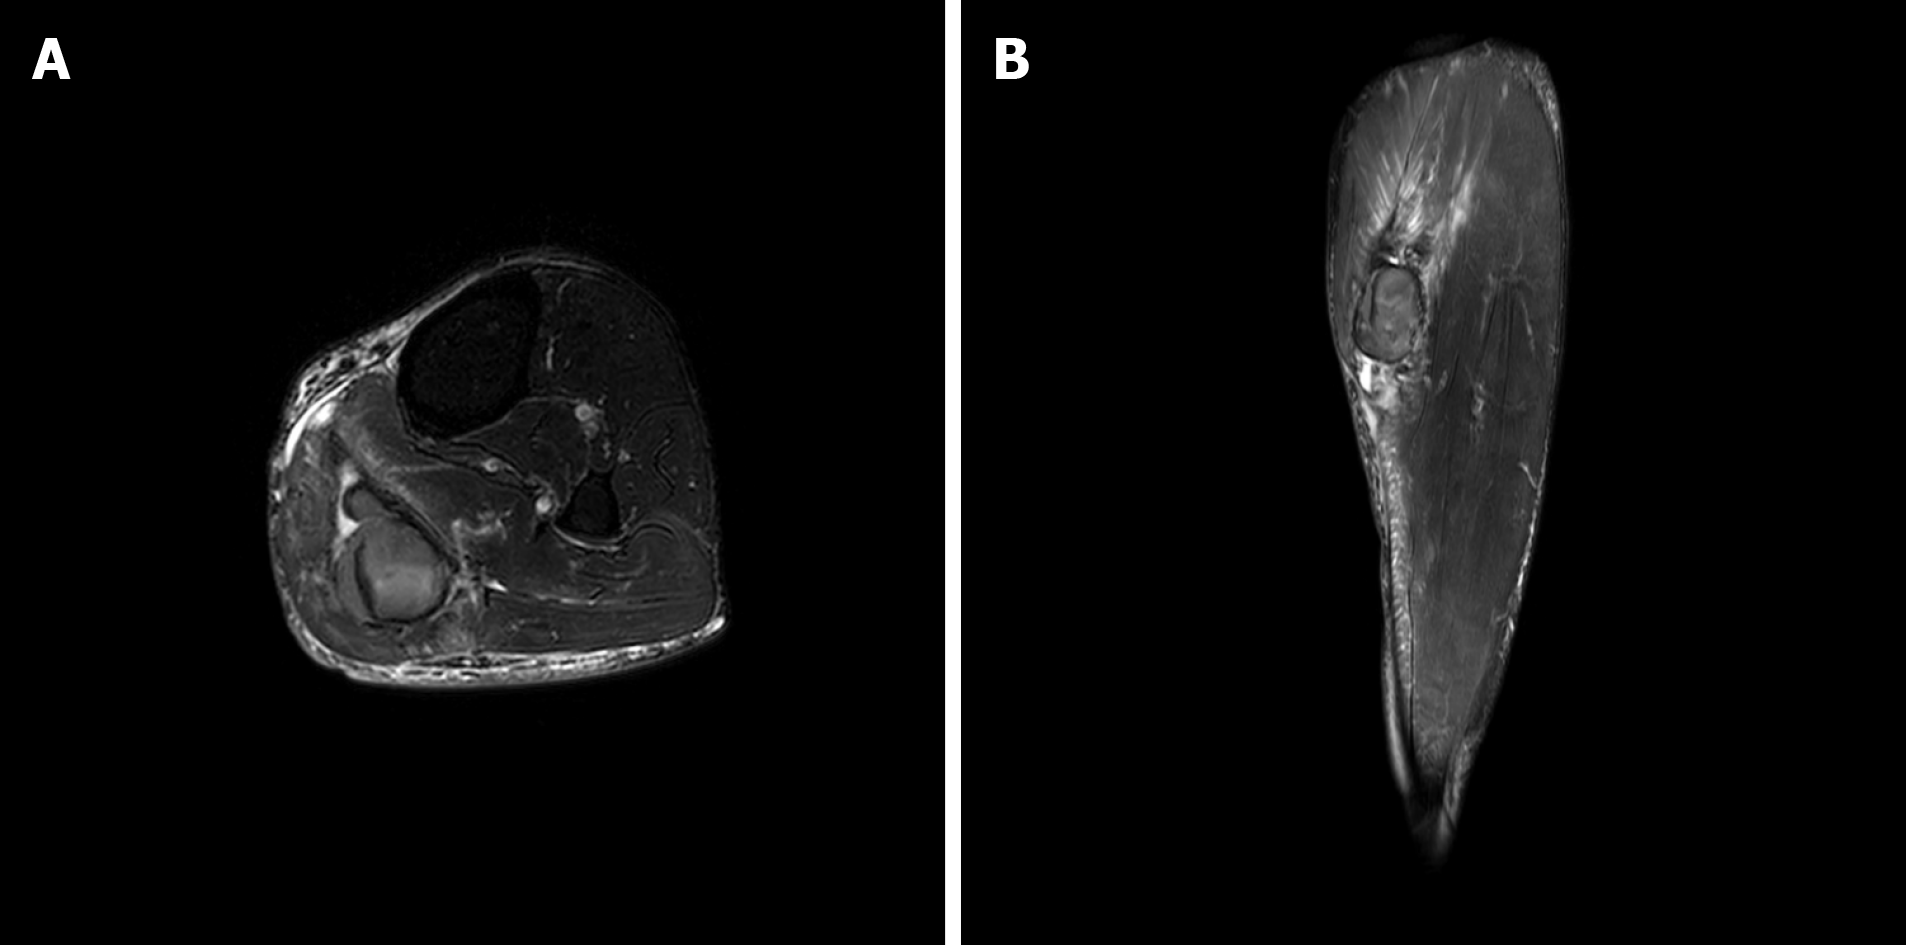
Figure 2 Magnetic resonance images of the hematoma in the left gastrocnemius muscle.
A: Axial view; B: Longitudinal view.
Figure 3 Sonographic images of the hematoma in the left gastrocnemius muscle after extracorporeal shock wave therapy.
A: Axial view after extracorporeal shock wave therapy; B and C: Longitudinal view after extracorporeal shock wave therapy.
- Citation: Jung JW, Kim HS, Yang JH, Lee KH, Park SB. Extracorporeal shock wave therapy treatment of painful hematoma in the calf: A case report. World J Clin Cases 2020; 8(24): 6511-6516
- URL: https://www.wjgnet.com/2307-8960/full/v8/i24/6511.htm
- DOI: https://dx.doi.org/10.12998/wjcc.v8.i24.6511


