Copyright
©The Author(s) 2020.
World J Clin Cases. Dec 26, 2020; 8(24): 6487-6498
Published online Dec 26, 2020. doi: 10.12998/wjcc.v8.i24.6487
Published online Dec 26, 2020. doi: 10.12998/wjcc.v8.i24.6487
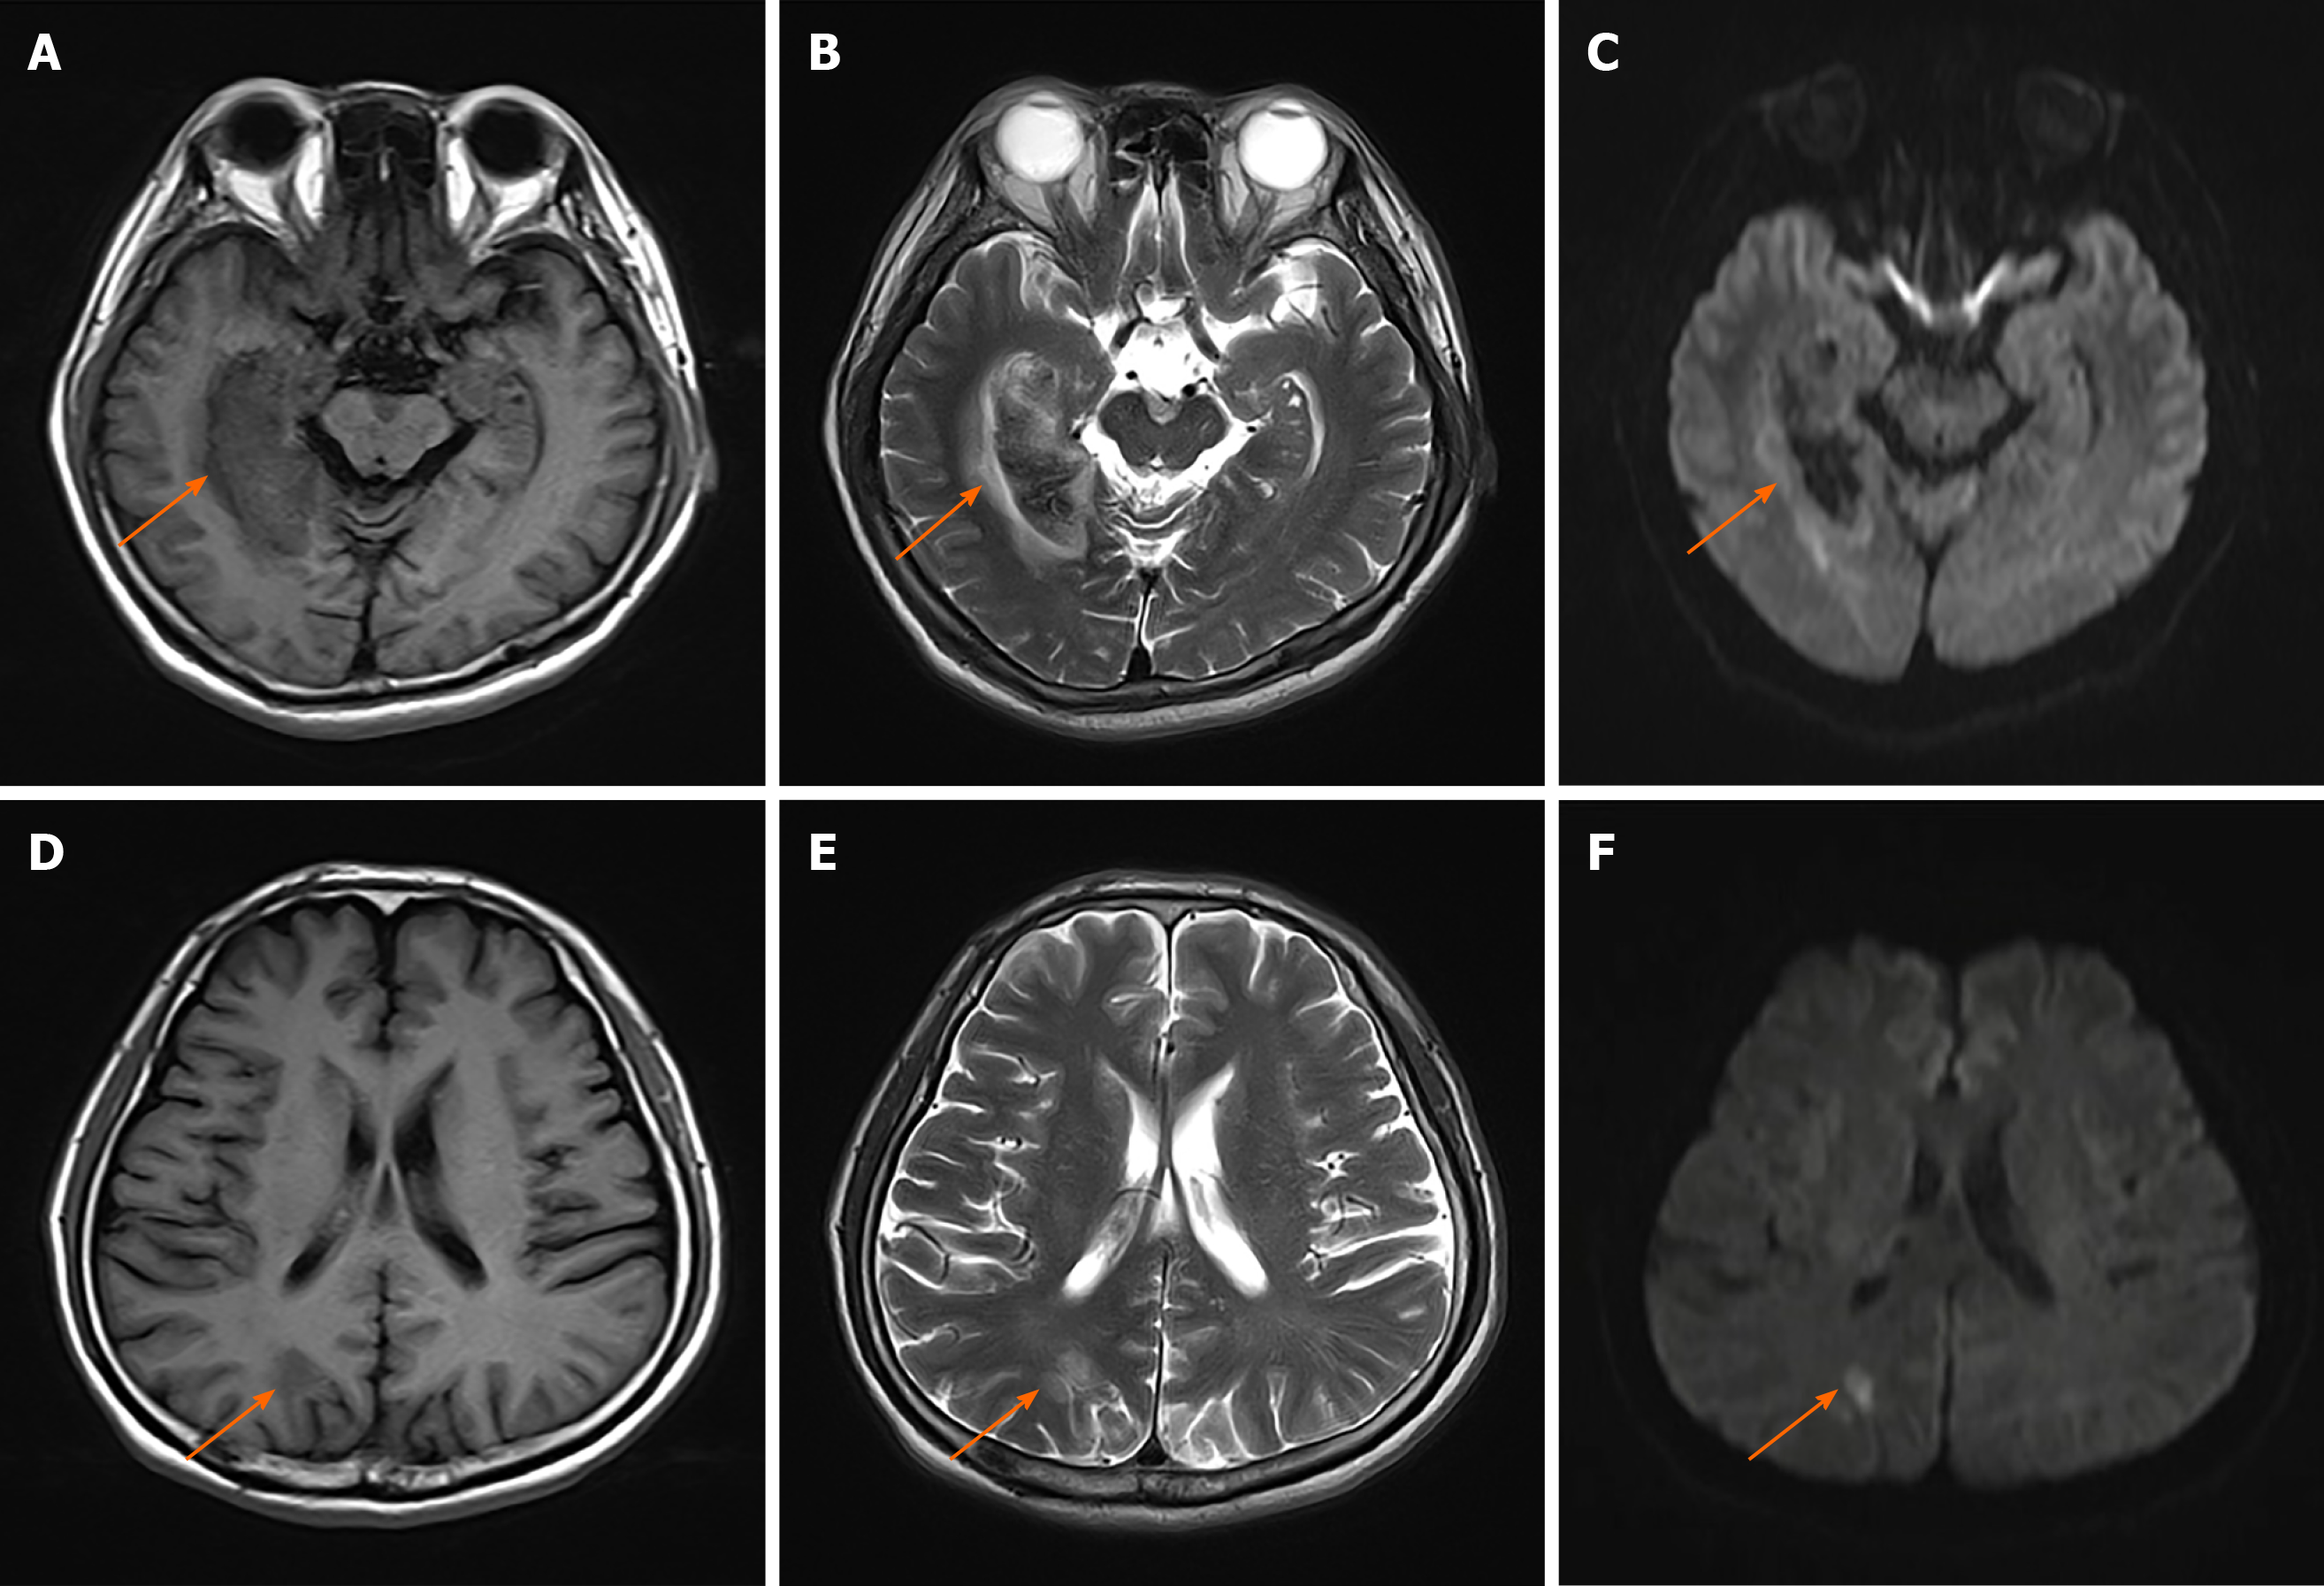
Figure 1 rain magnetic resonance imaging at admission.
A-C: Demonstrating a right occipital-temporal lobe hemorrhagic stroke. T1-weighted (A), T2-weighted (B), diffusion-weighted imaging (DWI) (C); D: T1-weighted presenting an occipital-parietal lobe ischemic stroke; E: T2-weighted presenting an occipital-parietal lobe ischemic stroke; F: DWI presenting an occipital-parietal lobe ischemic stroke. Orange arrowheads indicate the lesions.
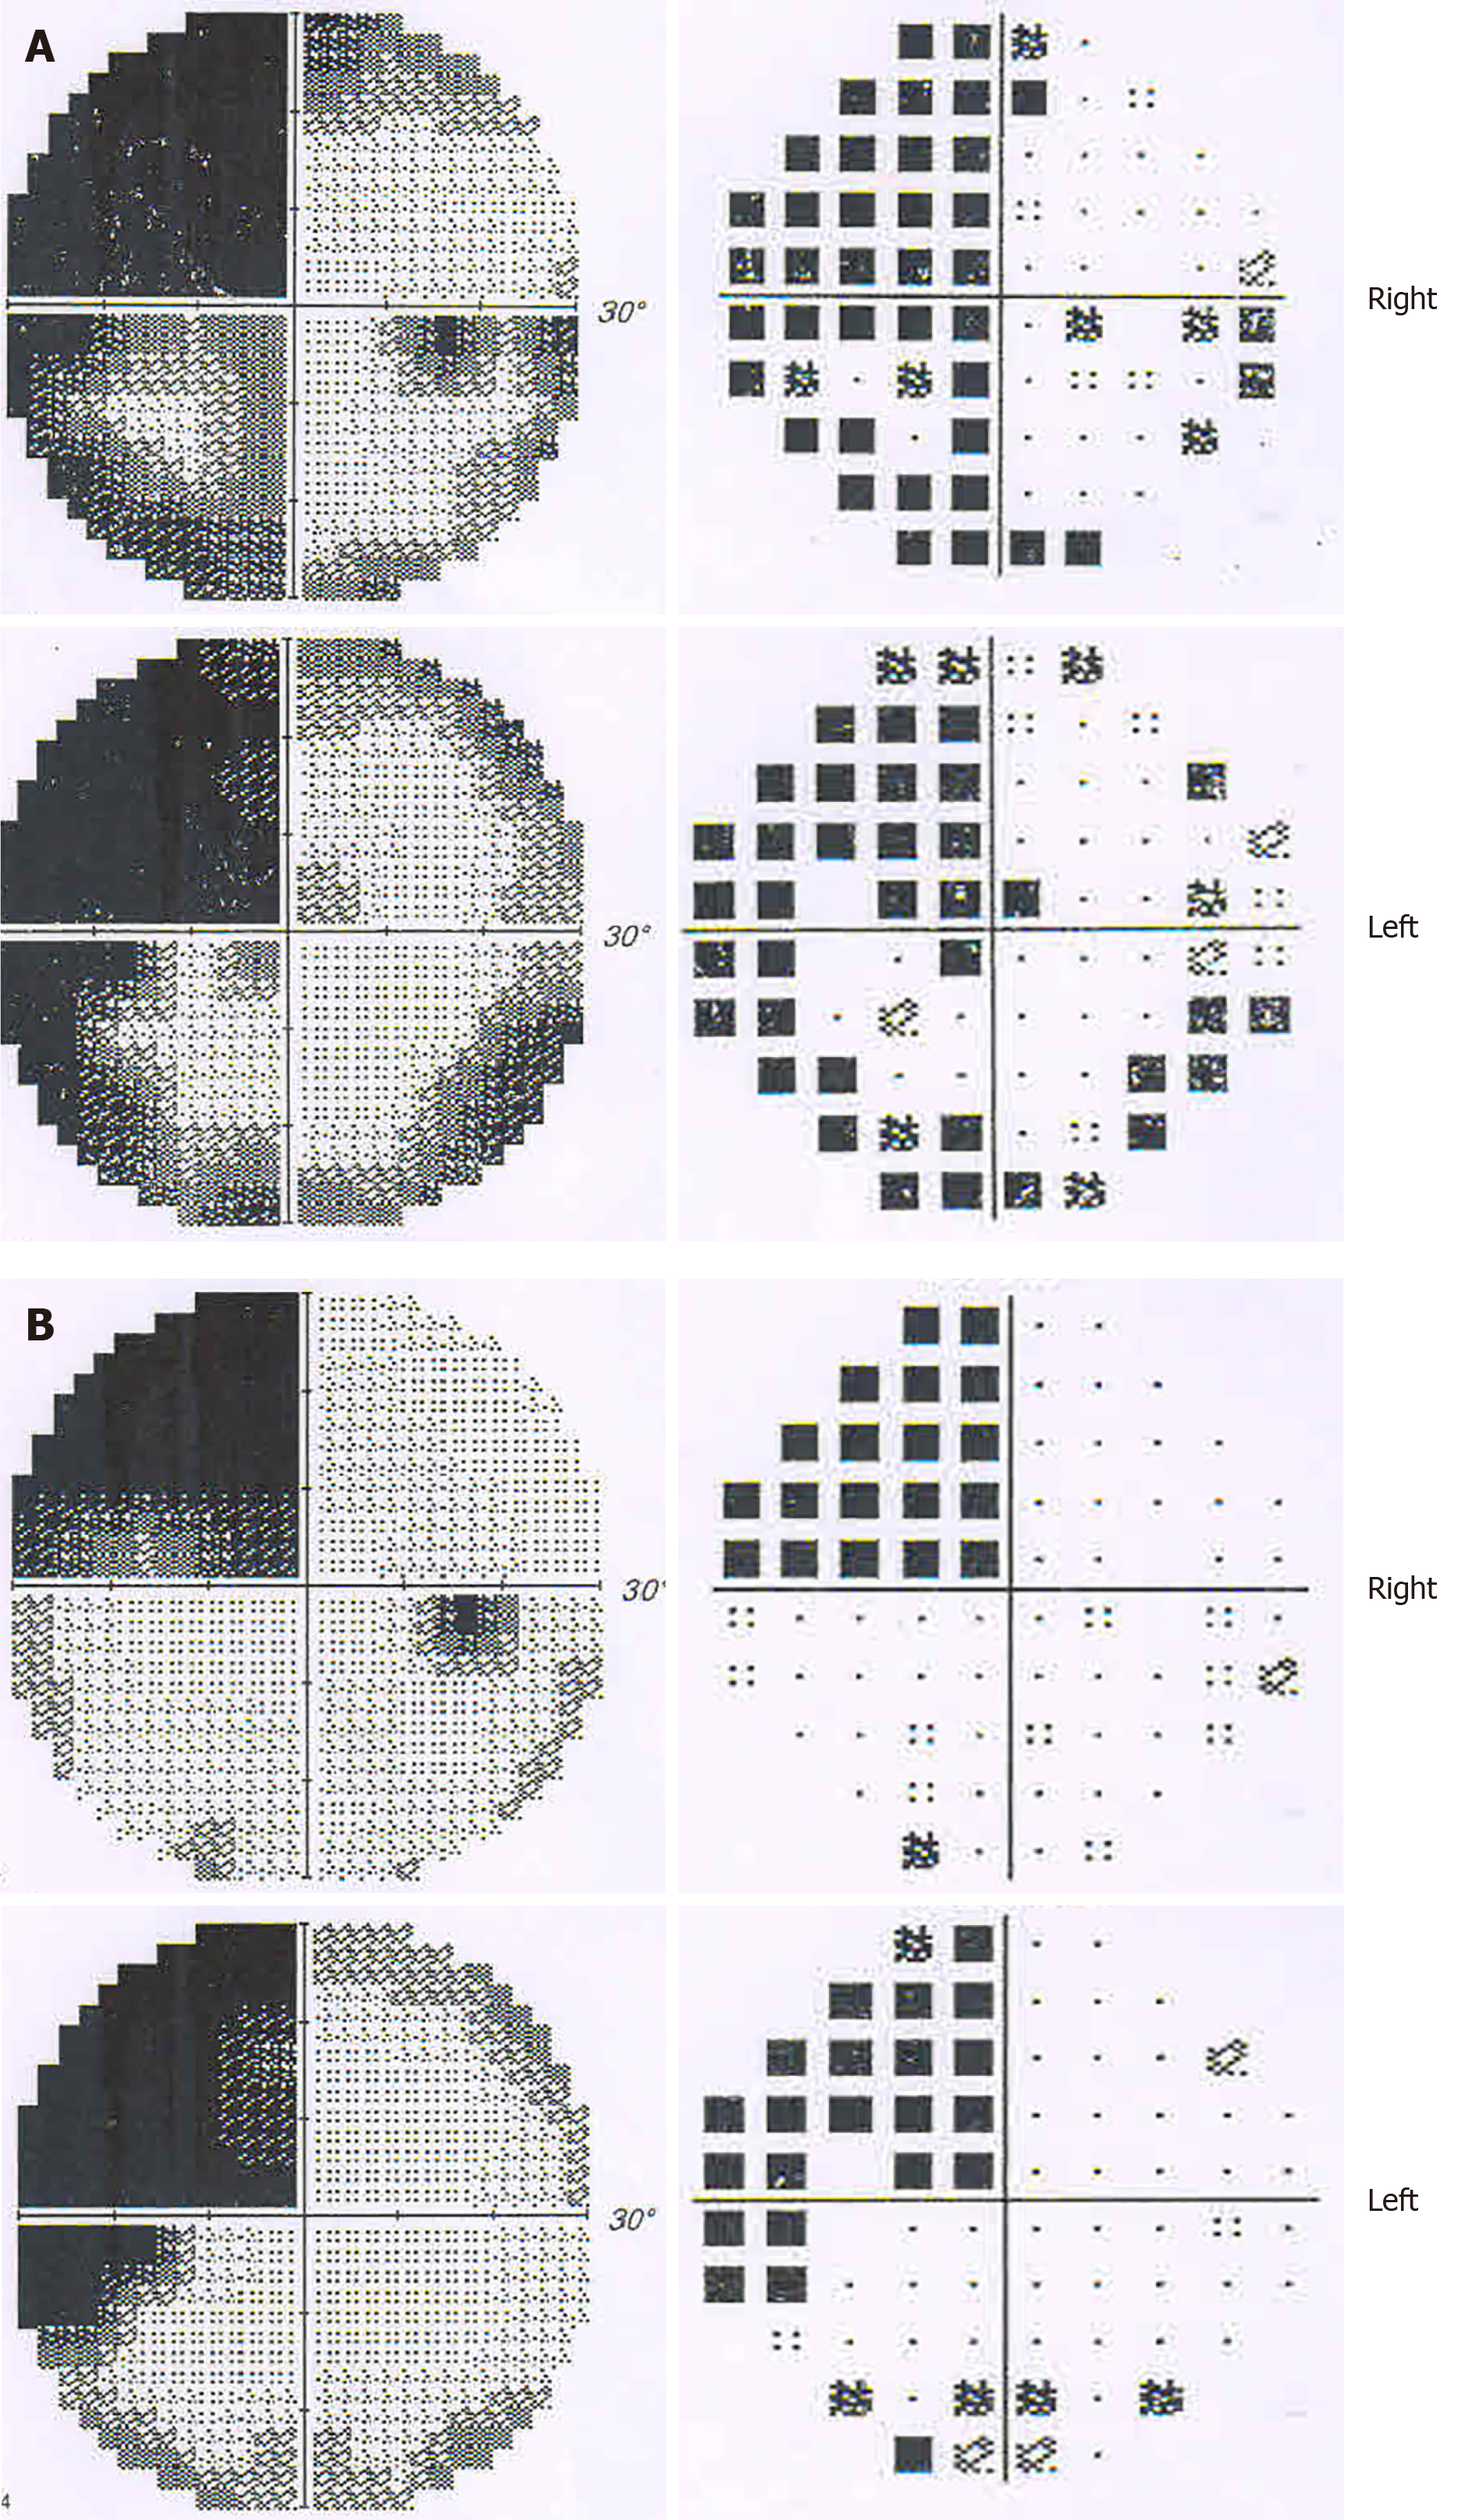
Figure 2 Visual field defect test showing homonymous left upper quadrantanopia.
A: Results of greyscale and pattern deviation at the onset of the stroke. Visual field index (VFI) was 56% in the right eye, and 61% in the left; B: Results of greyscale and pattern deviation after one month. VFI was 74% in both eyes.
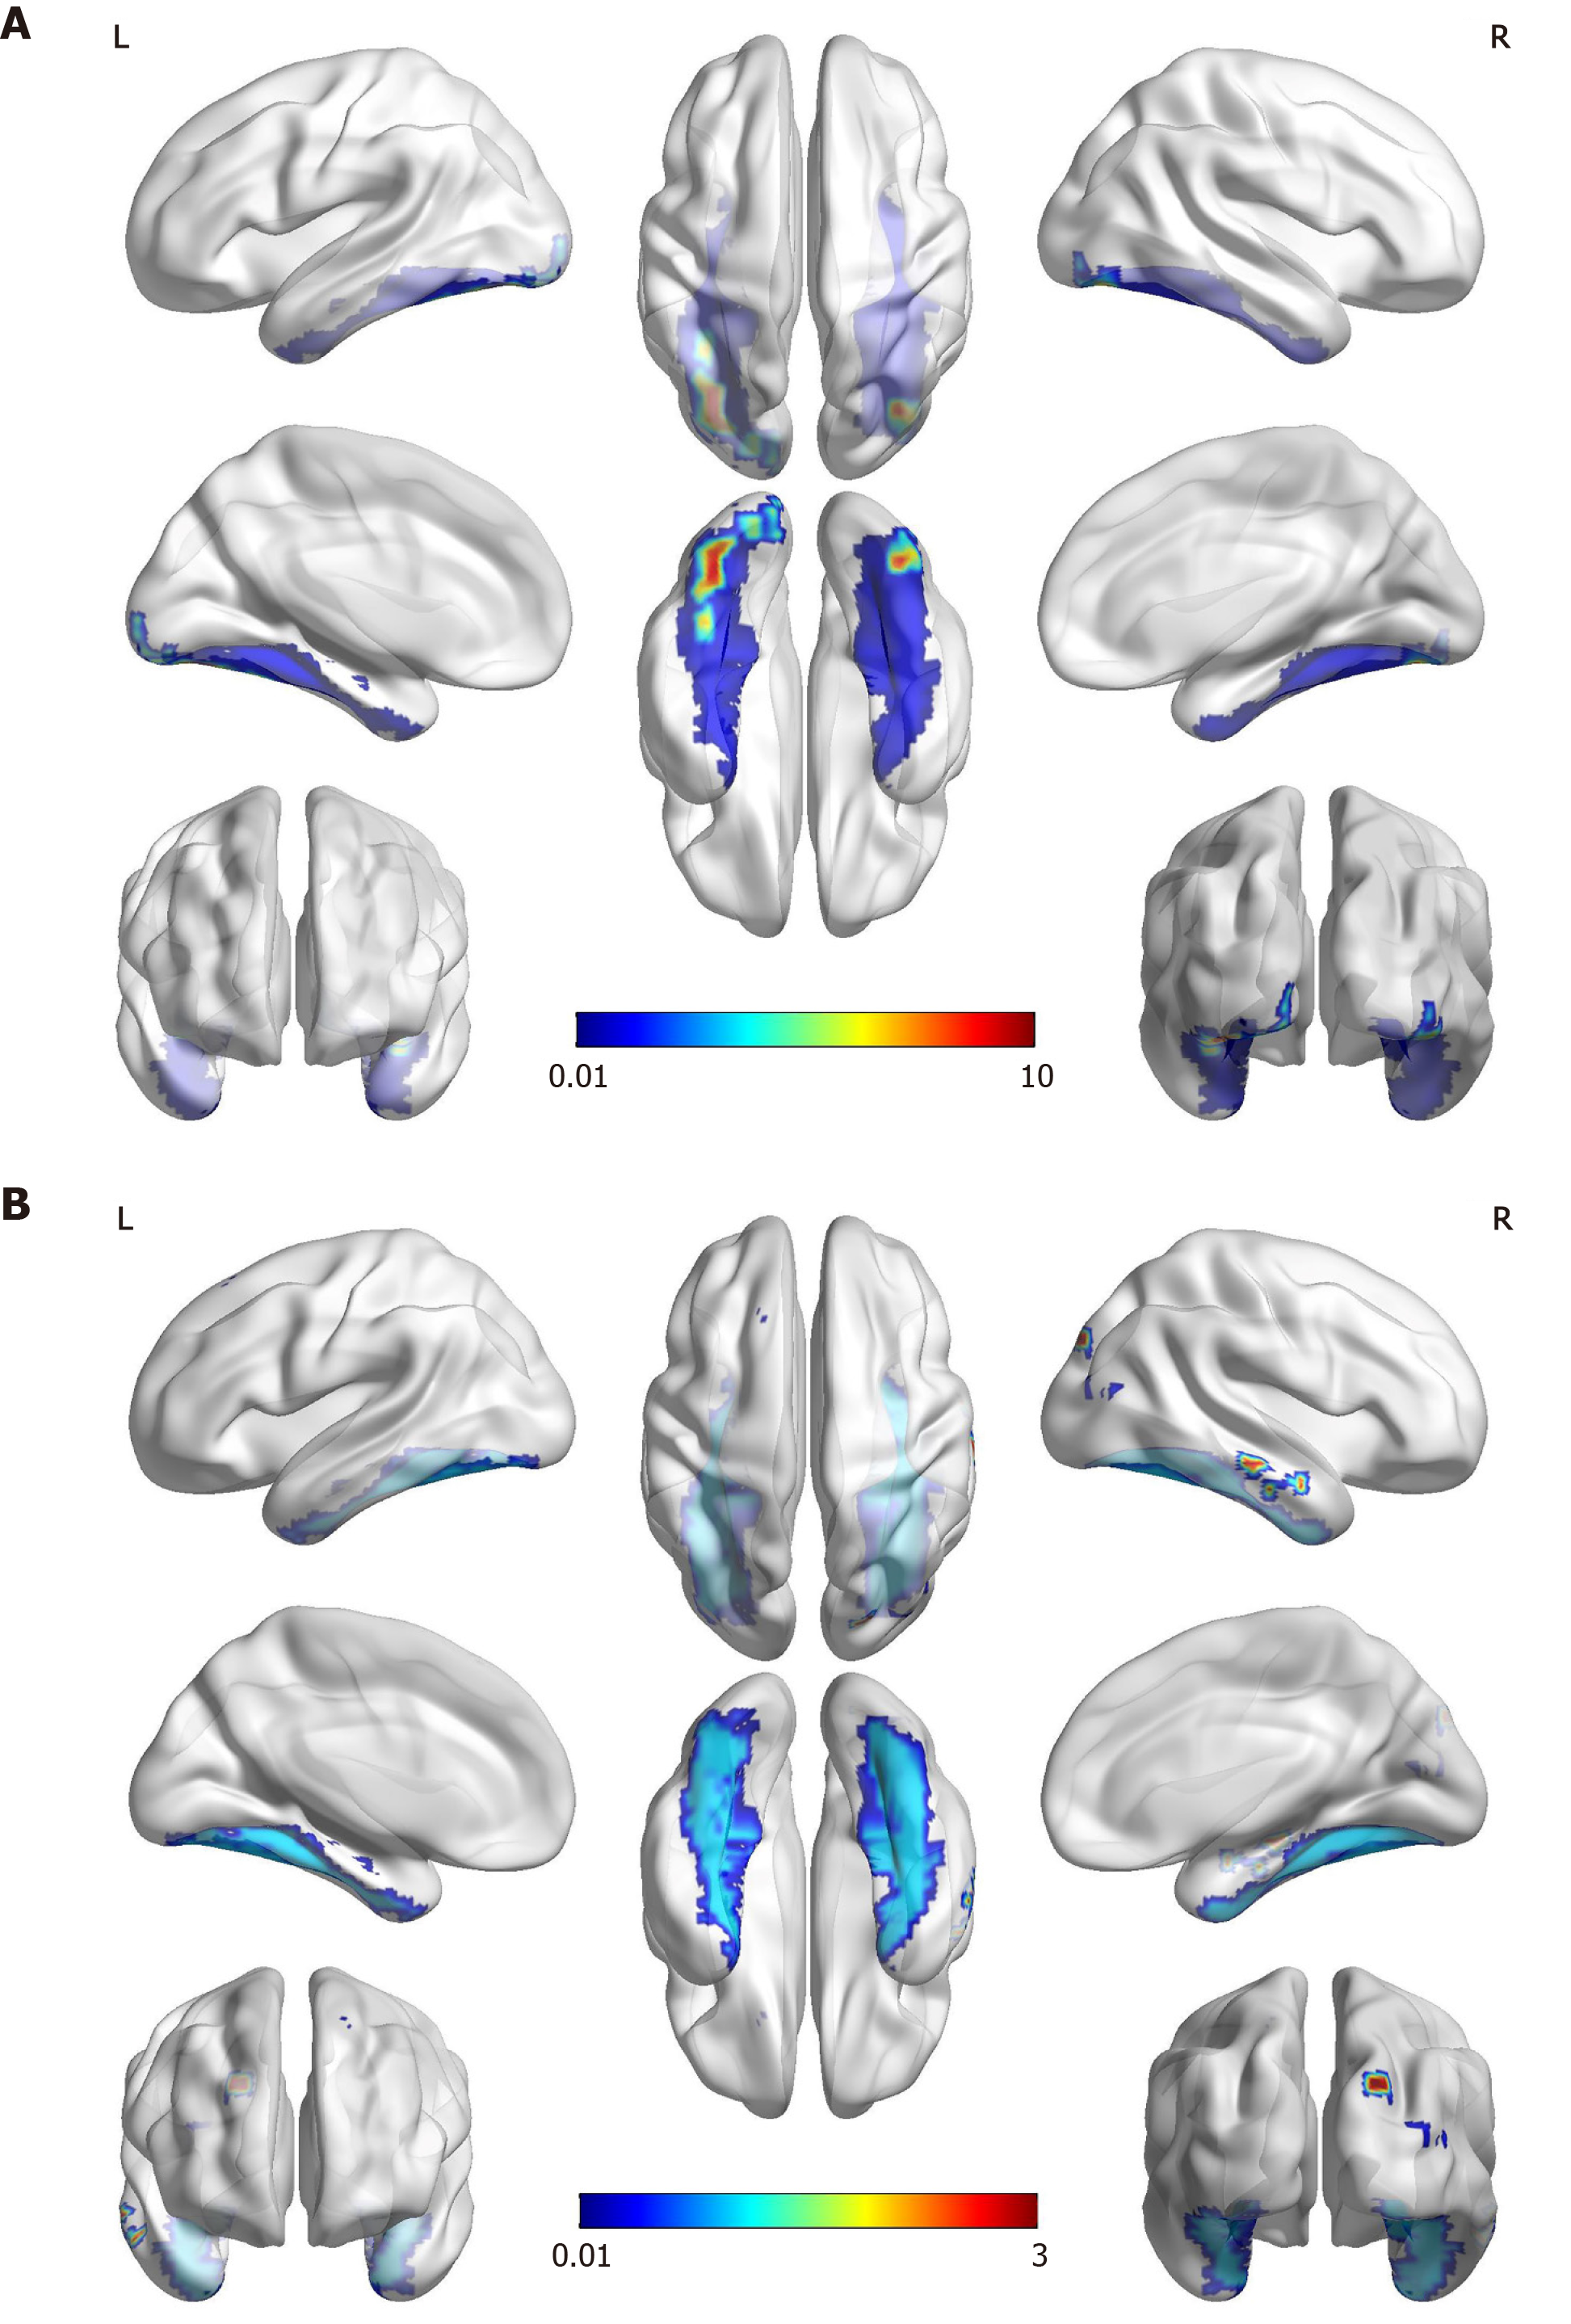
Figure 3 Functional magnetic resonance imaging.
A: The famous faces task performed two months after the onset of stroke showed activation in the anterior of the bilateral fusiform gyrus that was more significant on the left (red and yellow). The areas of activation are correlated with the fusiform gyrus (blue), which most likely corresponds to the “fusiform face area”; B: The object/landscape task demonstrated activation in the area of the right occipital lobe, which is distinct from the face recognition area.
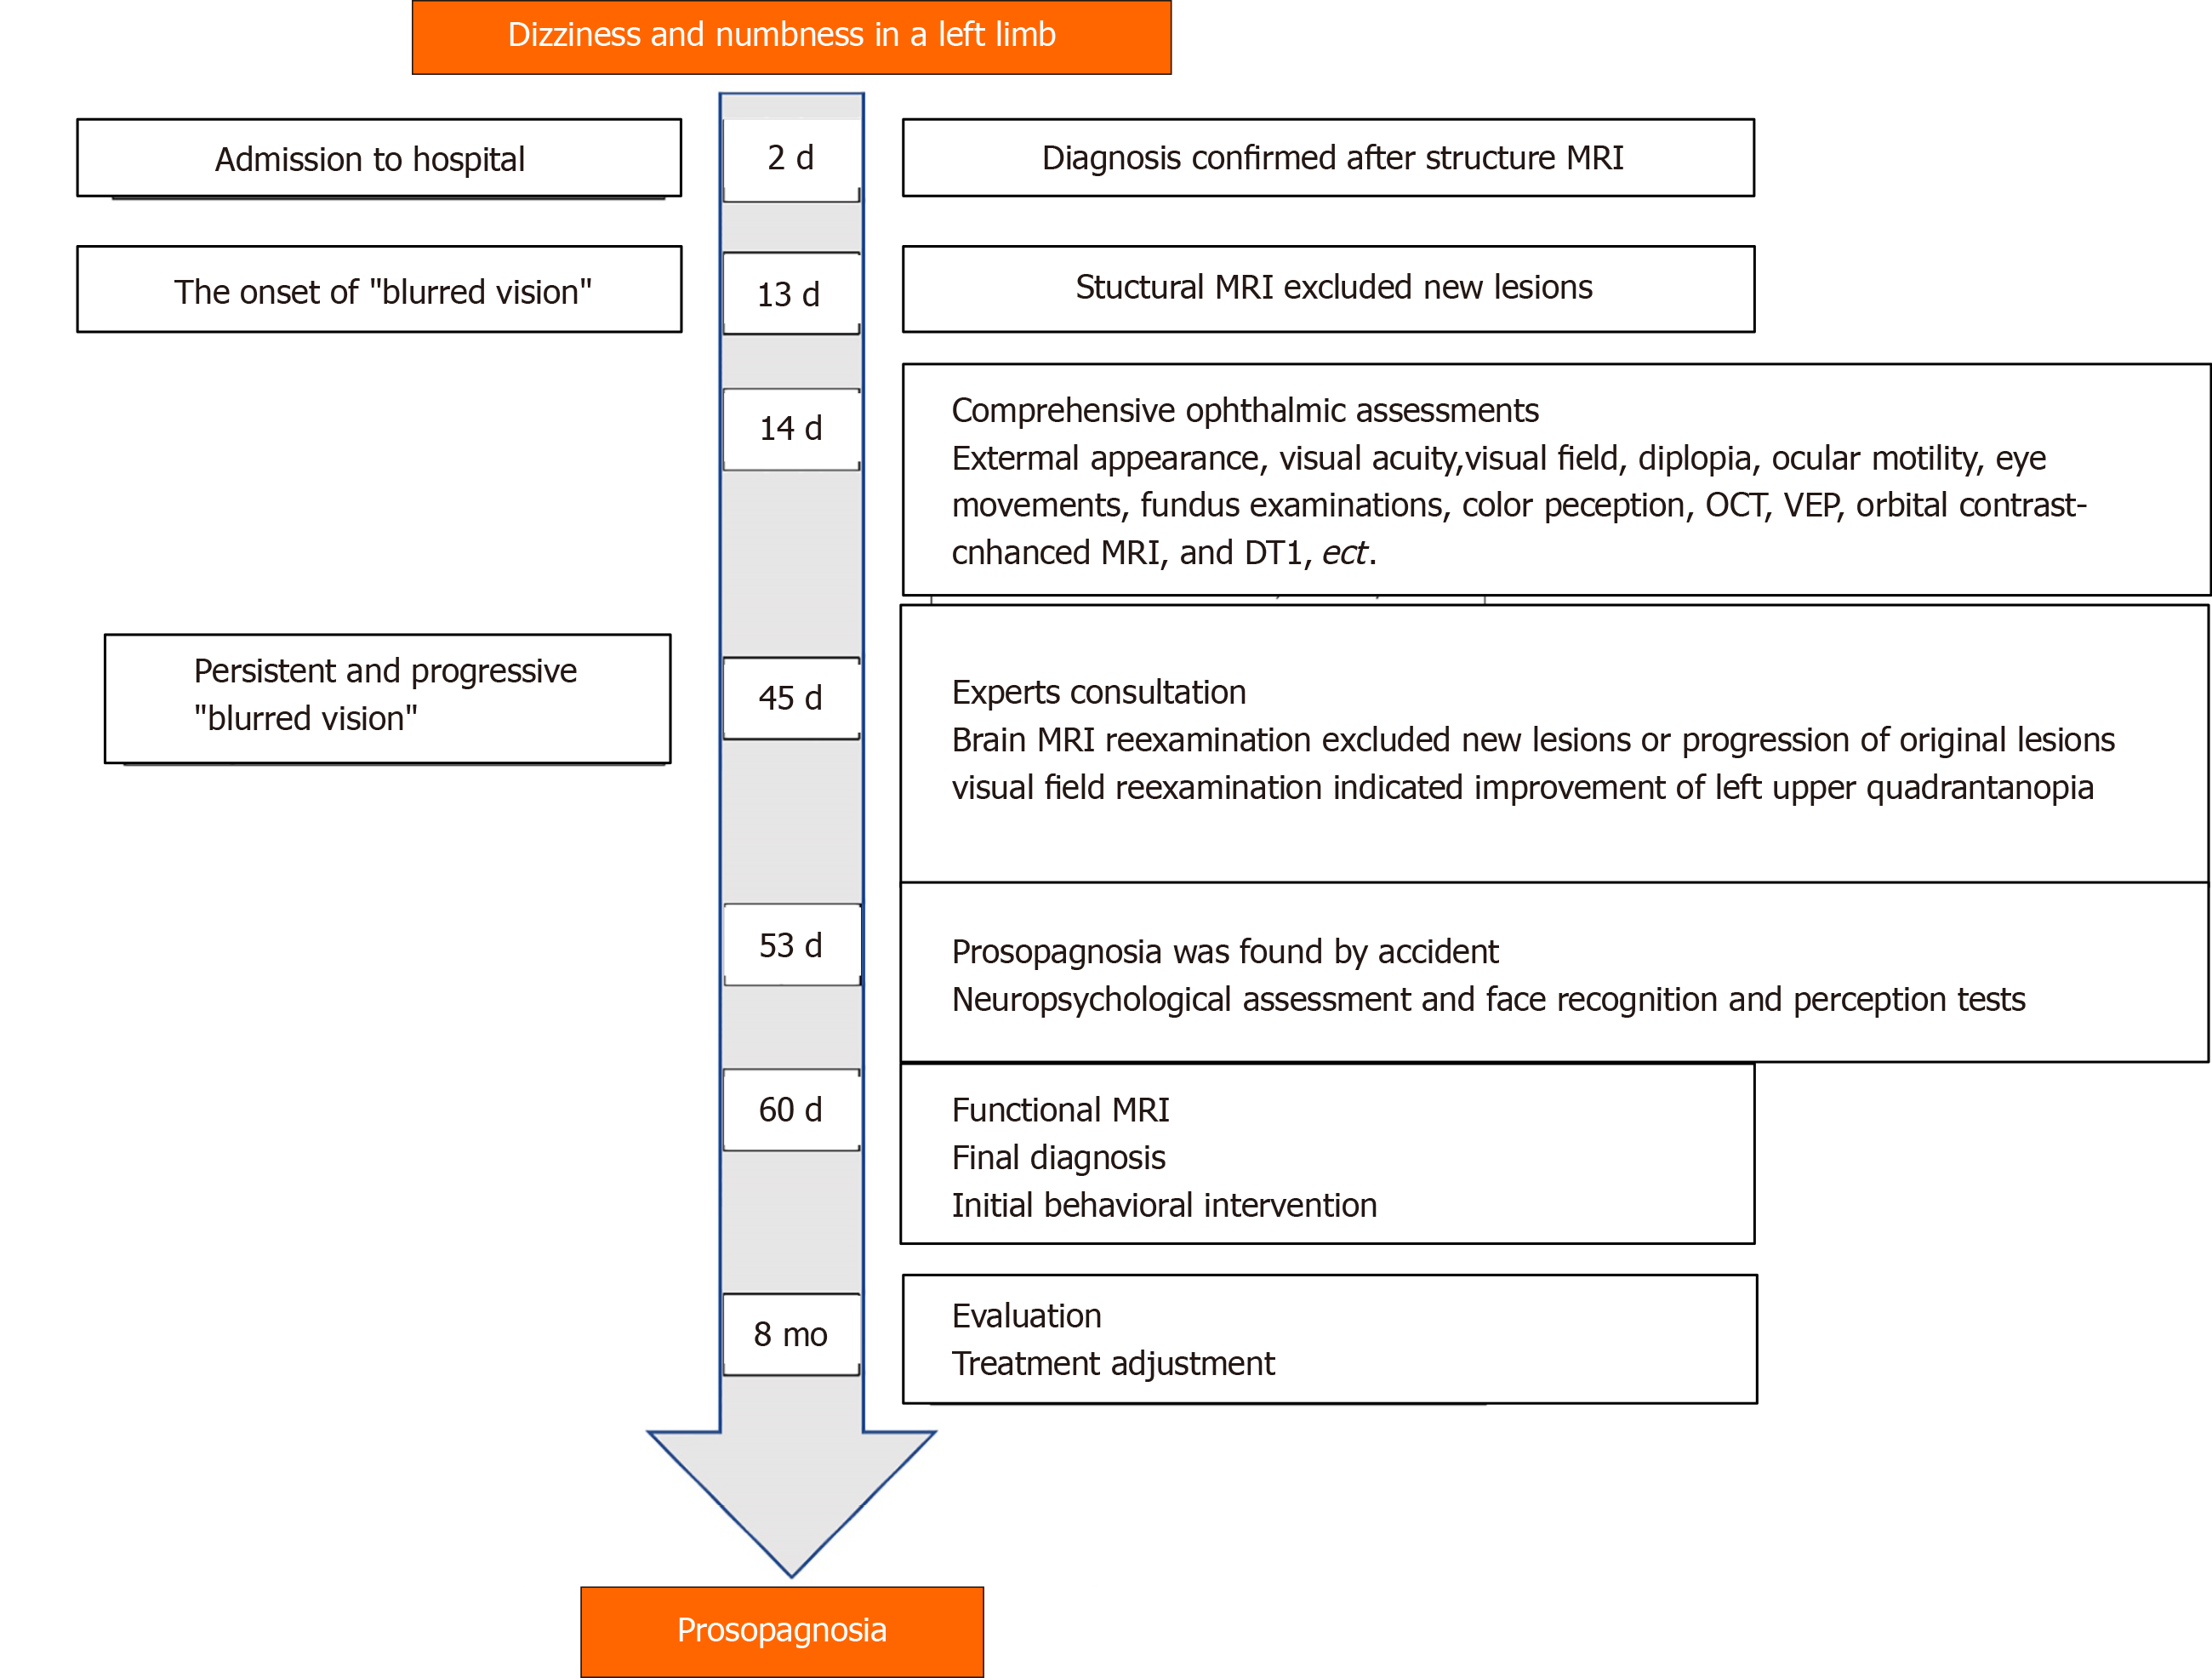
Figure 4 Case timeline.
MRI: Magnetic resonance imaging; OCT: Optical coherence tomography; VEP: Visual Evoked Potential; DTI: Magnetic resonance diffusion tensor imaging.
- Citation: Yuan Y, Huang F, Gao ZH, Cai WC, Xiao JX, Yang YE, Zhu PL. Delayed diagnosis of prosopagnosia following a hemorrhagic stroke in an elderly man: A case report. World J Clin Cases 2020; 8(24): 6487-6498
- URL: https://www.wjgnet.com/2307-8960/full/v8/i24/6487.htm
- DOI: https://dx.doi.org/10.12998/wjcc.v8.i24.6487


