Copyright
©The Author(s) 2020.
World J Clin Cases. Dec 26, 2020; 8(24): 6252-6263
Published online Dec 26, 2020. doi: 10.12998/wjcc.v8.i24.6252
Published online Dec 26, 2020. doi: 10.12998/wjcc.v8.i24.6252
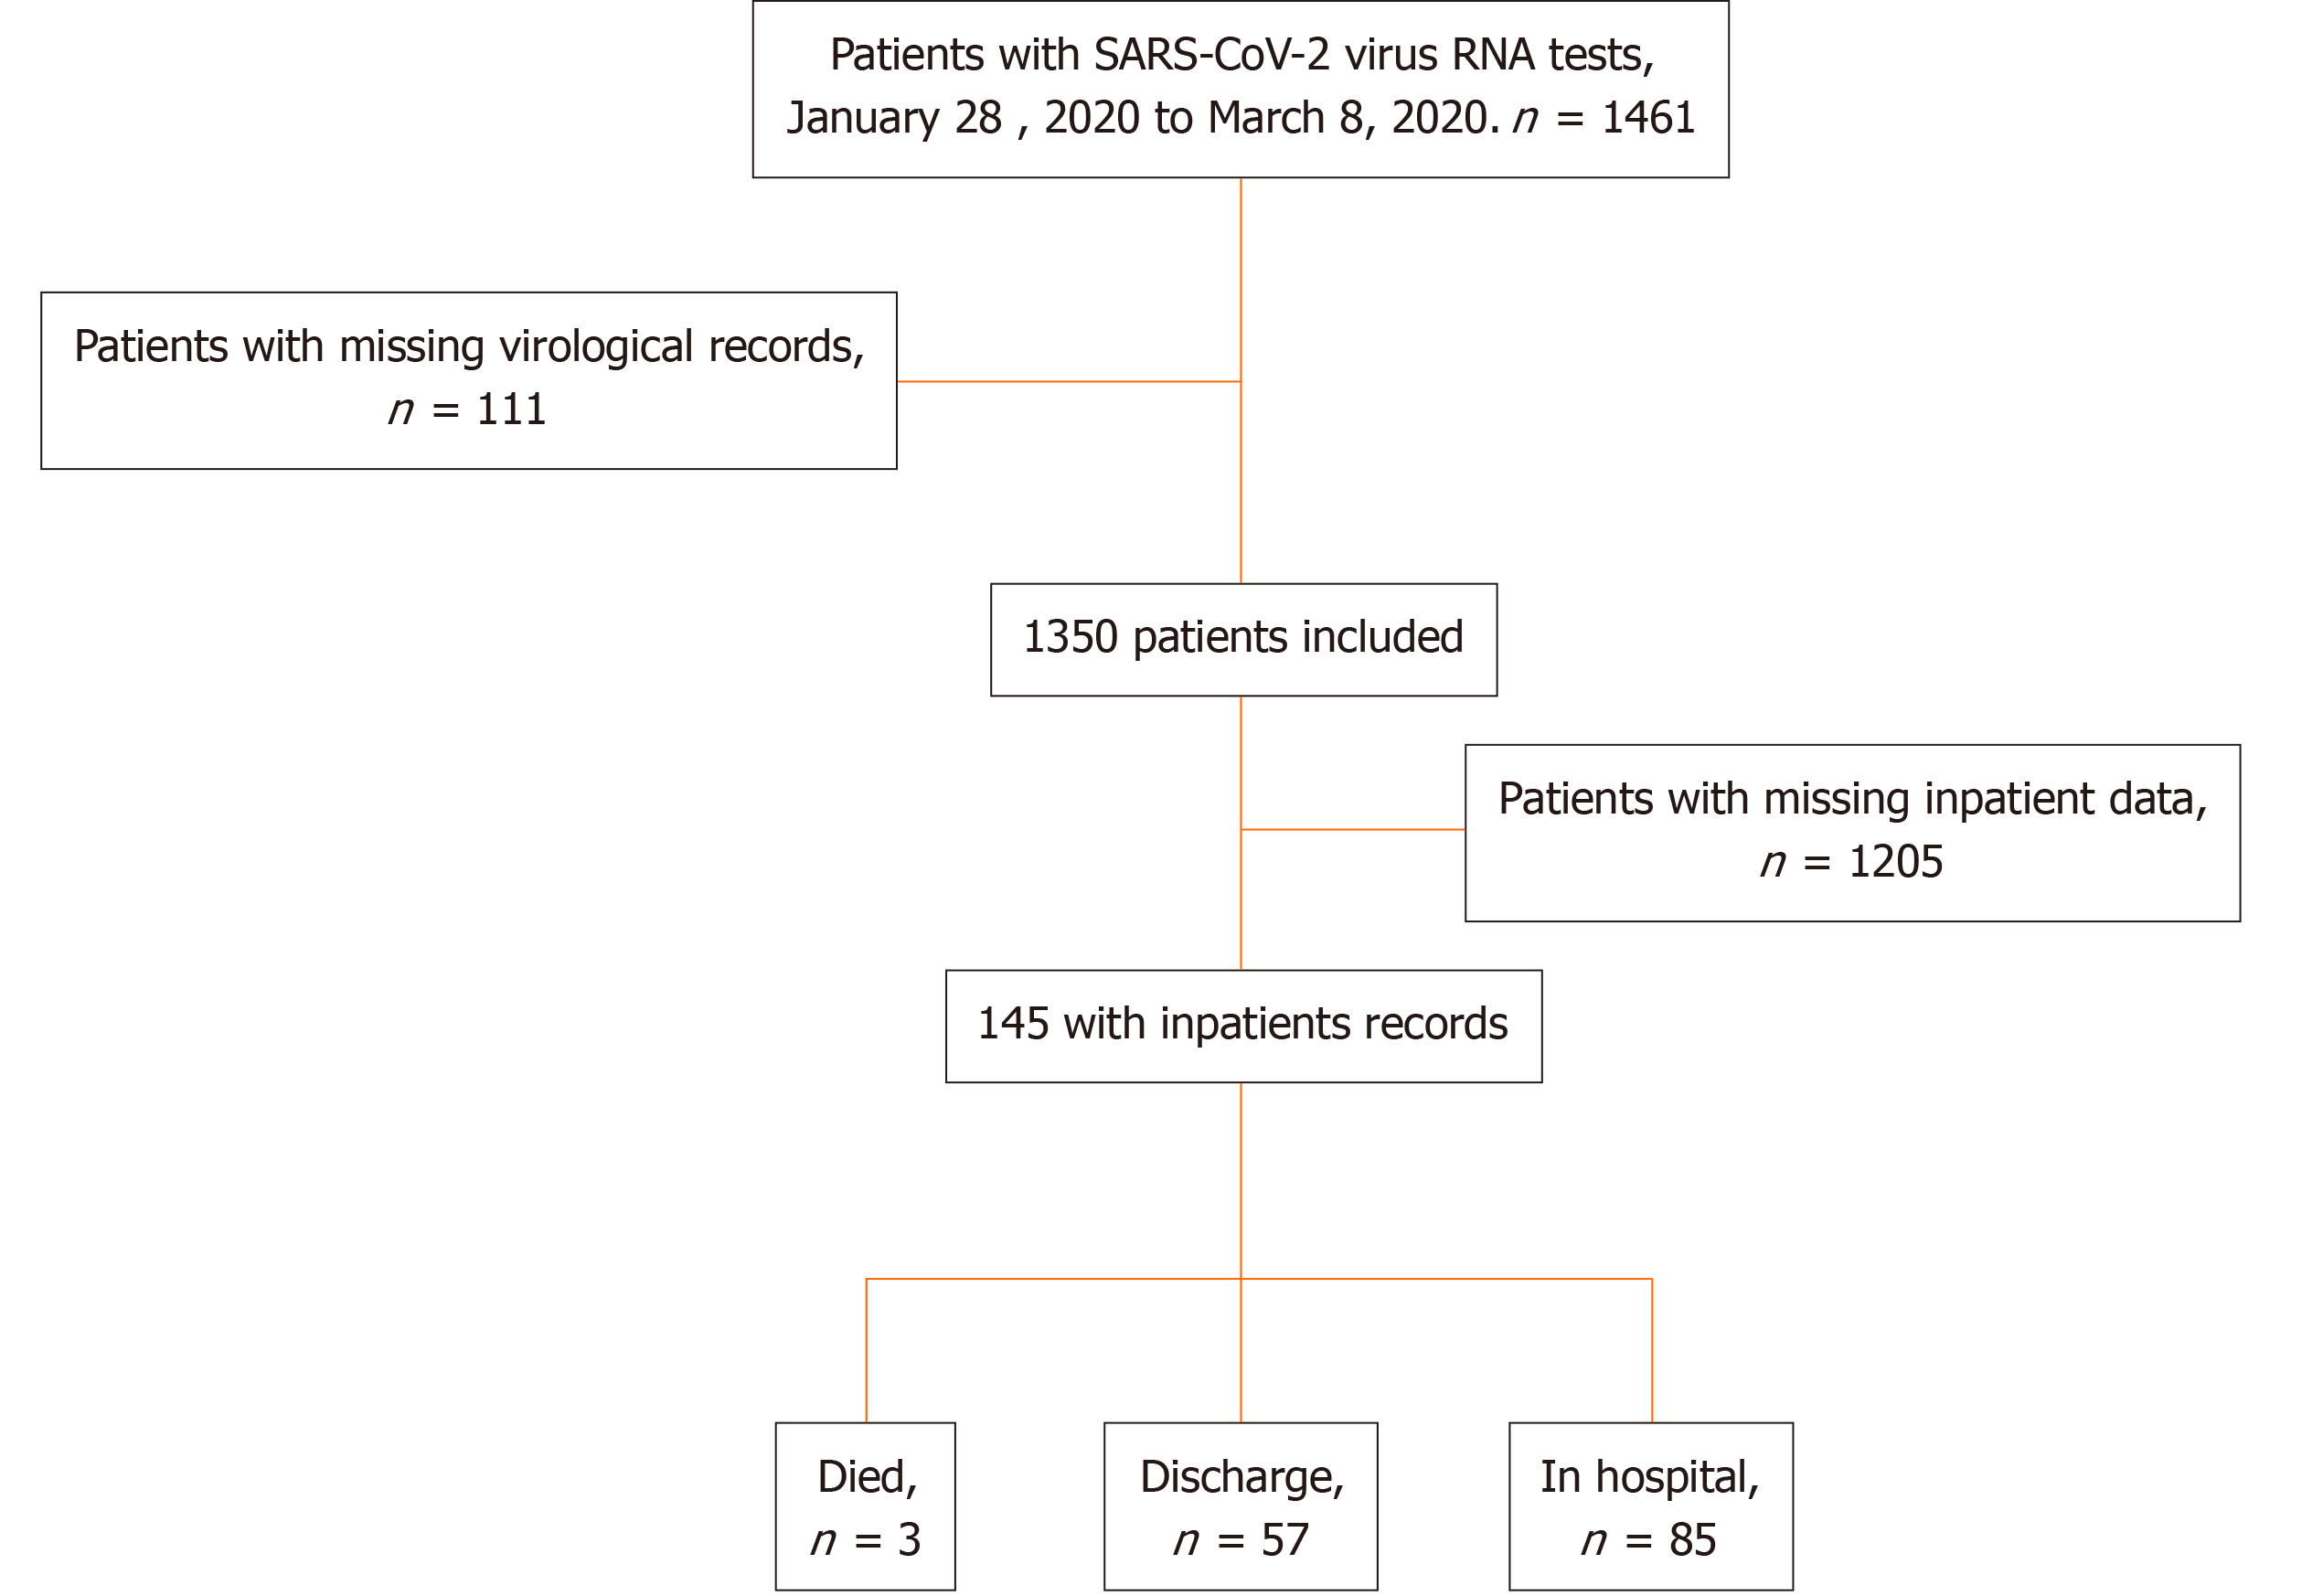
Figure 1 Patient flowchart.
SARS-Cov-2: Severe acute respiratory syndrome coronavirus 2.
Figure 2 Box plot showing the cycle threshold value differences at the day of hospital admission.
A: Duration of intensive care unit stay (< 7 vs ≥ 7 d) (one-sided t test, P = 0.02); B: Vital status (death or not) (one-sided t test, P < 0.0001); C: Procedures (mechanical ventilation needed or not) (one-sided t test, P = 0.009); D: Results at admission (interleukin 6) (one-sided t test, P = 0.05). Ct: Cycle threshold; MV: Mechanic ventilation; IL-6; Interleukin 6; ICU: Intensive care unit.
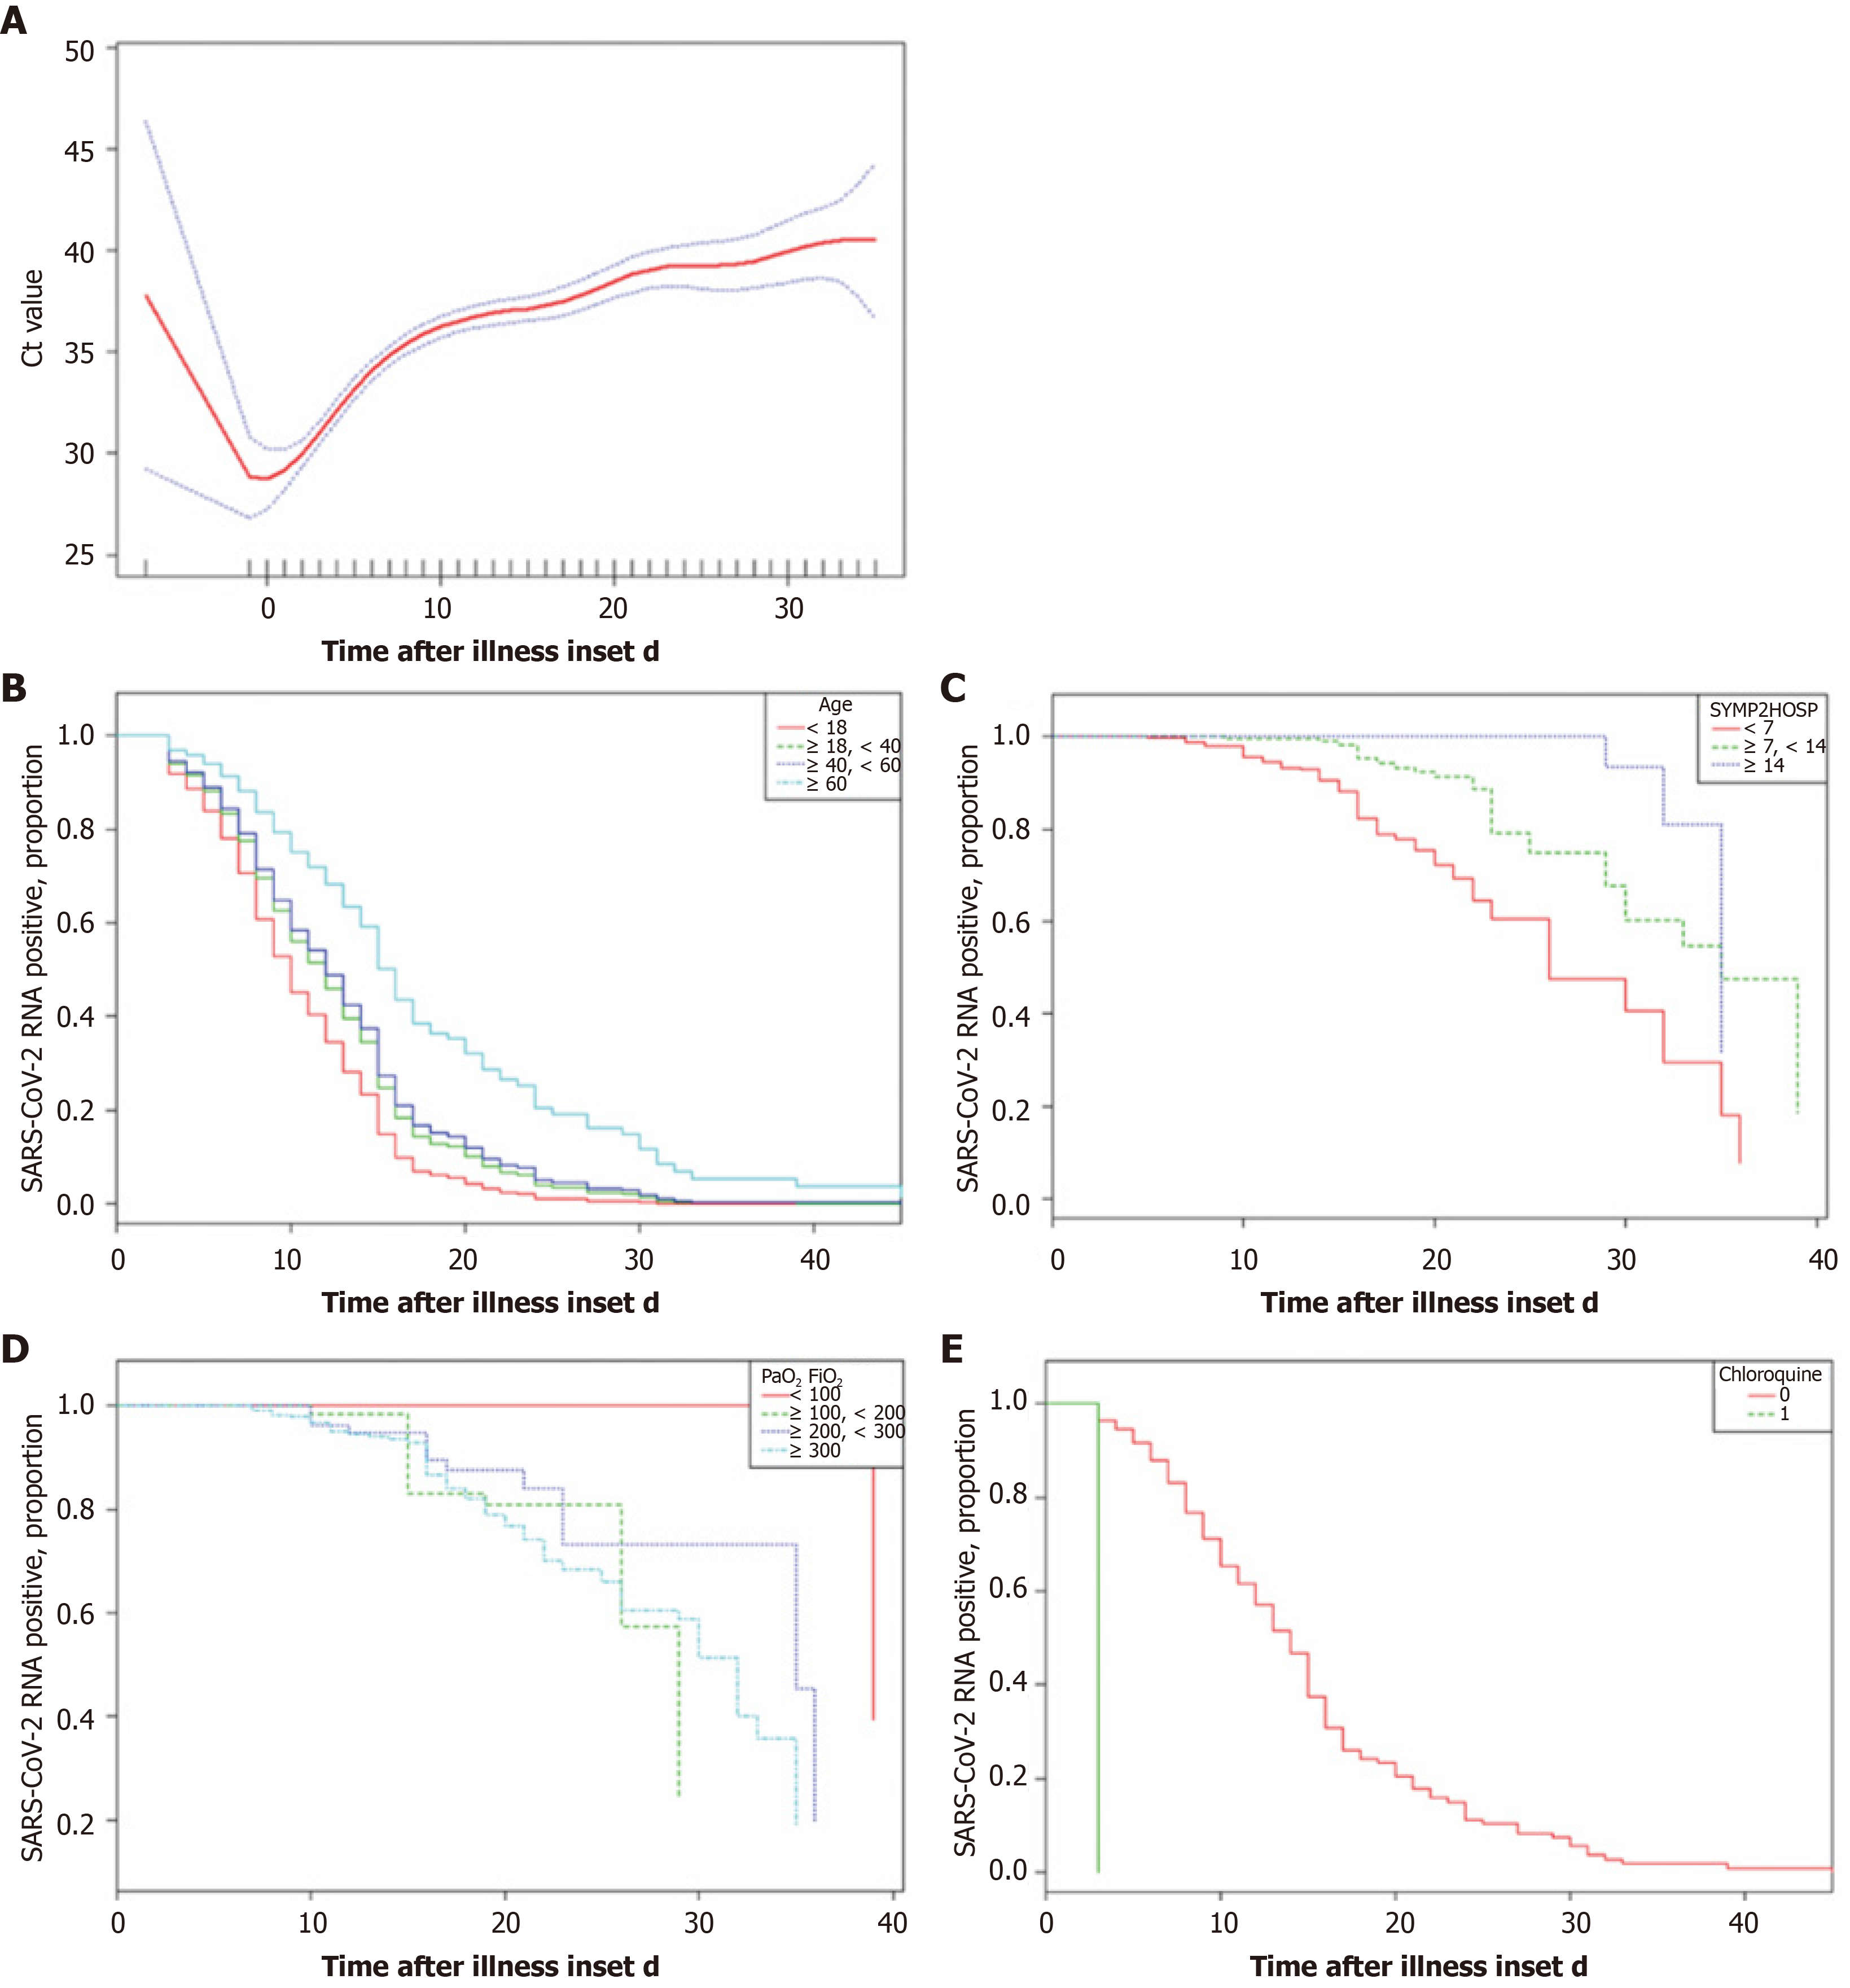
Figure 3 Factors associated with the duration of viral shedding.
A: Changes in cycle threshold values during hospitalization using generalized additive models (F: 46.54, P < 0.0001, adjusted for sex and age); B: From symptom onset to hospital admission (χ2: 85.31, P < 0.0001); C: Cumulative proportions of patients with symptom onset to admission < 7 d, 7-14 d, and > 14 d (χ2 = 76.58, P < 0.001); D: Cumulative proportions of patients with PaO2/FiO2 < 100, 100-200, > 200 (χ2 = 53.74, P < 0.0001) at admission; E: Cumulative proportion of patients with chloroquine or without (P < 0.0001). Ct: Cycle threshold; SARS-Cov-2: Severe acute respiratory syndrome coronavirus 2.
- Citation: Chen PF, Yu XX, Liu YP, Ren D, Shen M, Huang BS, Gao JL, Huang ZY, Wu M, Wang WY, Chen L, Shi X, Wang ZQ, Liu YX, Liu L, Liu Y. Virus load and virus shedding of SARS-CoV-2 and their impact on patient outcomes. World J Clin Cases 2020; 8(24): 6252-6263
- URL: https://www.wjgnet.com/2307-8960/full/v8/i24/6252.htm
- DOI: https://dx.doi.org/10.12998/wjcc.v8.i24.6252


