Copyright
©The Author(s) 2020.
World J Clin Cases. Dec 6, 2020; 8(23): 6172-6180
Published online Dec 6, 2020. doi: 10.12998/wjcc.v8.i23.6172
Published online Dec 6, 2020. doi: 10.12998/wjcc.v8.i23.6172
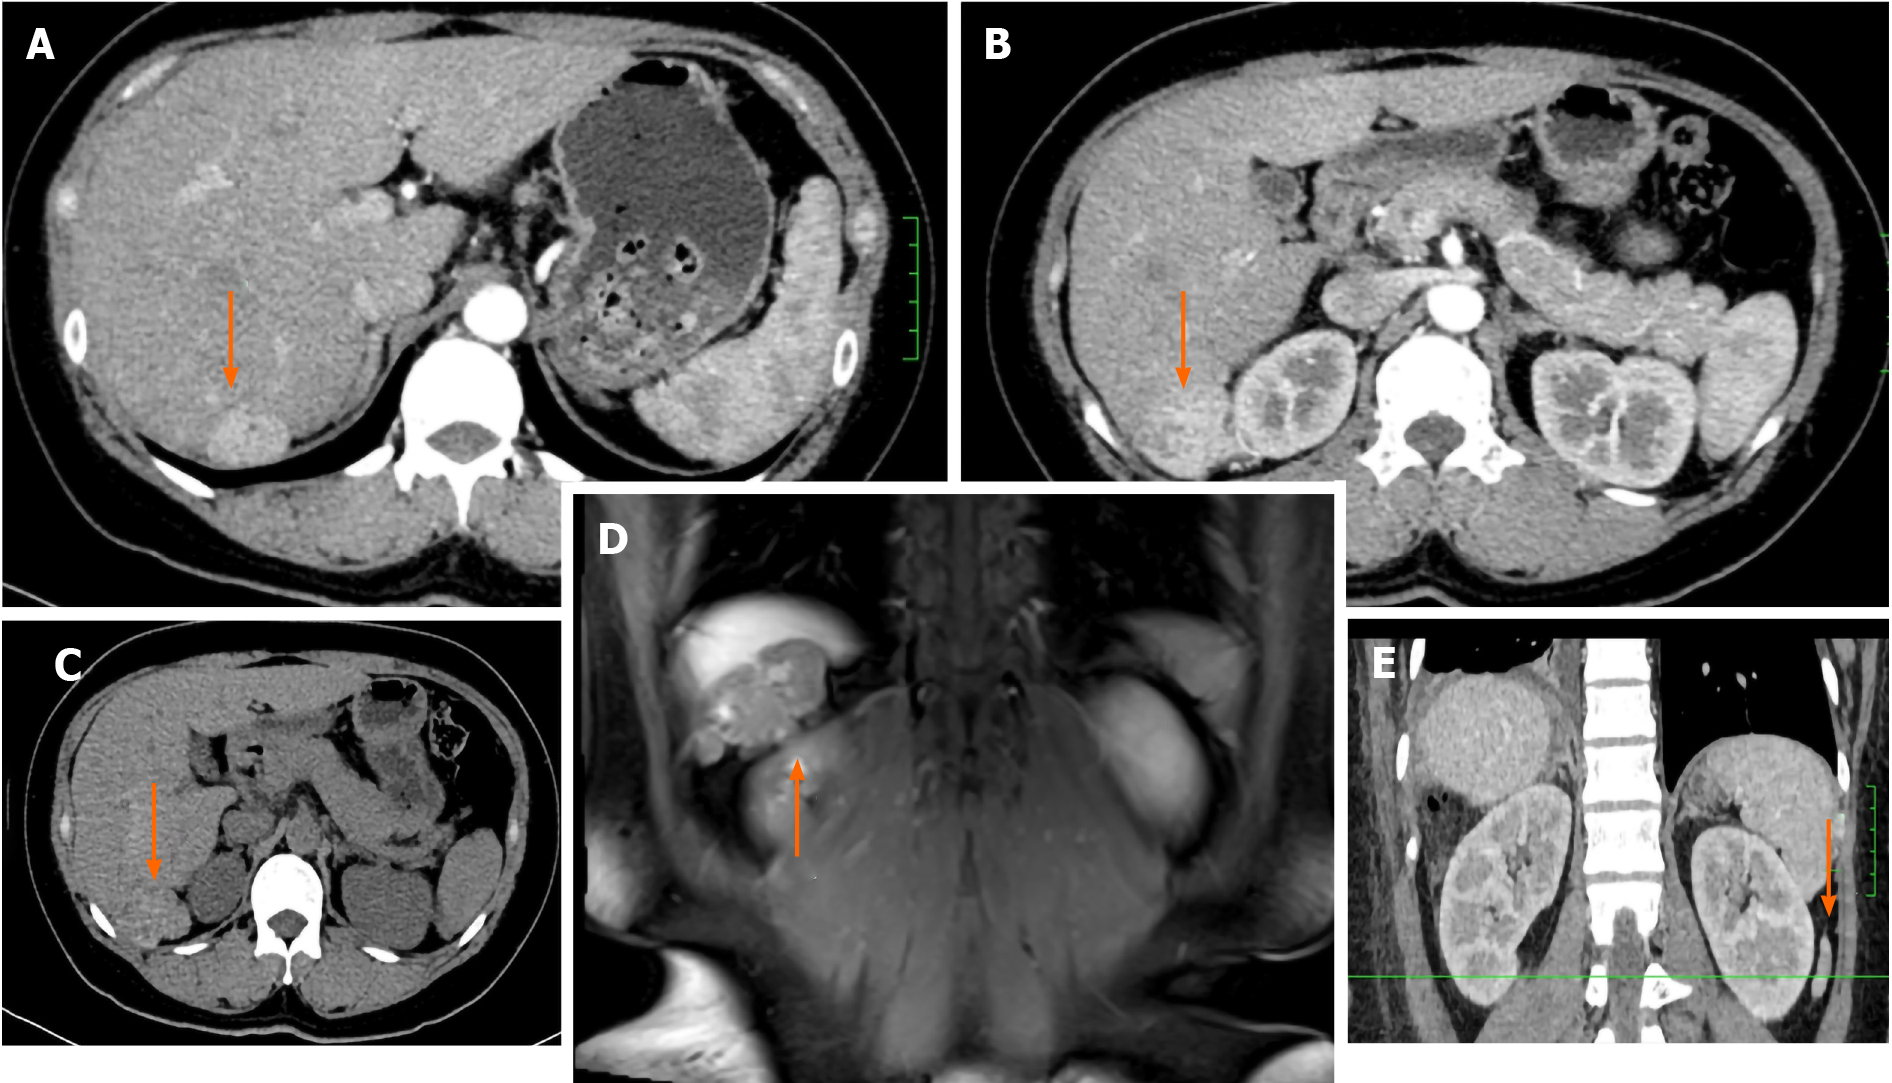
Figure 1 Computed tomography and magnetic resonance imaging of the abdomen.
Computed tomography (CT) axial sections and sagittal section show three ectopic hyperdense lesions located in the liver, diaphragm, and retroperitoneum, respectively. Magnetic resonance imaging (MRI) coronal section shows thyroid ectopia in the liver and diaphragm. A-C: CT axial sections (orange arrow); D: MRI coronal section (orange arrow); E: CT sagittal section (orange arrow).
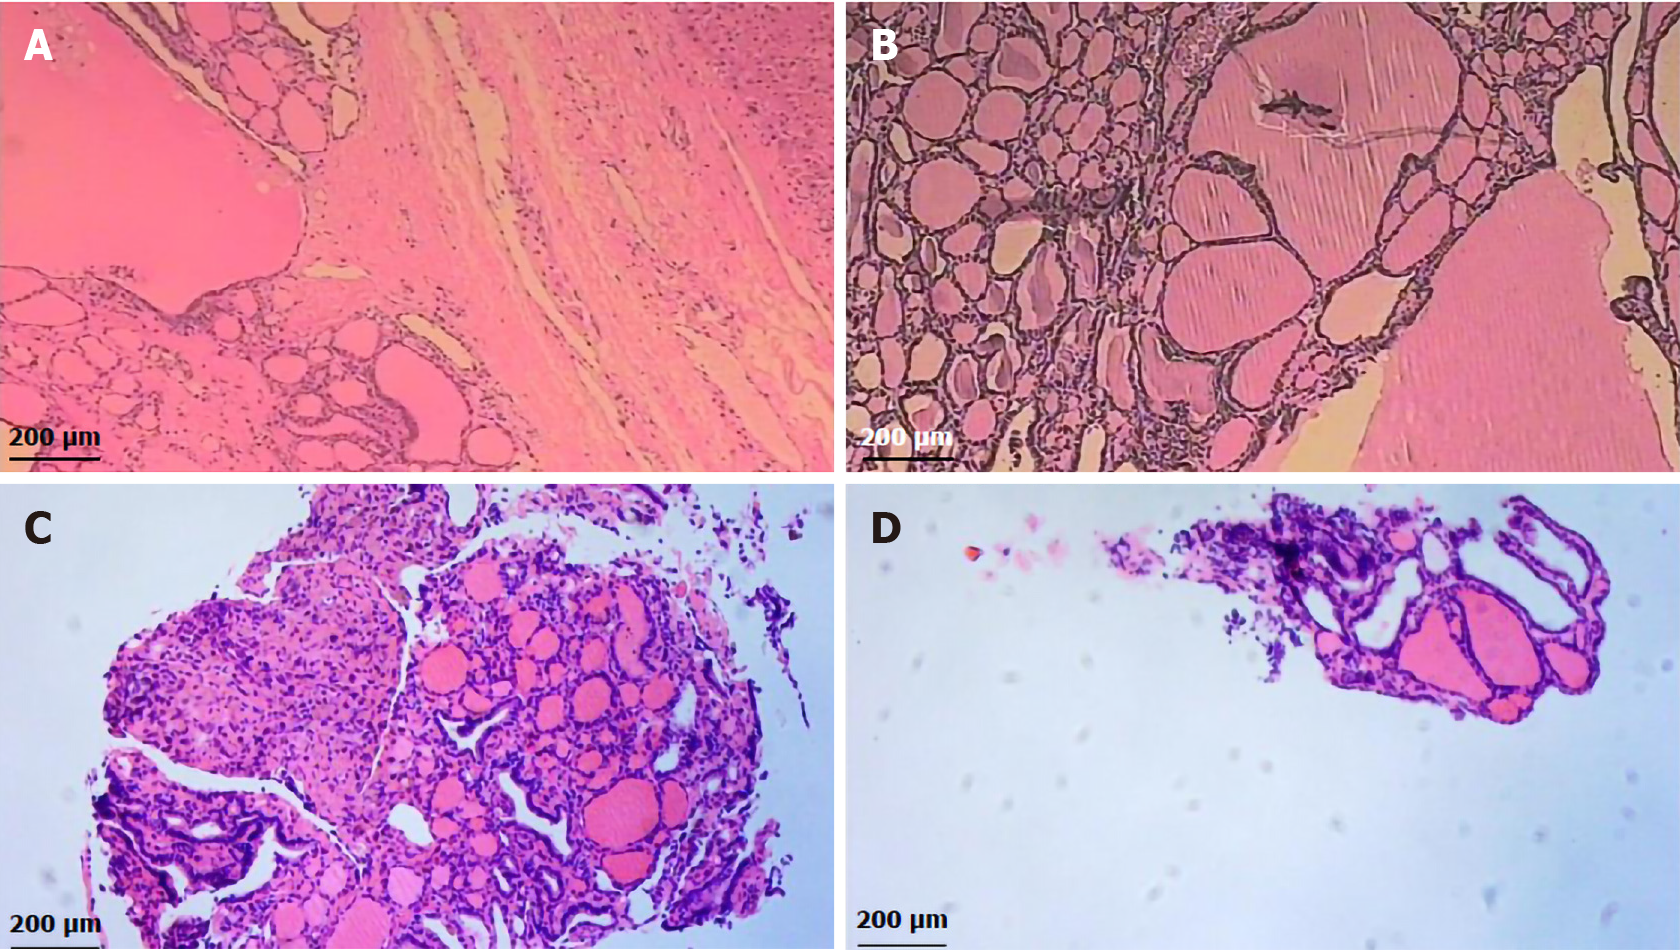
Figure 2 Hematoxylin and eosin stain results.
The histopathological findings confirmed ectopic goiter. A: Liver; B: Diaphragm; C: Left renal fascia; D: Anterior abdominal wall. Bar, 200 μm.
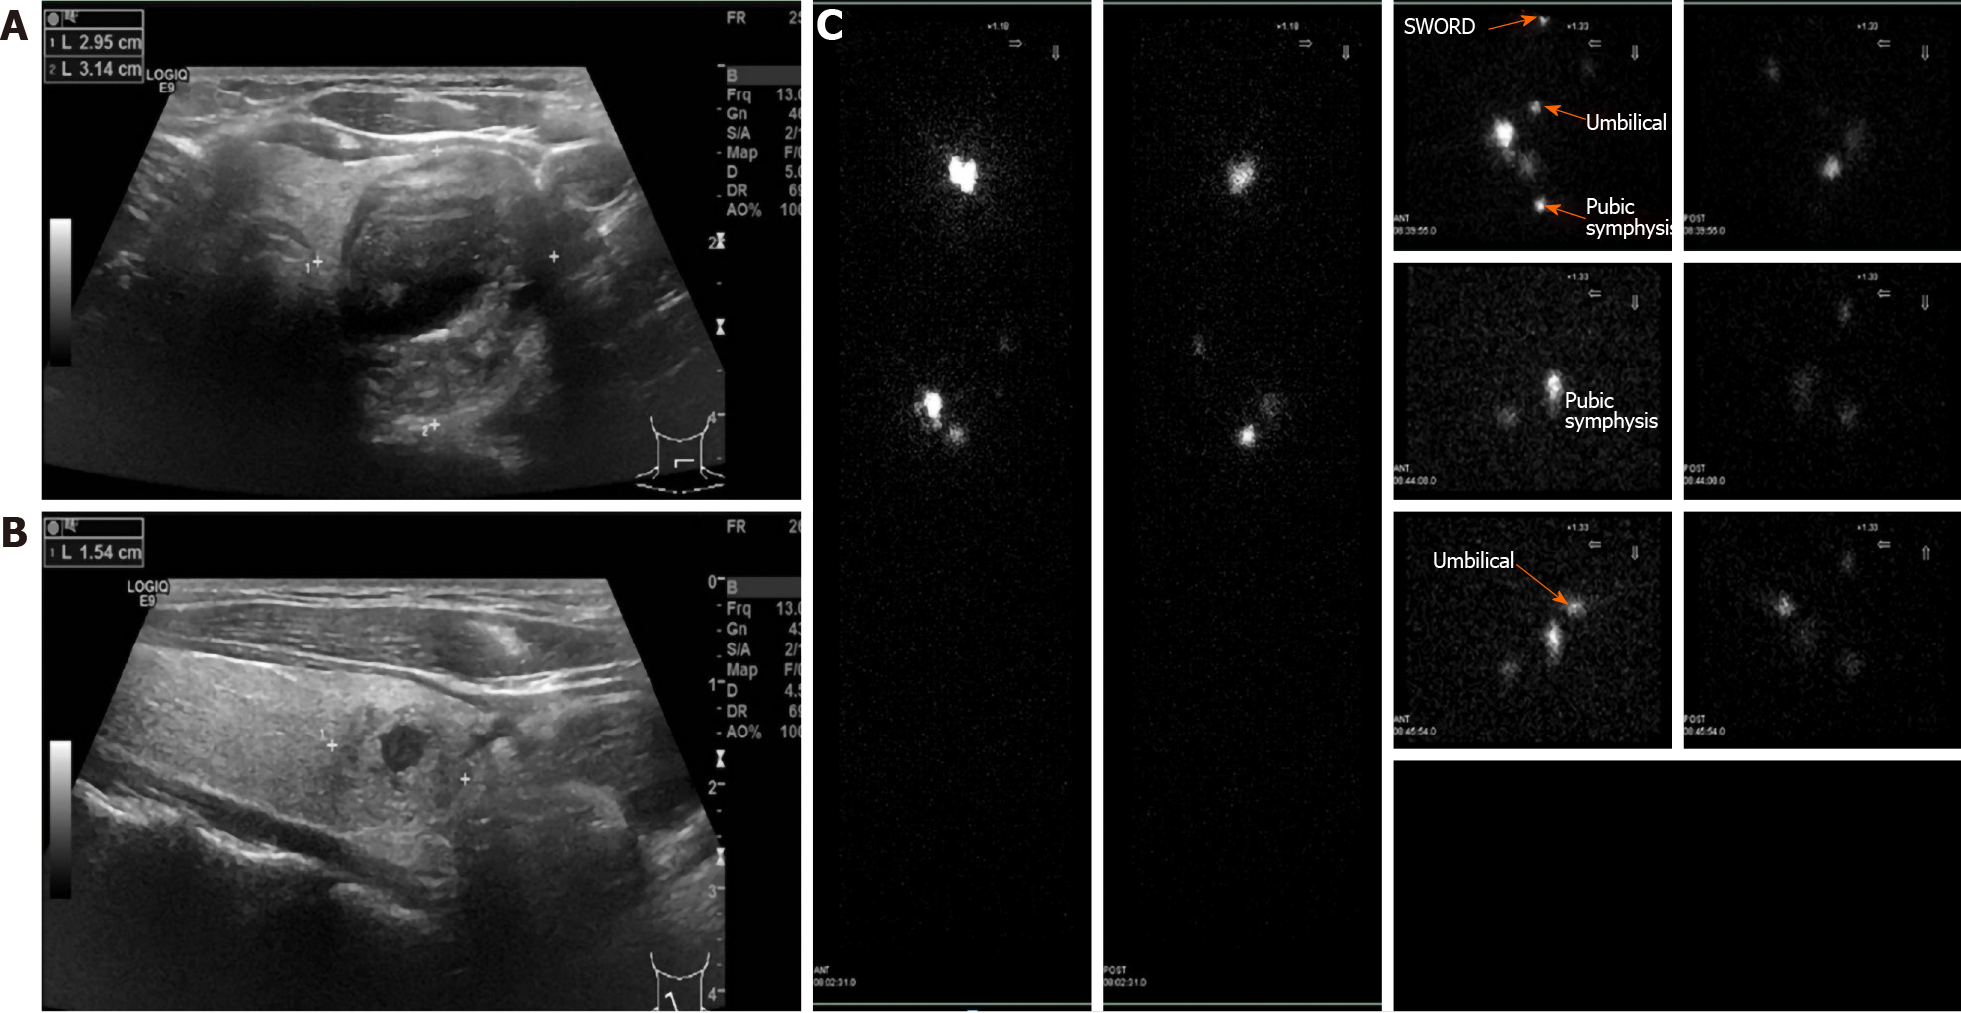
Figure 3 Ultrasound and 99mTc sodium pertechnetate scintigraphy of the thyroid.
A-B: Ultrasound of the thyroid showed nodular goiters in both normal lateral lobes; C: 99mTc sodium pertechnetate scintigraphy showed three abnormal foci in the left renal and lower abdomen.
- Citation: Qin LH, He FY, Liao JY. Multiple ectopic goiter in the retroperitoneum, abdominal wall, liver, and diaphragm: A case report and review of literature. World J Clin Cases 2020; 8(23): 6172-6180
- URL: https://www.wjgnet.com/2307-8960/full/v8/i23/6172.htm
- DOI: https://dx.doi.org/10.12998/wjcc.v8.i23.6172


