Copyright
©The Author(s) 2020.
World J Clin Cases. Dec 6, 2020; 8(23): 6056-6063
Published online Dec 6, 2020. doi: 10.12998/wjcc.v8.i23.6056
Published online Dec 6, 2020. doi: 10.12998/wjcc.v8.i23.6056
Figure 1 Symptoms and maximum body temperatures according to day of fever and day of hospitalization, February 3 to February 19, 2020.
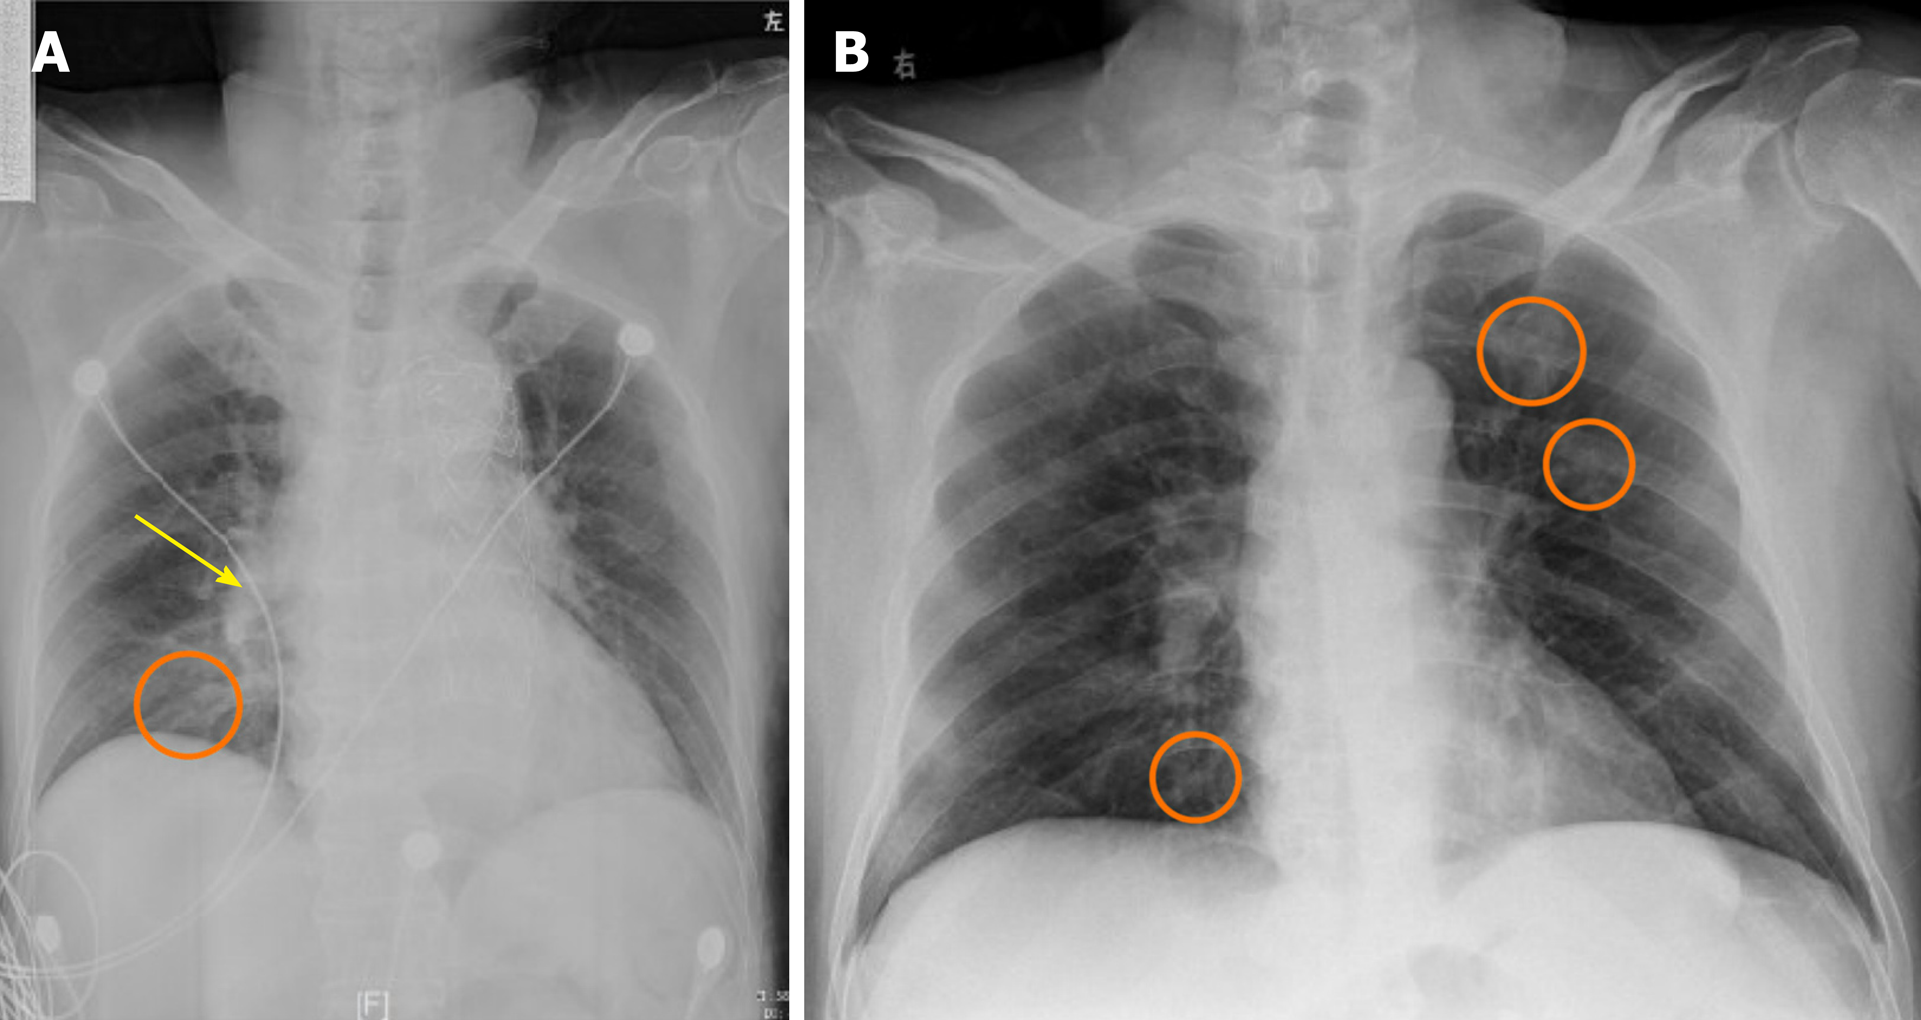
Figure 2 Orthotopic chest radiograph images of bacterial pneumonia with cardiogenic pulmonary edema and coronavirus disease 2019 (a confirmed patient from our institution).
A: Enhanced lung markings with opacification mainly in the inner and middle belts of the right lung (orange circle) and enlarged and thickened hilar shadow (yellow arrow); B: Multiple bilateral areas (orange circles) of patchy shadows with normal lung hilum.
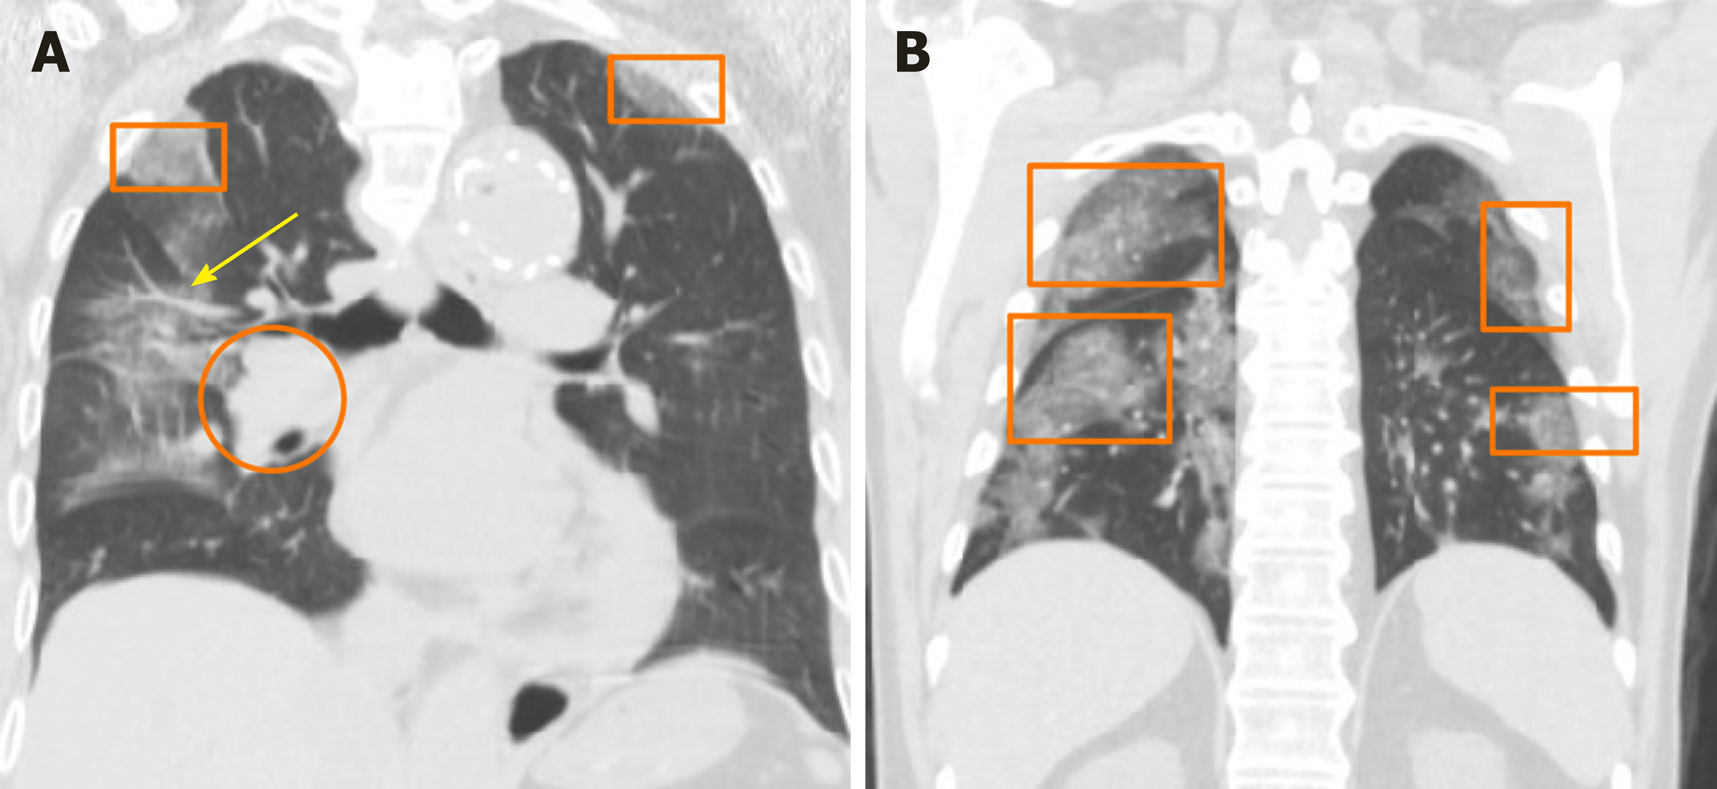
Figure 3 Orthotopic chest radiograph images of bacterial pneumonia with cardiogenic pulmonary edema and coronavirus disease 2019.
A: Enhanced lung markings with bilateral opacification (orange squares), ectatic blood vessel (yellow arrow), and an enlarged and thickened hilar shadow (orange circle); B: Multiple bilateral areas (orange squares) of patchy shadows mainly located in the lateral field with normal lung hilum.
Figure 4 Unenhanced chest computed tomography images of bacterial pneumonia with cardiogenic pulmonary edema on day 3 after the onset of symptoms and day 7 after the onset of fever.
A: Patchy ground-glass opacities in left upper lung (A1), ground-glass nodule in left upper lung (A2); B: Crazy-paving pattern in right upper lung (B1), ground-glass opacities in right lung (B2); C: Crazy-paving pattern and consolidation (orange square), ectatic blood vessel (yellow arrow) in right lung (C1), ground-glass opacities in right lung (C2); D: Ground-glass nodule in right lower lung, fibrous stripes in left lower lung (D1), ground-glass nodule in right lower lung, fibrous stripes in left lower lung (D2).
Figure 5 Unenhanced chest computed tomography images of coronavirus disease 2019 on day 5 after the onset of symptoms and on day 7 after the onset of symptoms.
A: Subpleural ground-glass opacities in right upper lung (A1), subpleural ground-glass opacities in right upper lung (A2); B: Subpleural ground-glass opacities in right middle lobe (B1), segmental ground-glass opacities in right middle lobe (B2); C: Air bronchogram in right middle lobe, subpleural ground-glass nodule with halo sign in right lower lung (C1), air bronchogram right middle lobe, Crazy-paving pattern and consolidation in right lower lobe (C2); D: Subpleural ground-glass nodule and fibrous stripes in left lower lung (D1), consolidation change in left lower lung (D2).
- Citation: Gong JR, Yang JS, He YW, Yu KH, Liu J, Sun RL. Suspected SARS-CoV-2 infection with fever and coronary heart disease: A case report. World J Clin Cases 2020; 8(23): 6056-6063
- URL: https://www.wjgnet.com/2307-8960/full/v8/i23/6056.htm
- DOI: https://dx.doi.org/10.12998/wjcc.v8.i23.6056


