Copyright
©The Author(s) 2020.
World J Clin Cases. Nov 26, 2020; 8(22): 5670-5677
Published online Nov 26, 2020. doi: 10.12998/wjcc.v8.i22.5670
Published online Nov 26, 2020. doi: 10.12998/wjcc.v8.i22.5670
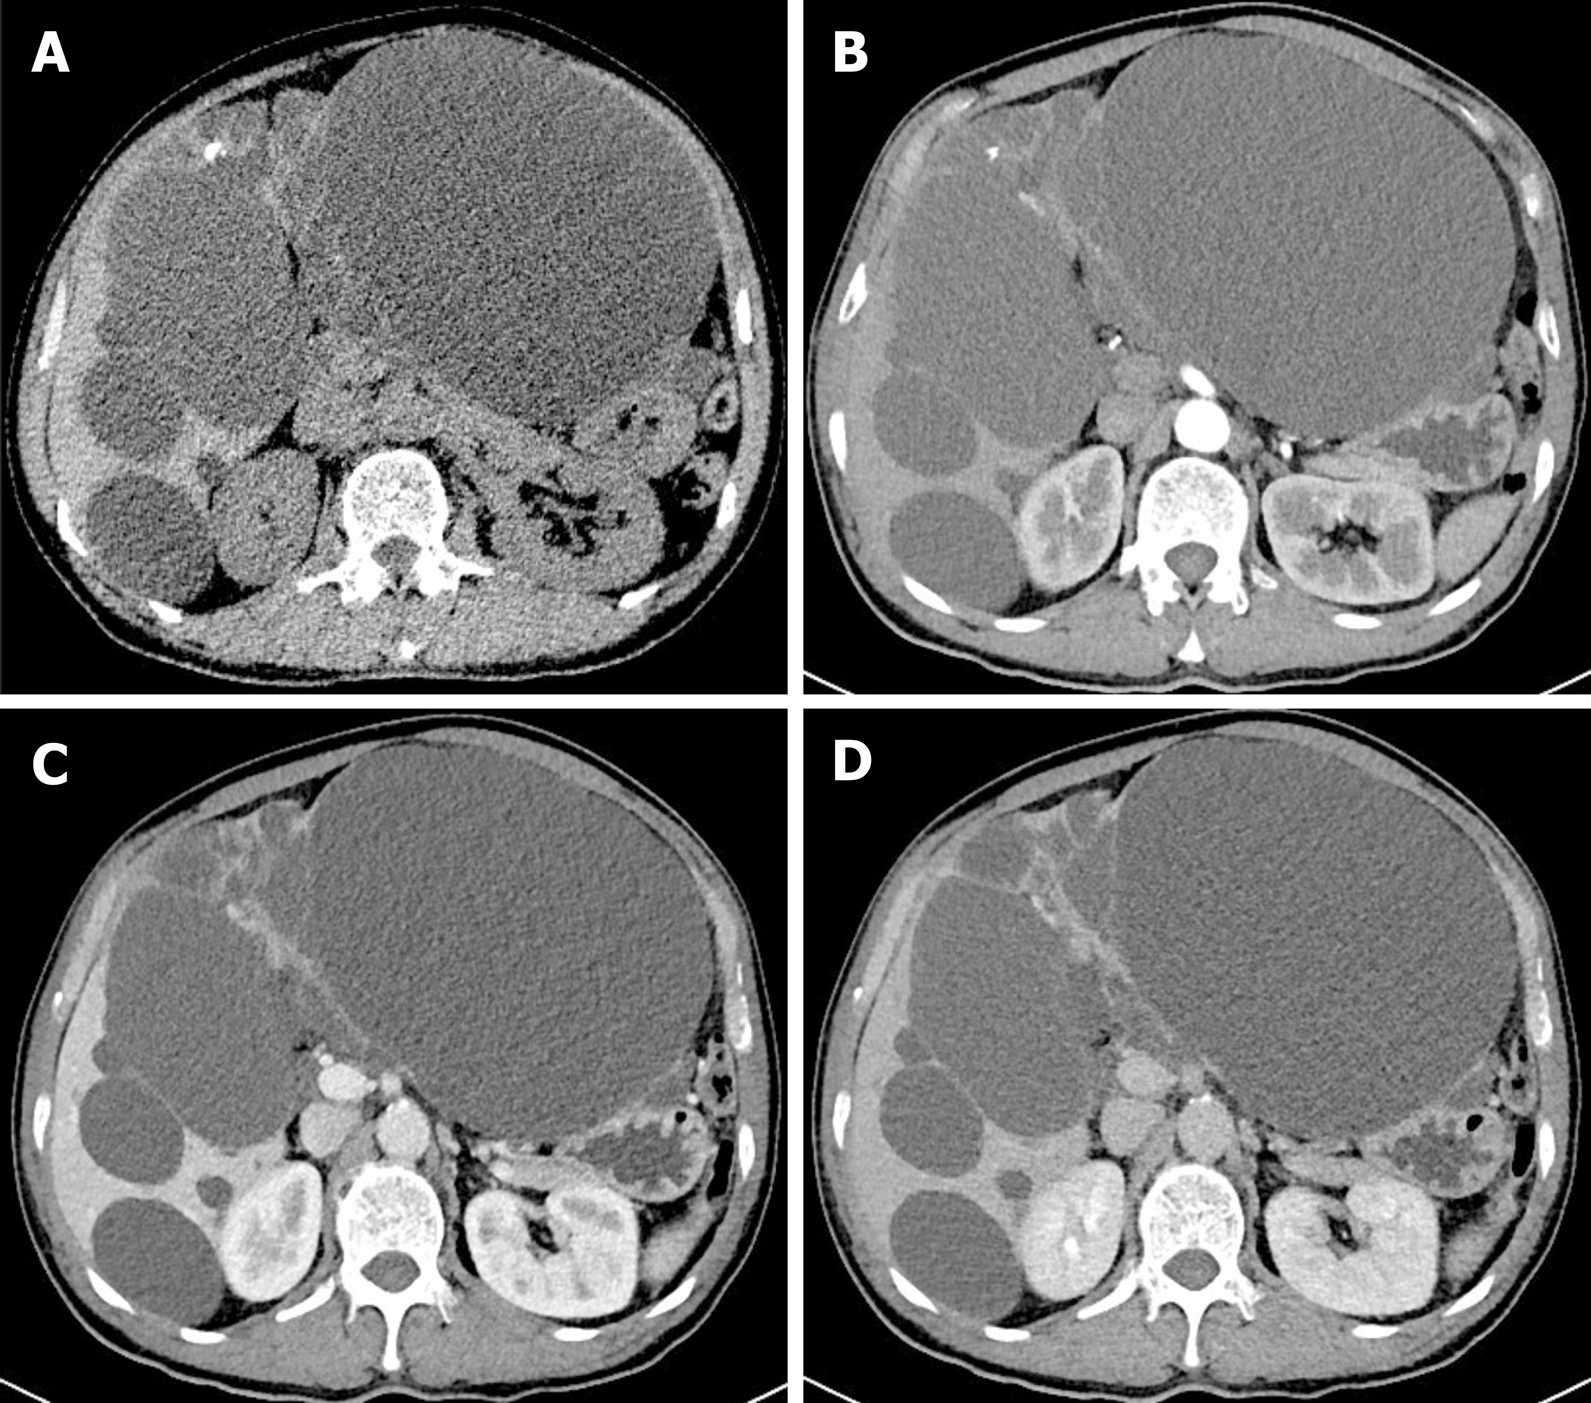
Figure 1 Computed tomography imaging of biliary cystadenoma.
A: Non-contrast computed tomography (CT) showed multiple sizes of hypoattenuating shadows with nodular calcification and internal septations in the liver; B: Arterial phase of CT revealed no obvious enhancement; C: Venous phase of CT revealed slight enhancement; D: Delayed phase of CT showed internal septa and nodular calcification gradually and slight enhancement.
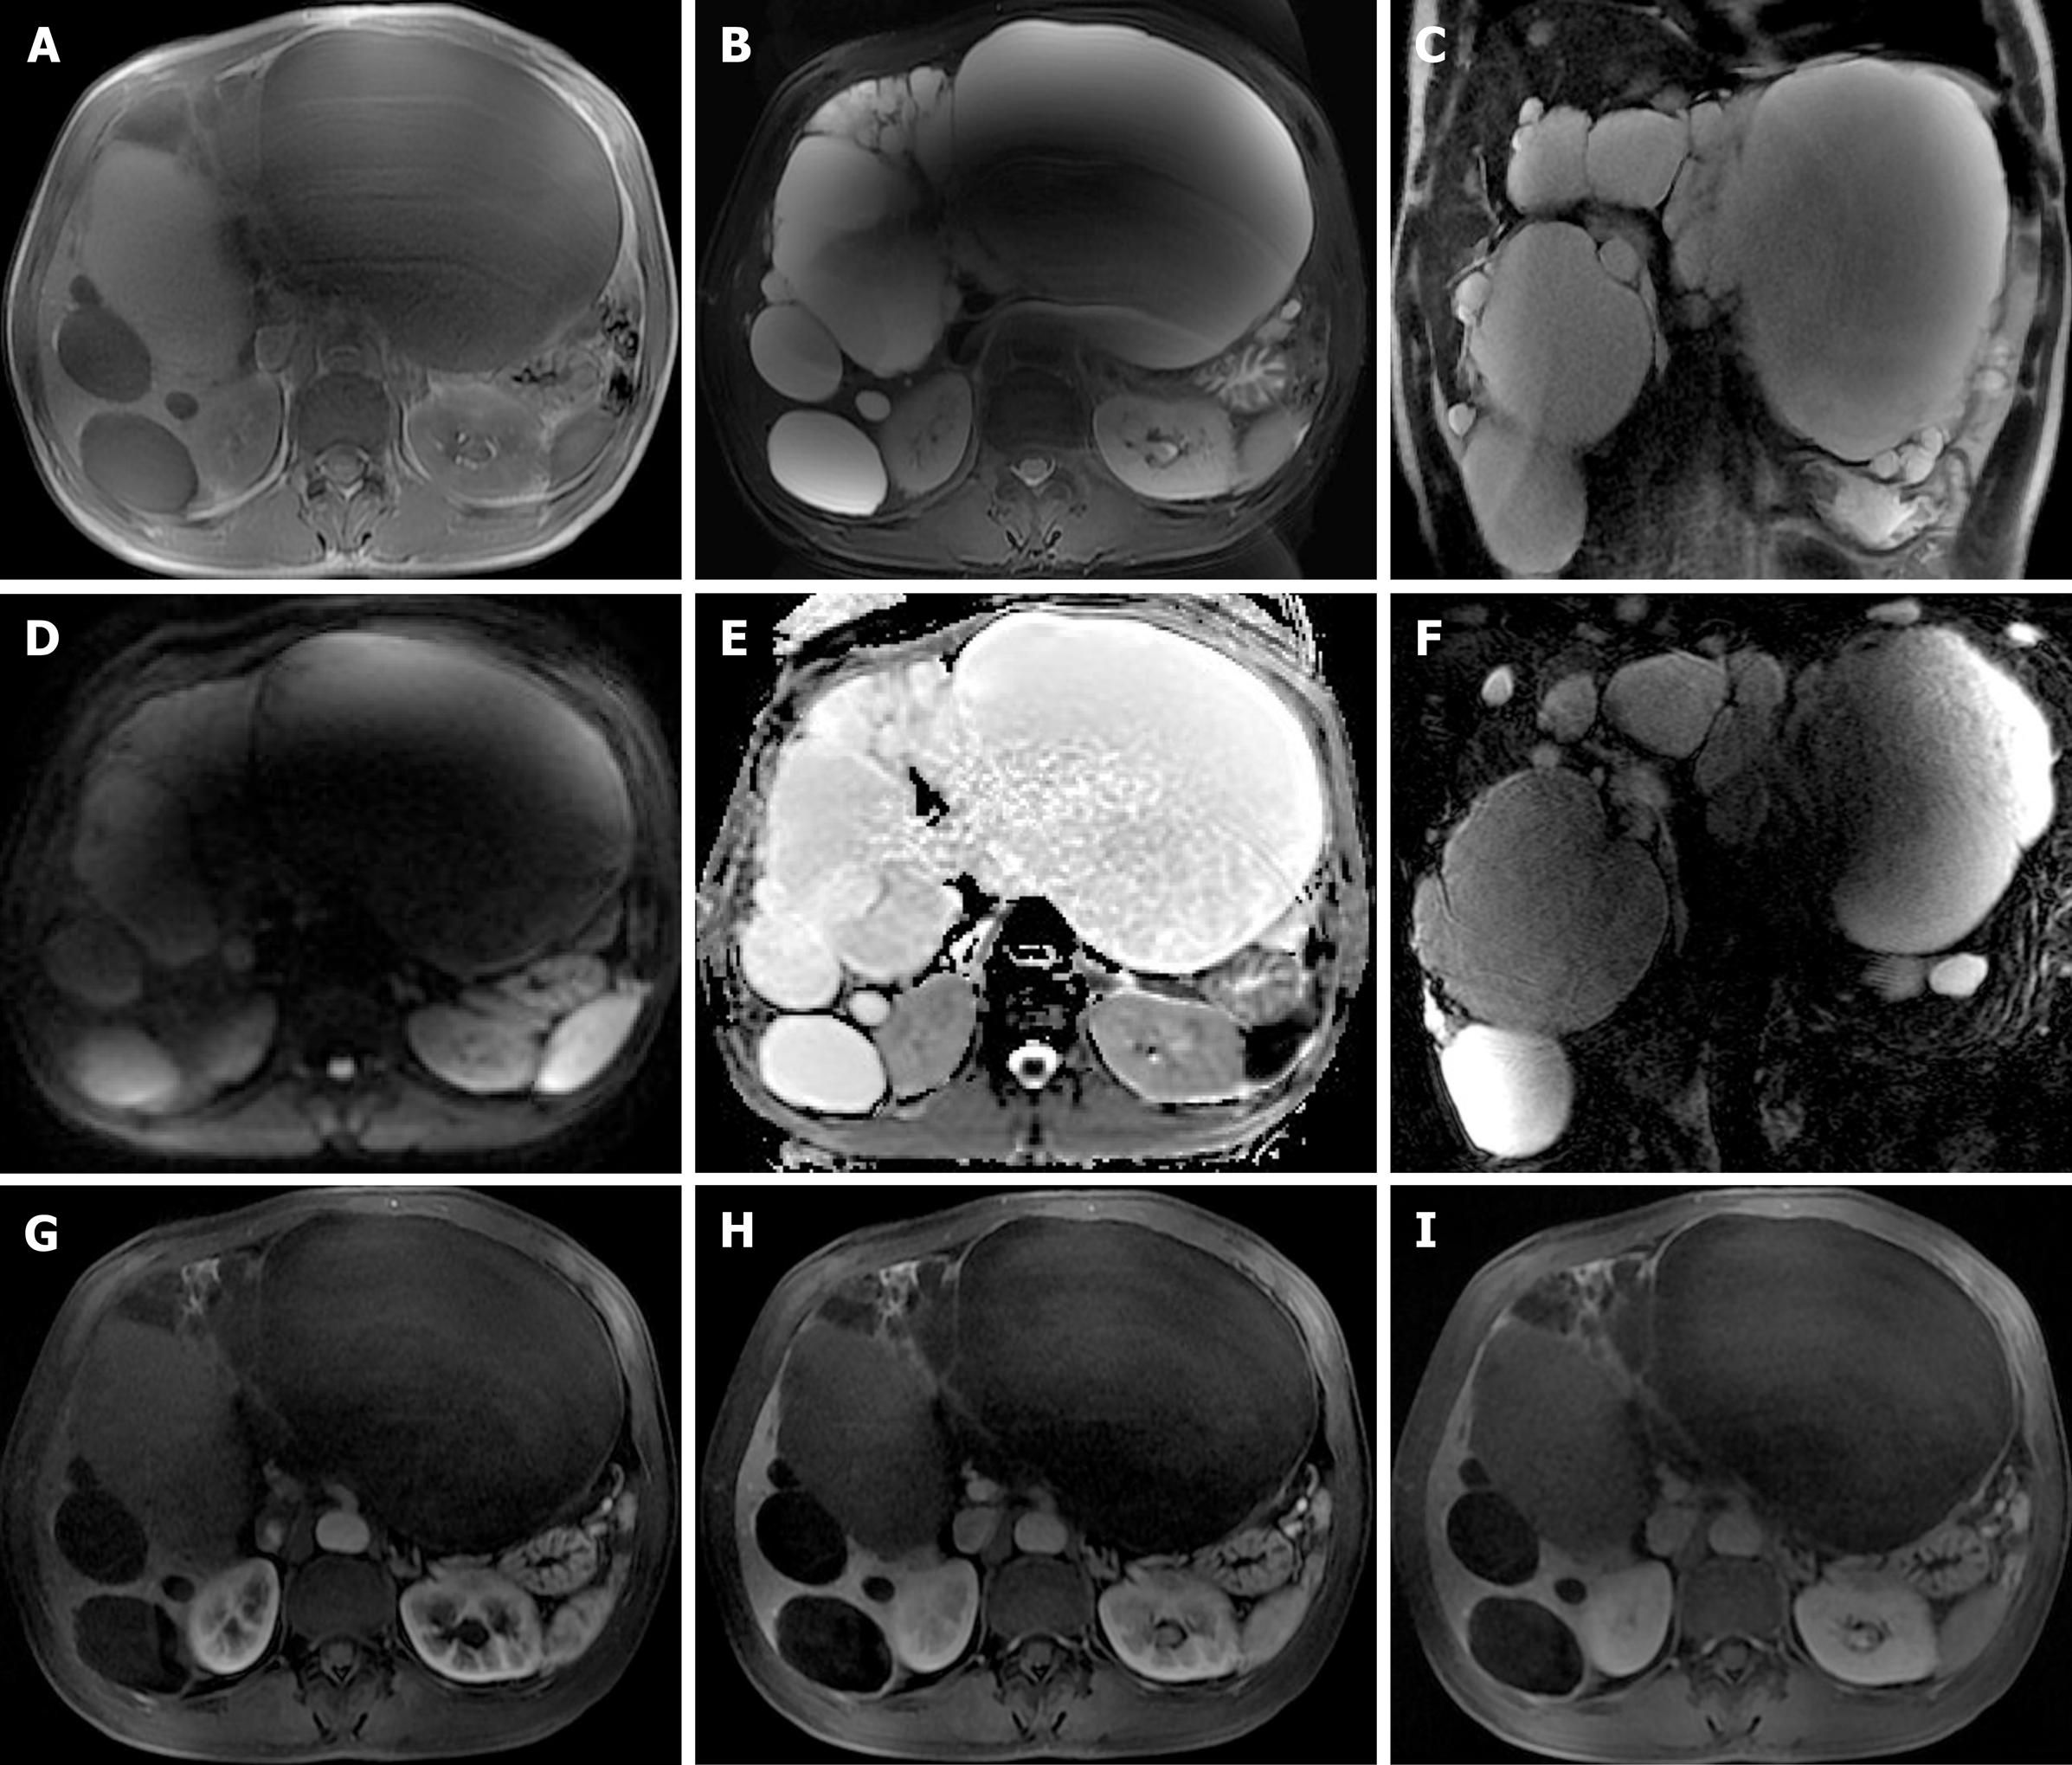
Figure 2 Axial and coronal sections from magnetic resonance imaging of the abdomen.
A: Axial T1 weighted imaging showed cystic fluid with a low signal intensity; B: Axial corresponding T2 weighted imaging revealed cystic fluid with a high signal intensity; C: Coronal T2 weighted imaging showed that internal septation separated the fluid-filled spaces; D: Diffusion weighted imaging showed no abnormal signal; E: Apparent diffusion coefficient map revealed no abnormal signal at the same area; F: Magnetic resonance cholangiopancreatography showed multiple cystic lesions and diffuse dilatation of the biliary tree; G: Arterial phase of magnetic resonance imaging (MRI) revealed no obvious enhancement; H: Venous phase of MRI revealed slight enhancement; I: Delayed phase of MRI showed that the capsule wall contained internal separations with enhancement.
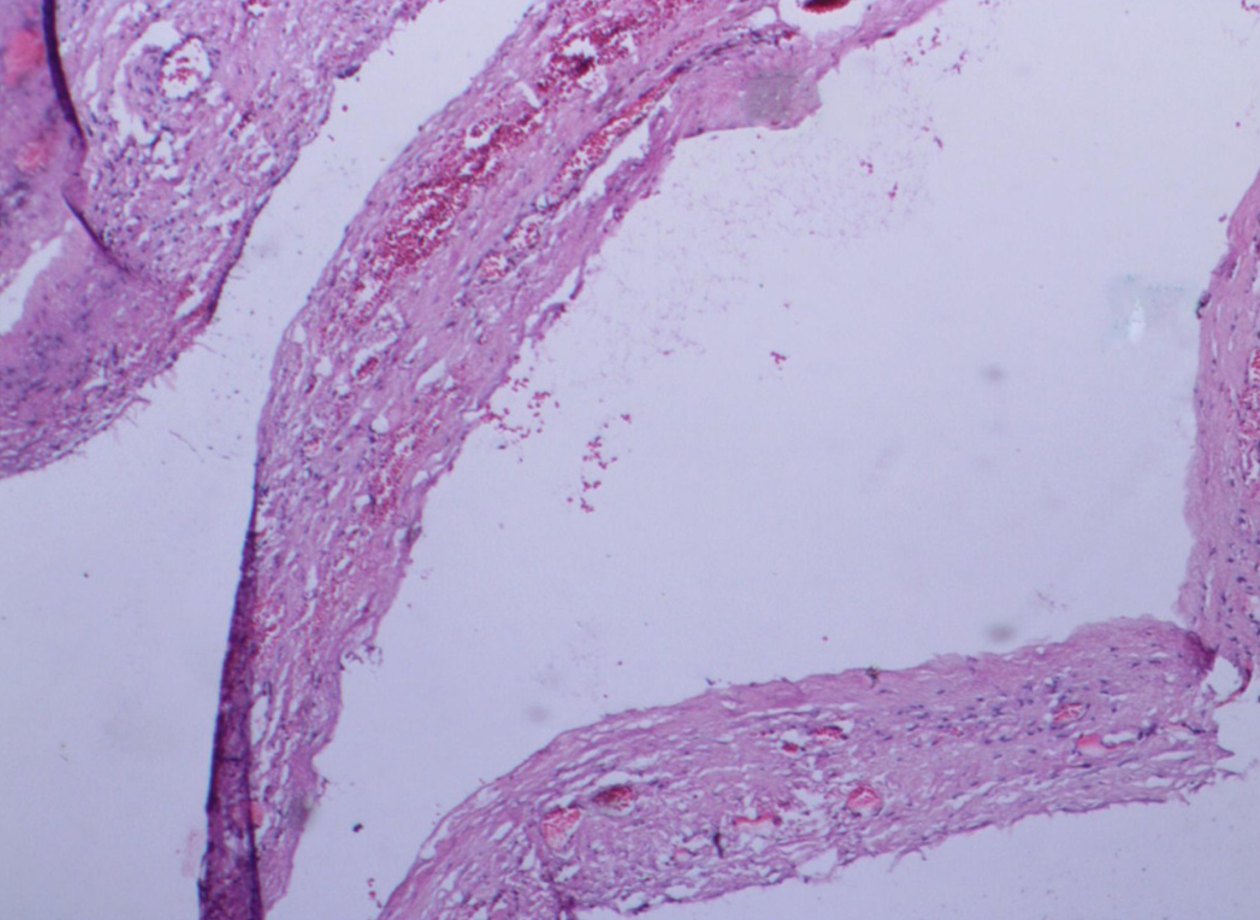
Figure 3 Pathological picture.
The pathological picture showed that the cyst wall was accompanied by a monolayer columnar epithelium with fibrosis, calcification, and inflammatory cell infiltration. Typical ovarian-type stroma was absent.
- Citation: Xu RM, Li XR, Liu LH, Zheng WQ, Zhou H, Wang XC. Intrahepatic biliary cystadenoma: A case report . World J Clin Cases 2020; 8(22): 5670-5677
- URL: https://www.wjgnet.com/2307-8960/full/v8/i22/5670.htm
- DOI: https://dx.doi.org/10.12998/wjcc.v8.i22.5670


