Copyright
©The Author(s) 2020.
World J Clin Cases. Nov 26, 2020; 8(22): 5625-5631
Published online Nov 26, 2020. doi: 10.12998/wjcc.v8.i22.5625
Published online Nov 26, 2020. doi: 10.12998/wjcc.v8.i22.5625
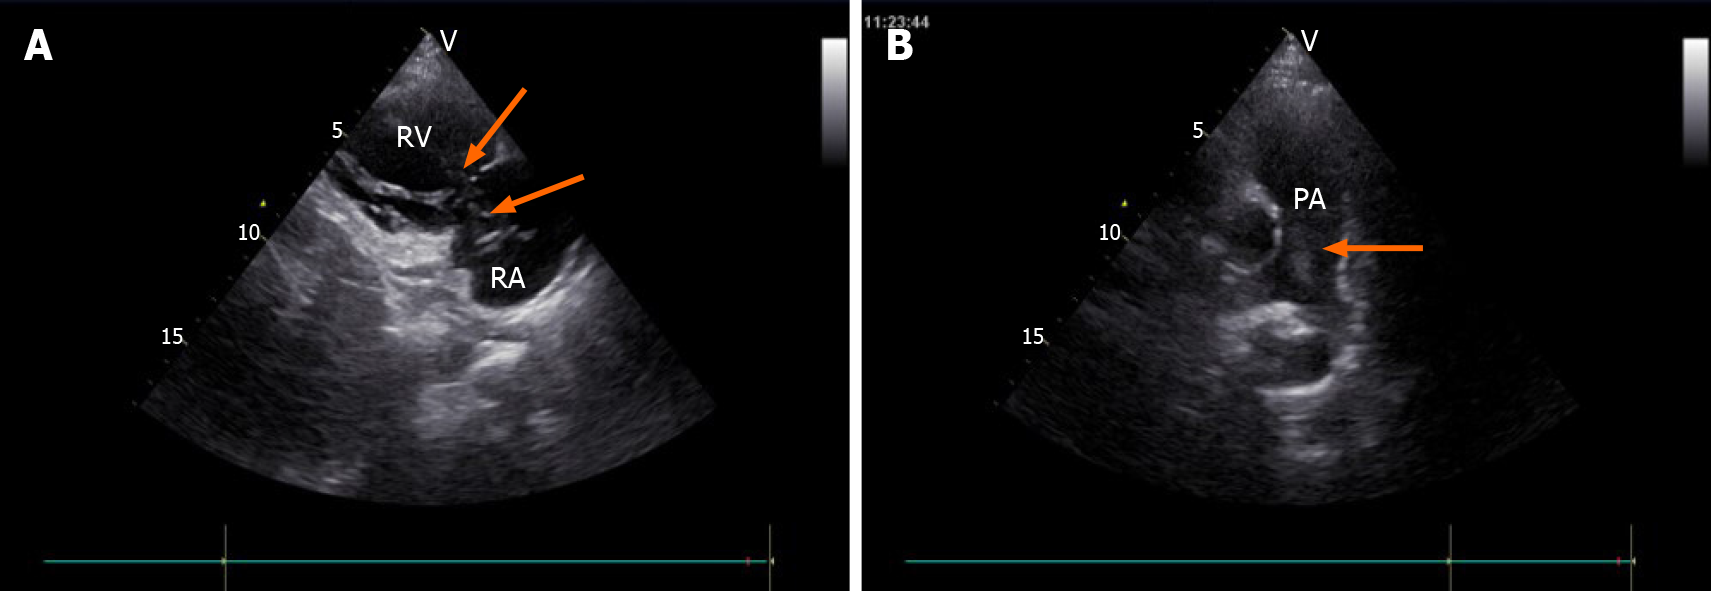
Figure 1 Transthoracic echocardiography images.
A: Tumor (arrow) in the right atrium and the right ventricle, seen on the parasternal right ventricular inflow tract section; B: Tumor (arrow) in the pulmonary artery, seen on the long axis section of the pulmonary artery. RA: Right atrium; RV: Right ventricle; PA: Pulmonary artery.
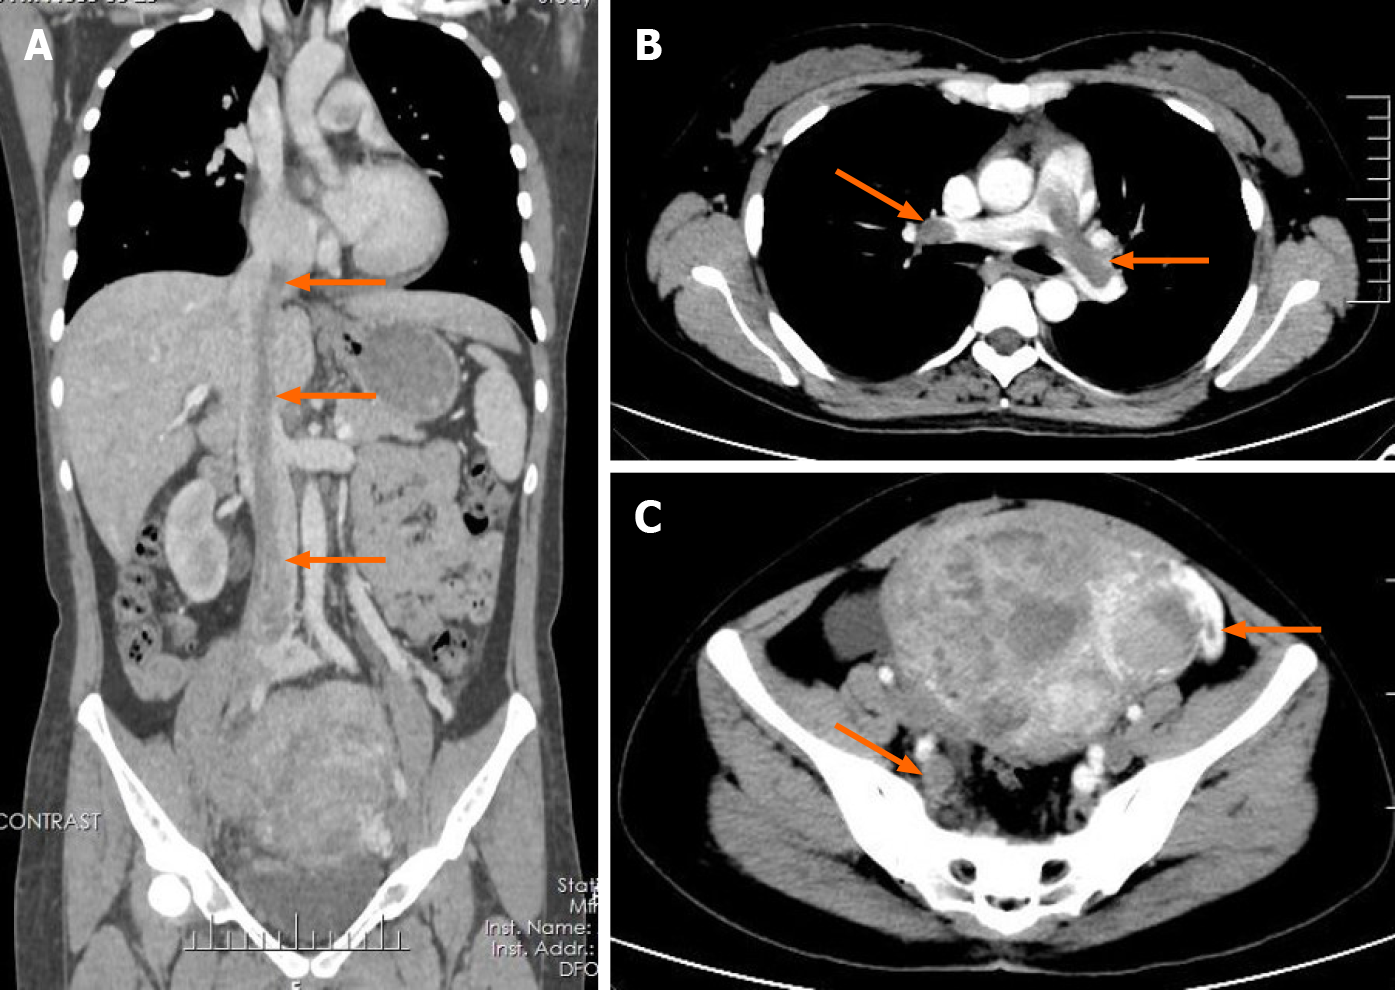
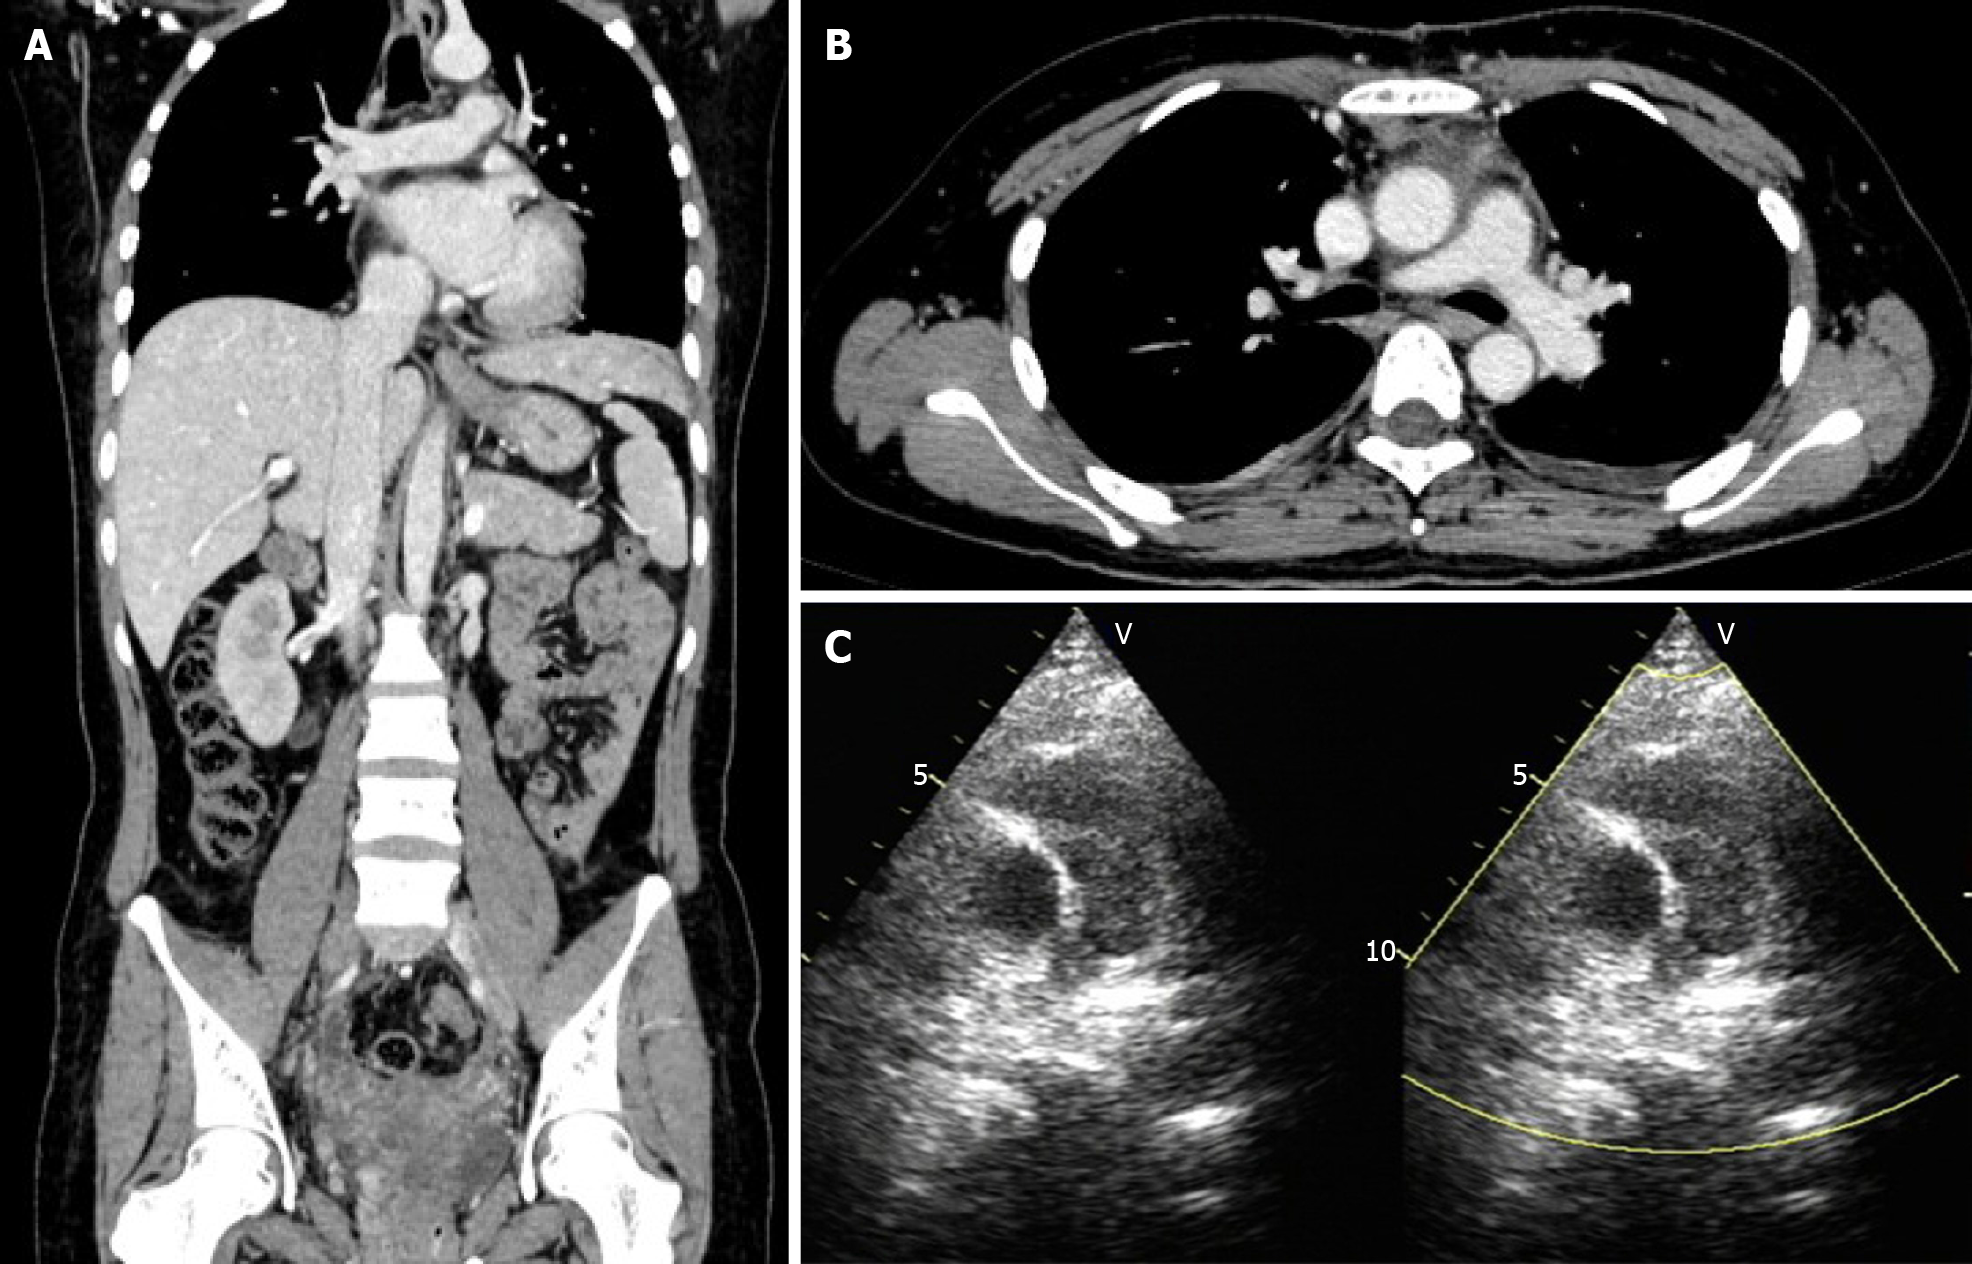
Figure 2 Enhanced computed tomography images.
A: Coronal enhanced computed tomography (CT) shows a tumor thrombus (arrow) extending from the pelvis to the inferior vena cava and an enlarged uterus; B: Axial enhanced chest CT shows the tumor thrombus (arrow) protruding into the bilateral pulmonary artery branches; C: Axial enhanced pelvic CT shows multiple masses in the uterus and tumor thrombus in the right iliac vein and left ovarian vein (arrow).
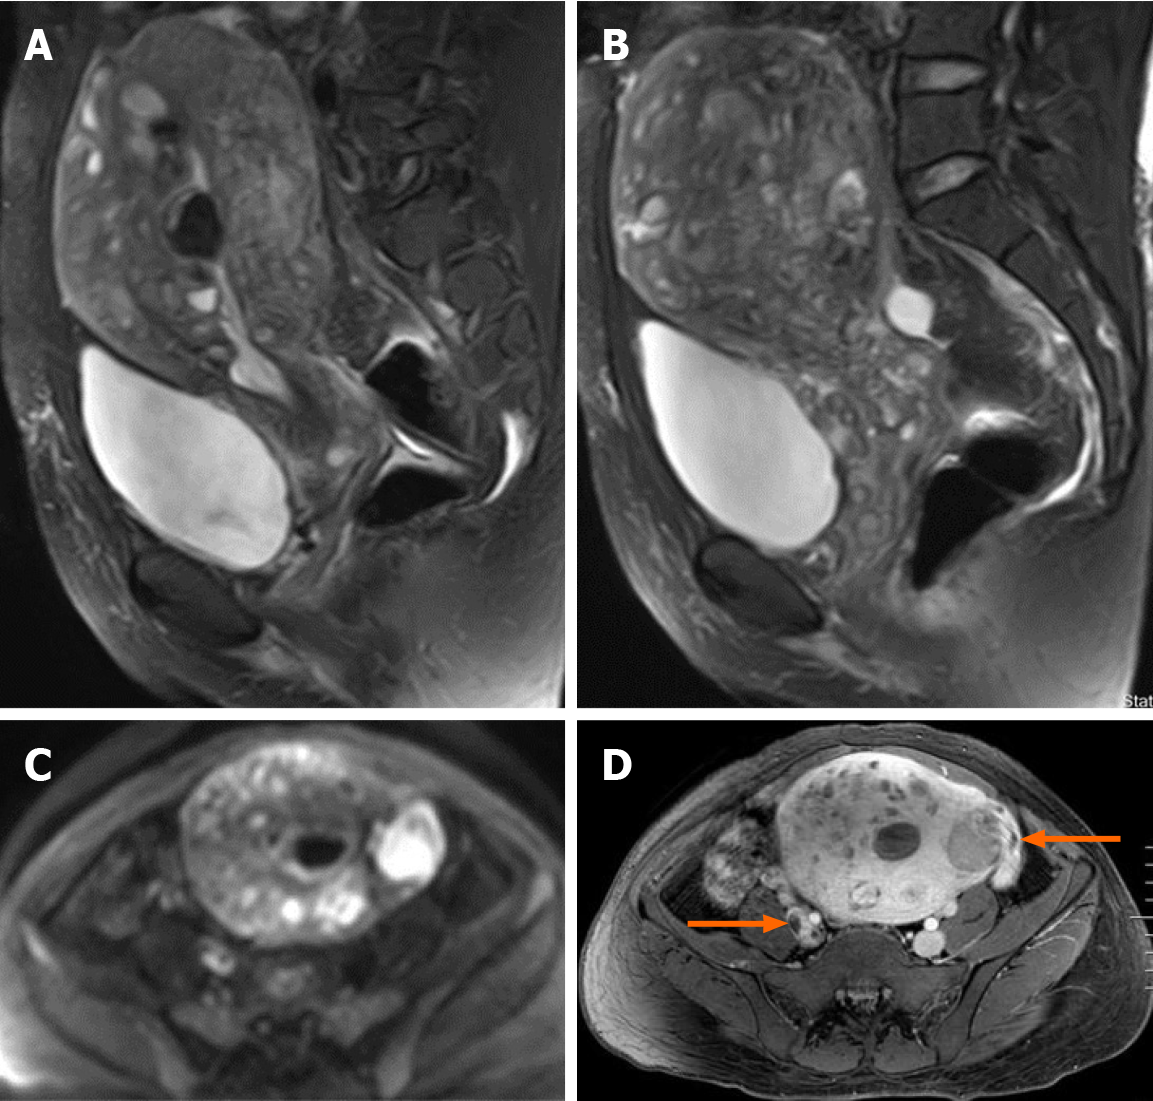
Figure 3 Pelvic magnetic resonance imaging findings.
A and B: Sagittal T2-weighted images shows extensive myometrial thickening with heterogeneously hyperintense signals, and diffuse infiltration of the cervix and vaginal vault; C: Axial diffusion-weighted image shows high lesion signals; D: Axial T1-weighted image after contrast administration shows that contrast enhancement of the lesions was heterogeneous and tumor thrombus in the right iliac vein and the left ovarian vein (arrow).
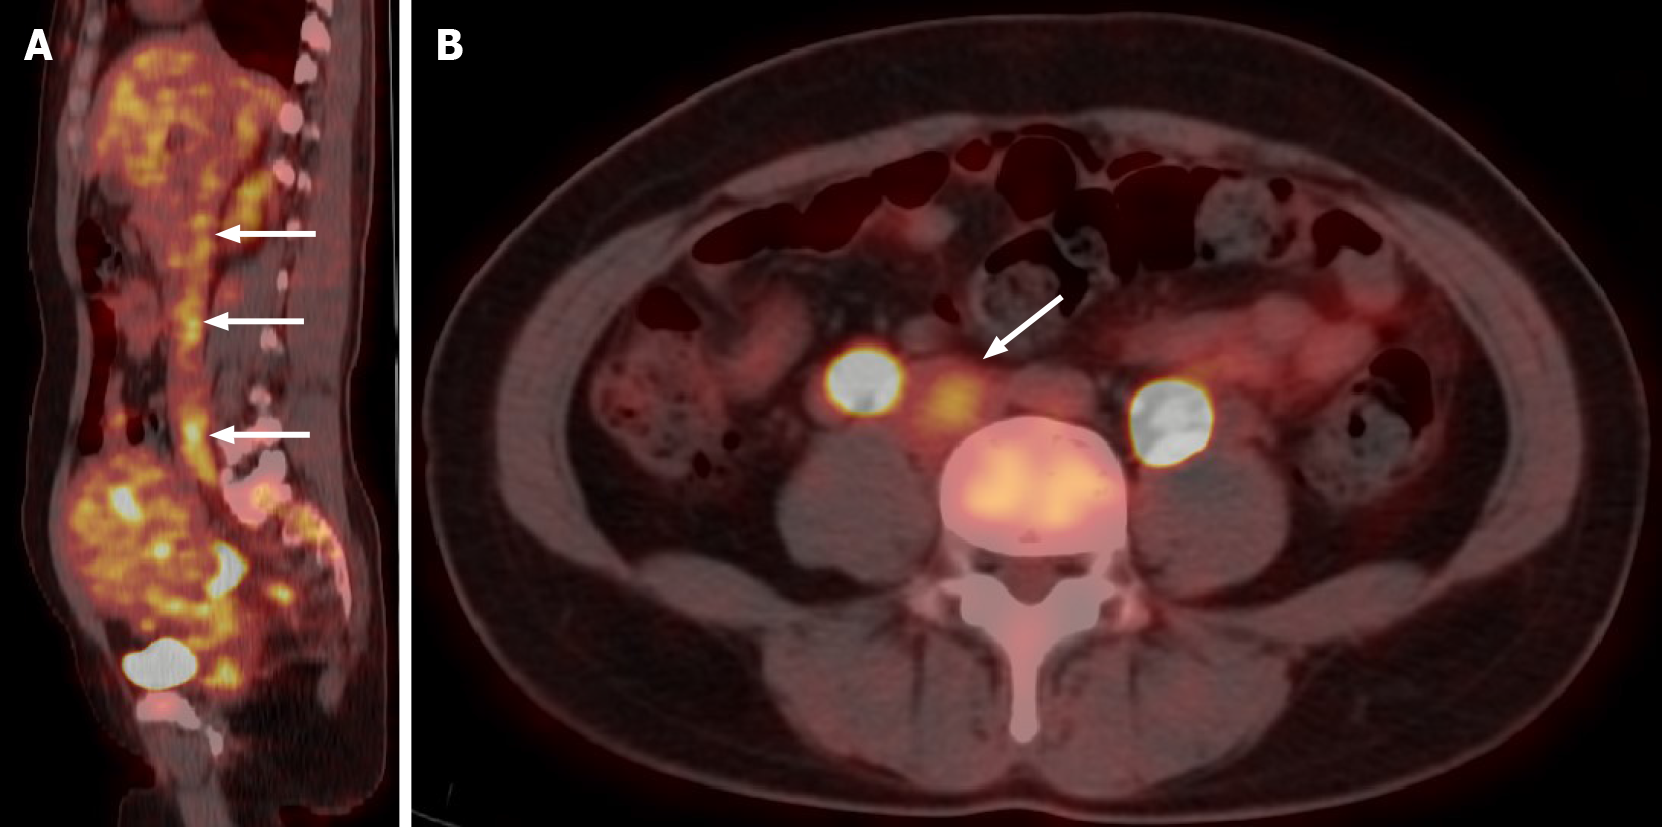
Figure 4 18F-FDG positron emission tomography/computed tomography images.
Sagittal and axial 18F-FDG positron emission tomography/computed tomography shows slightly high 18F- FDG uptake of the tumor in the inferior vena cava (arrow).
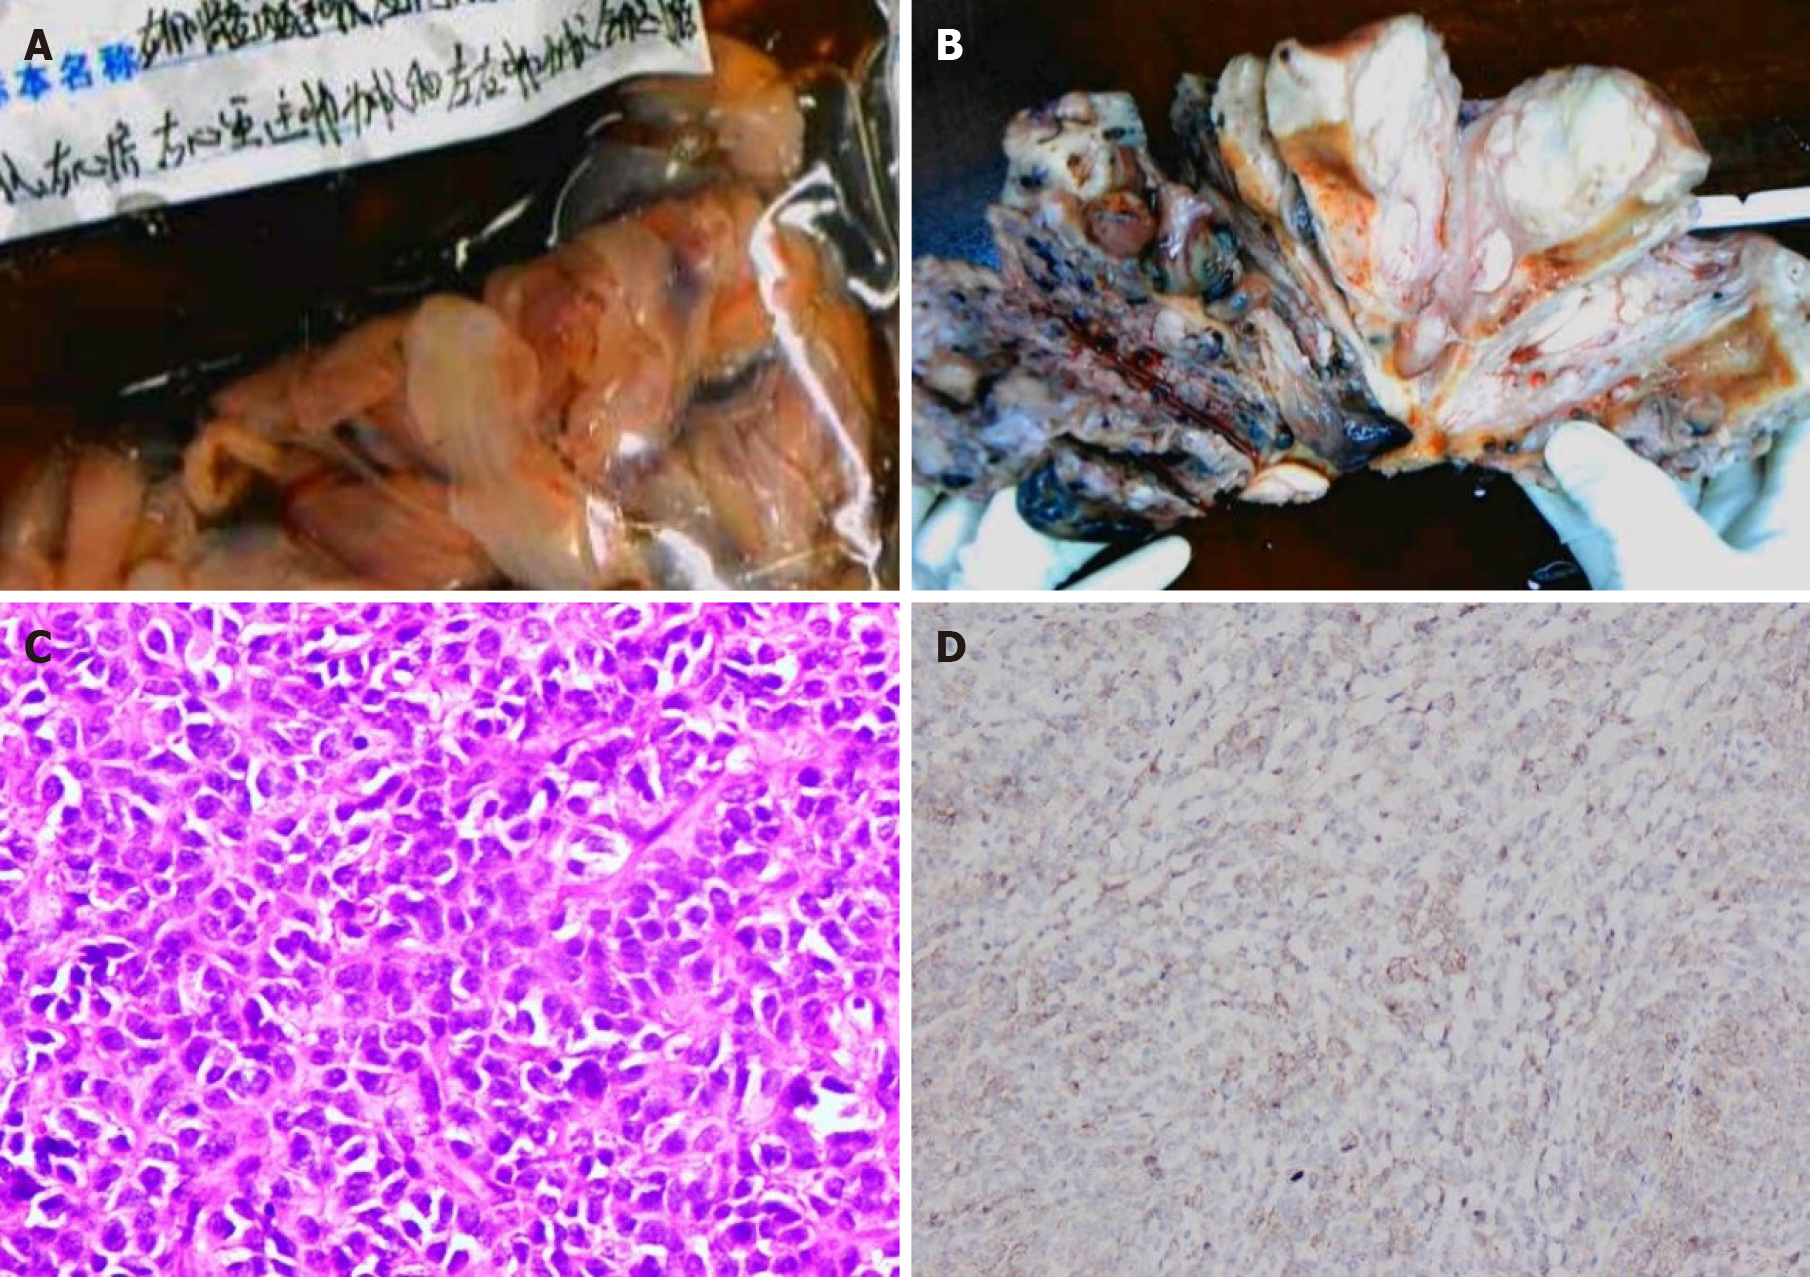
Figure 5 Pathological images.
A: Endovascular and intracardiac tumors; B: Cut section of the uterine tumor shows that the tumor diffusely infiltrated the whole layer of the uterine wall; C: Microscopically, the tumor cells were closely arranged and cytologically atypical (hematoxylin eosin staining, × 400); D: The tumor shows positive CD10 immunoreactivity.
Figure 6 Postoperative transthoracic echocardiography and follow-up enhanced computed tomography images.
A and B: Follow-up enhanced computed tomography showed complete removal of the lesion in the inferior vena cava and pulmonary artery; C: Postoperative transthoracic echocardiography revealed improved pulmonary hypertension.
- Citation: Fan JK, Tang GC, Yang H. Endometrial stromal sarcoma extending to the pulmonary artery: A rare case report. World J Clin Cases 2020; 8(22): 5625-5631
- URL: https://www.wjgnet.com/2307-8960/full/v8/i22/5625.htm
- DOI: https://dx.doi.org/10.12998/wjcc.v8.i22.5625


