Copyright
©The Author(s) 2020.
World J Clin Cases. Nov 26, 2020; 8(22): 5576-5588
Published online Nov 26, 2020. doi: 10.12998/wjcc.v8.i22.5576
Published online Nov 26, 2020. doi: 10.12998/wjcc.v8.i22.5576
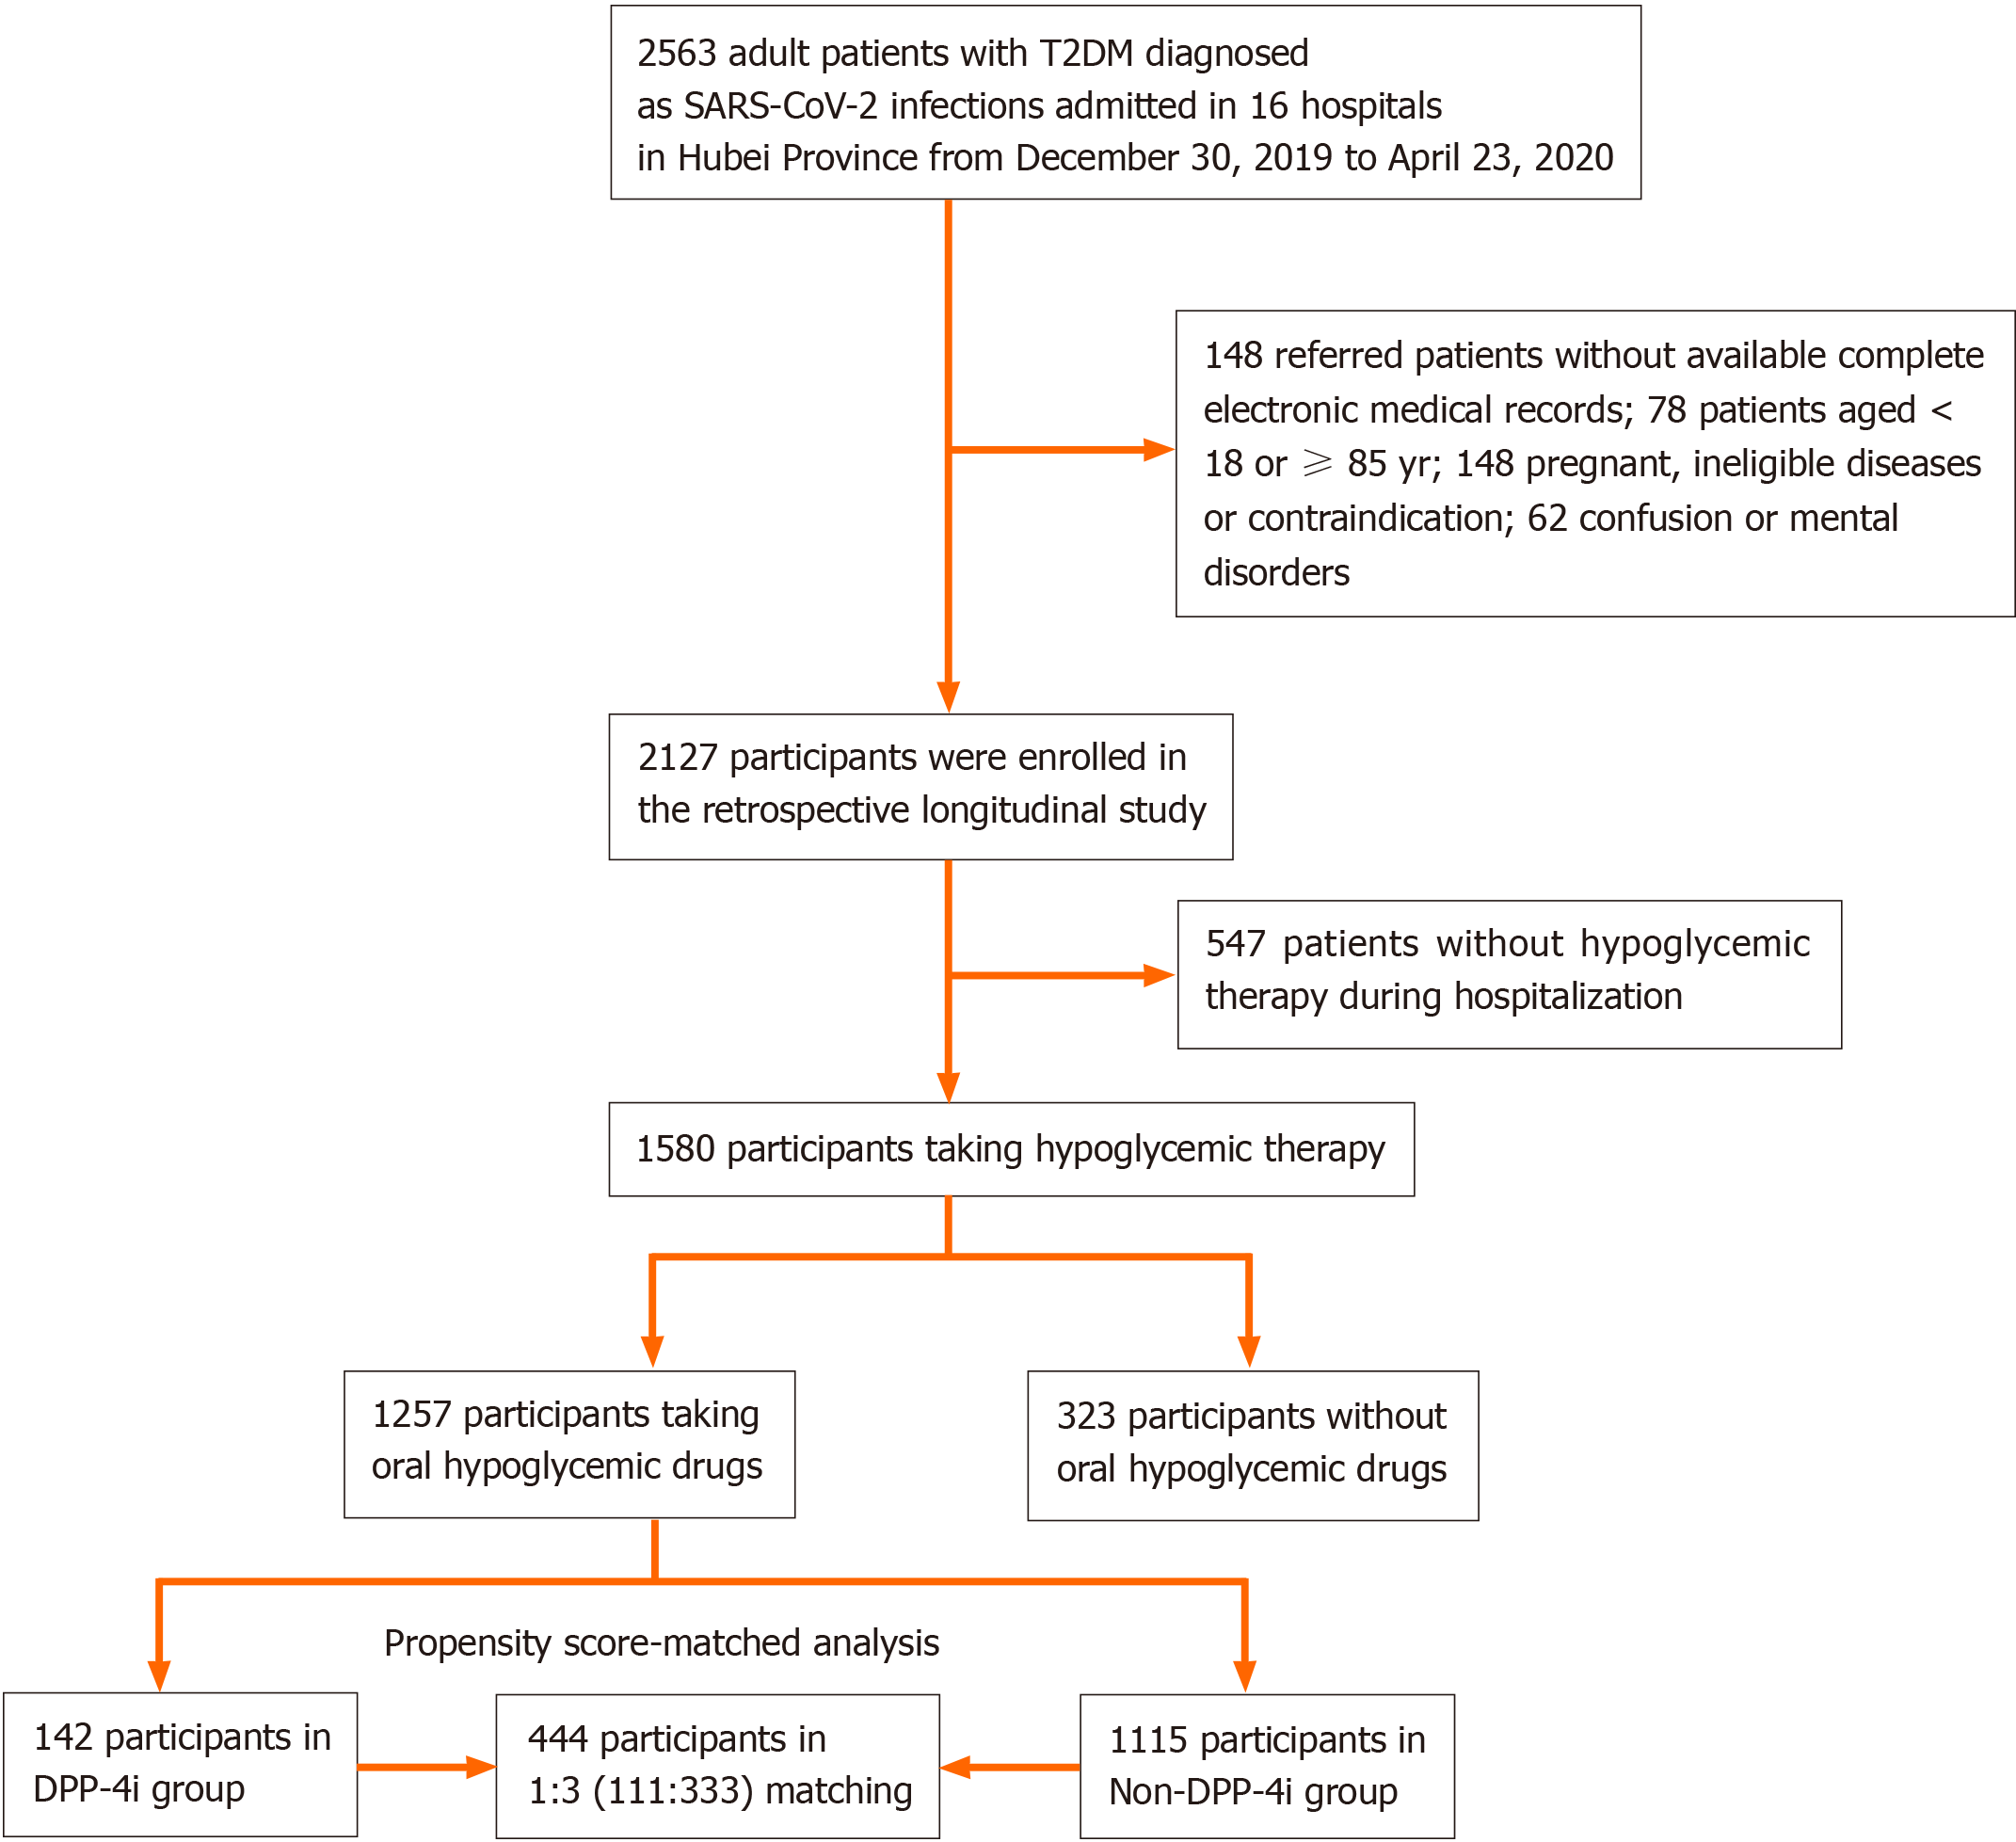
Figure 1 Flow chart of study inclusion.
T2D: Type 2 diabetes; DPP4i: Dipeptidyl peptidase-4 inhibitors.
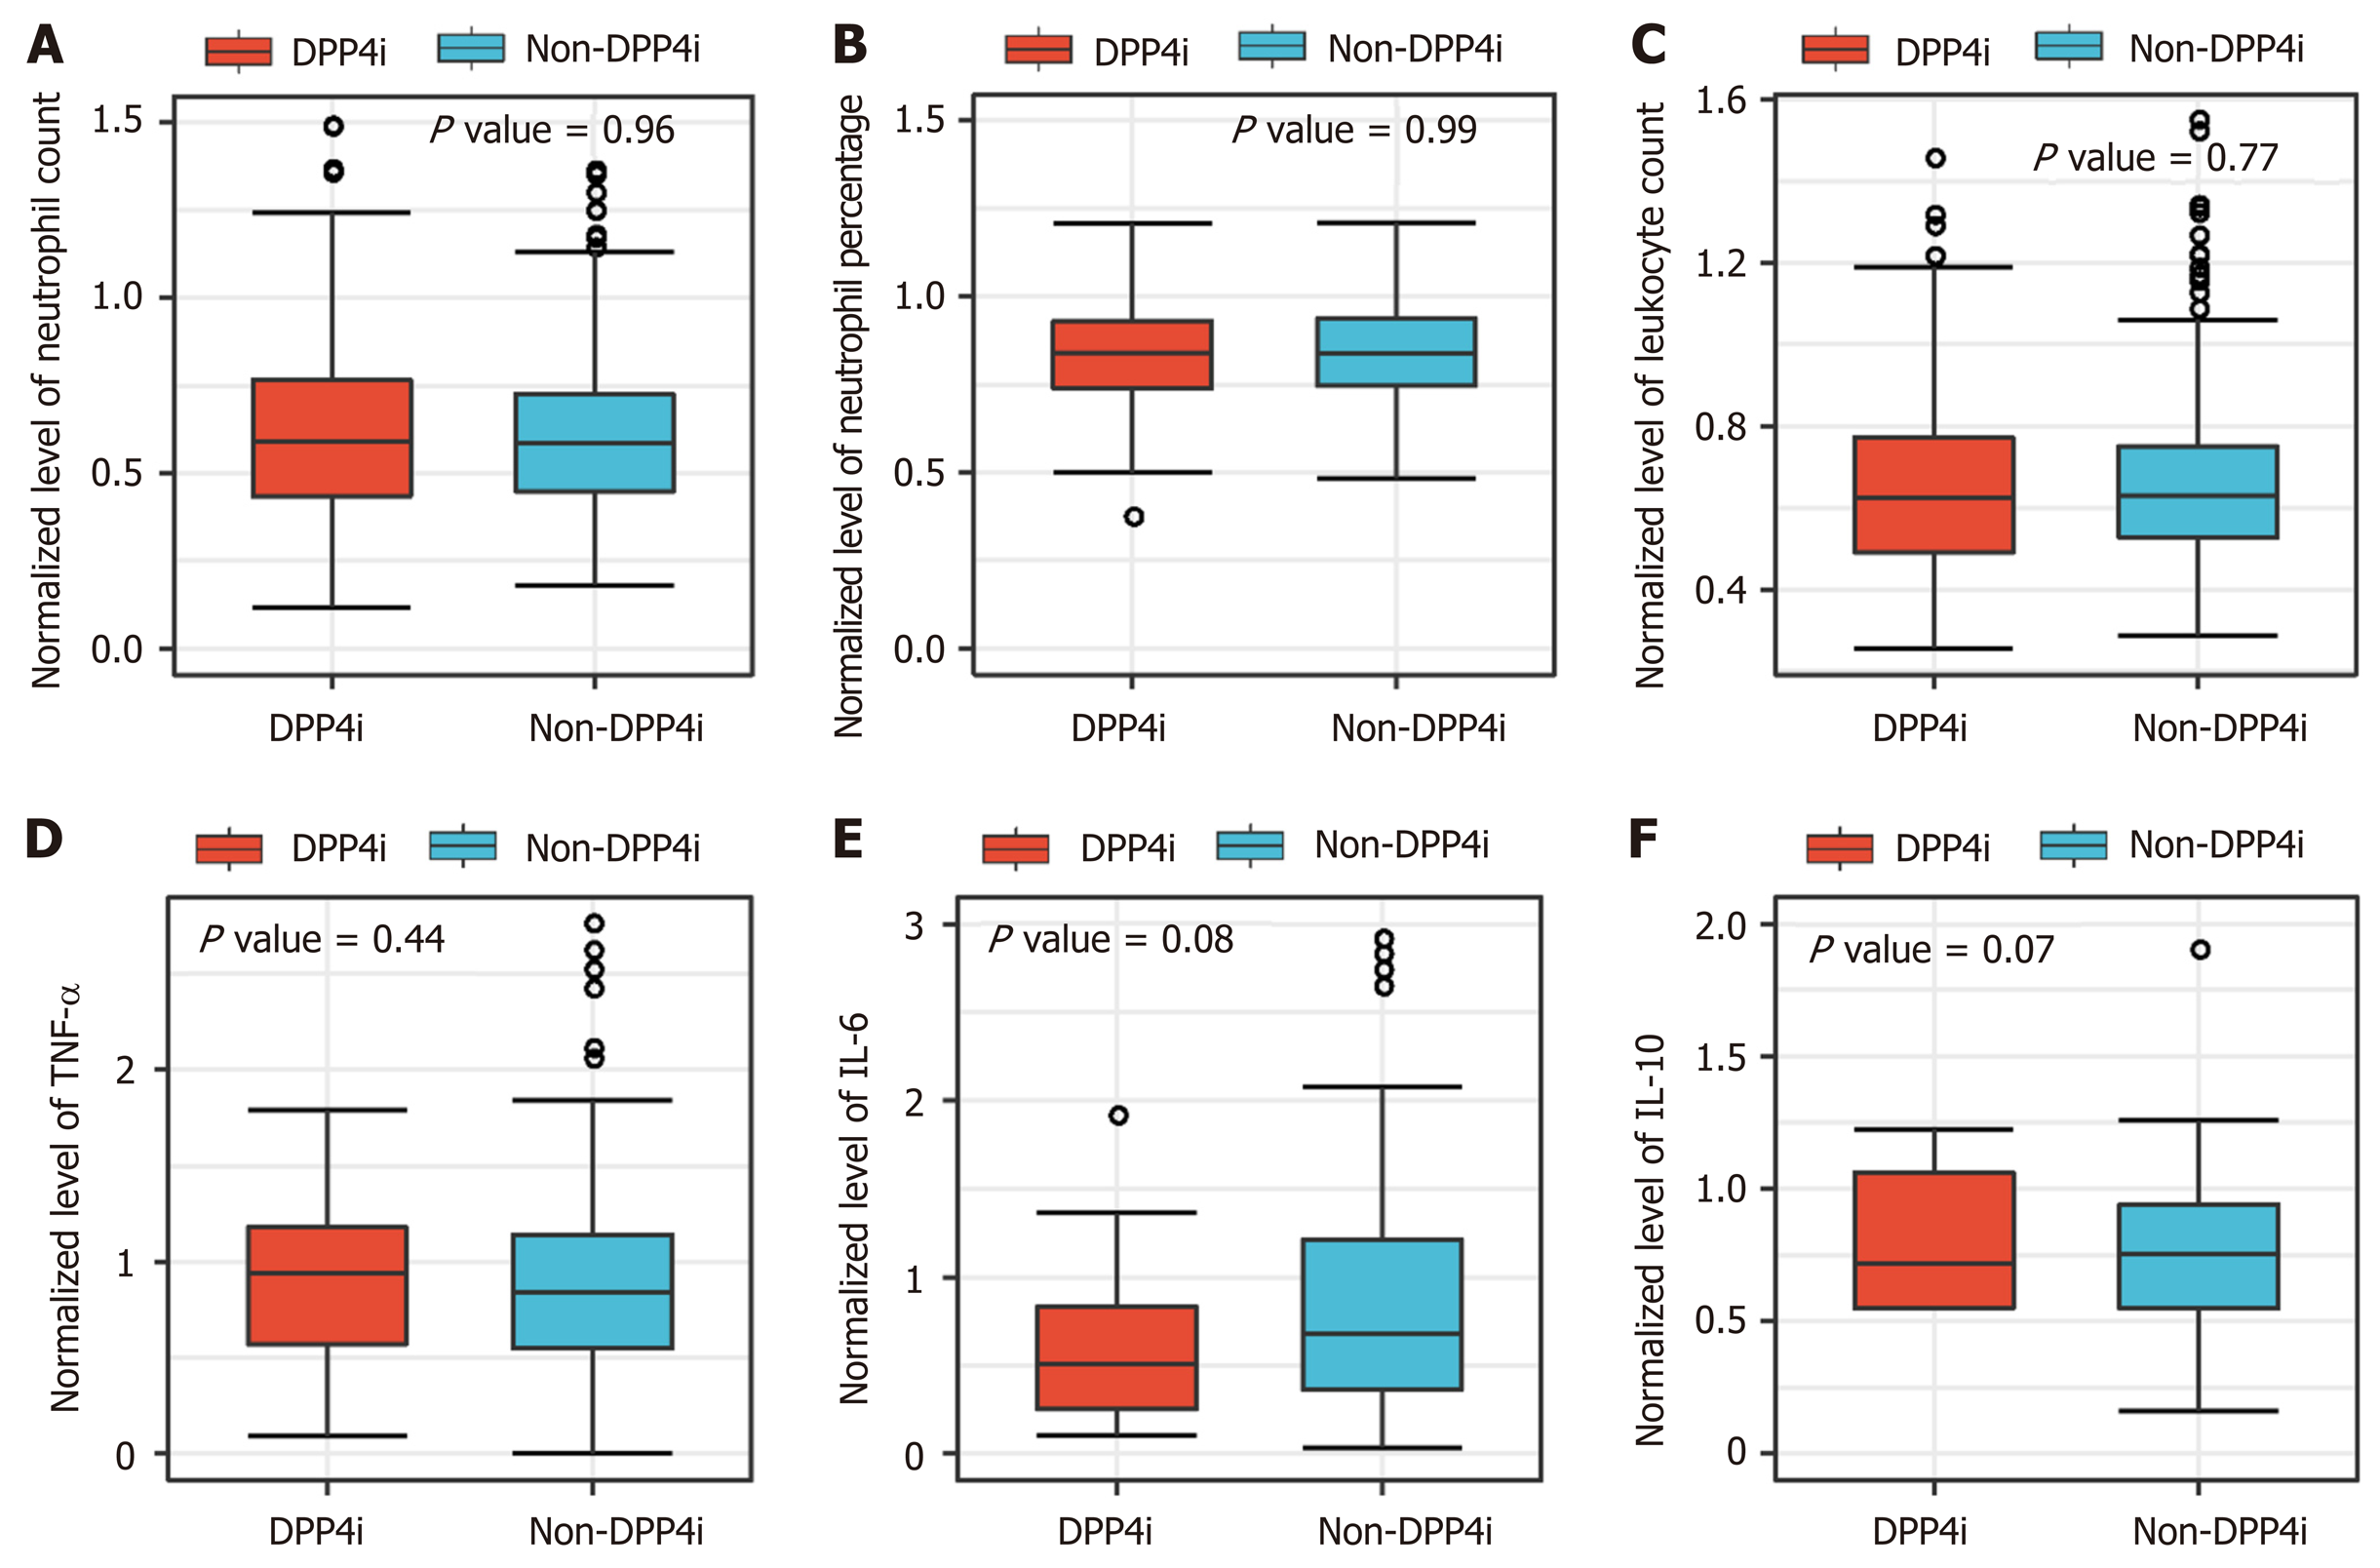
Figure 2 Box plots showing the median levels of inflammatory response indicators in dipeptidyl peptidase-4 inhibitor and non-dipeptidyl peptidase-4 inhibitor groups (n = 444).
A-F: Box chart analysis of median levels of neutrophil count, neutrophil percentage, leukocyte count, tumor necrosis factor-α, interleukin (IL)-6, and IL-10 between the dipeptidyl peptidase-4 inhibitor (DPP4i) and non-DPP4i groups. The median levels of those parameters of each participant during the follow-up duration were applied and were normalized according to their upper limits of normal range of each hospital. DPP4i: Dipeptidyl peptidase-4 inhibitors; TNF-α: Tumor necrosis factor-α; IL-6: Interleukin-6; IL-10: Interleukin-10.
- Citation: Zhou JH, Wu B, Wang WX, Lei F, Cheng X, Qin JJ, Cai JJ, Zhang X, Zhou F, Liu YM, Li HM, Zhu LH, She Z, Zhang X, Yang J, Li HL. No significant association between dipeptidyl peptidase-4 inhibitors and adverse outcomes of COVID-19. World J Clin Cases 2020; 8(22): 5576-5588
- URL: https://www.wjgnet.com/2307-8960/full/v8/i22/5576.htm
- DOI: https://dx.doi.org/10.12998/wjcc.v8.i22.5576


