Copyright
©The Author(s) 2020.
World J Clin Cases. Oct 26, 2020; 8(20): 4773-4784
Published online Oct 26, 2020. doi: 10.12998/wjcc.v8.i20.4773
Published online Oct 26, 2020. doi: 10.12998/wjcc.v8.i20.4773
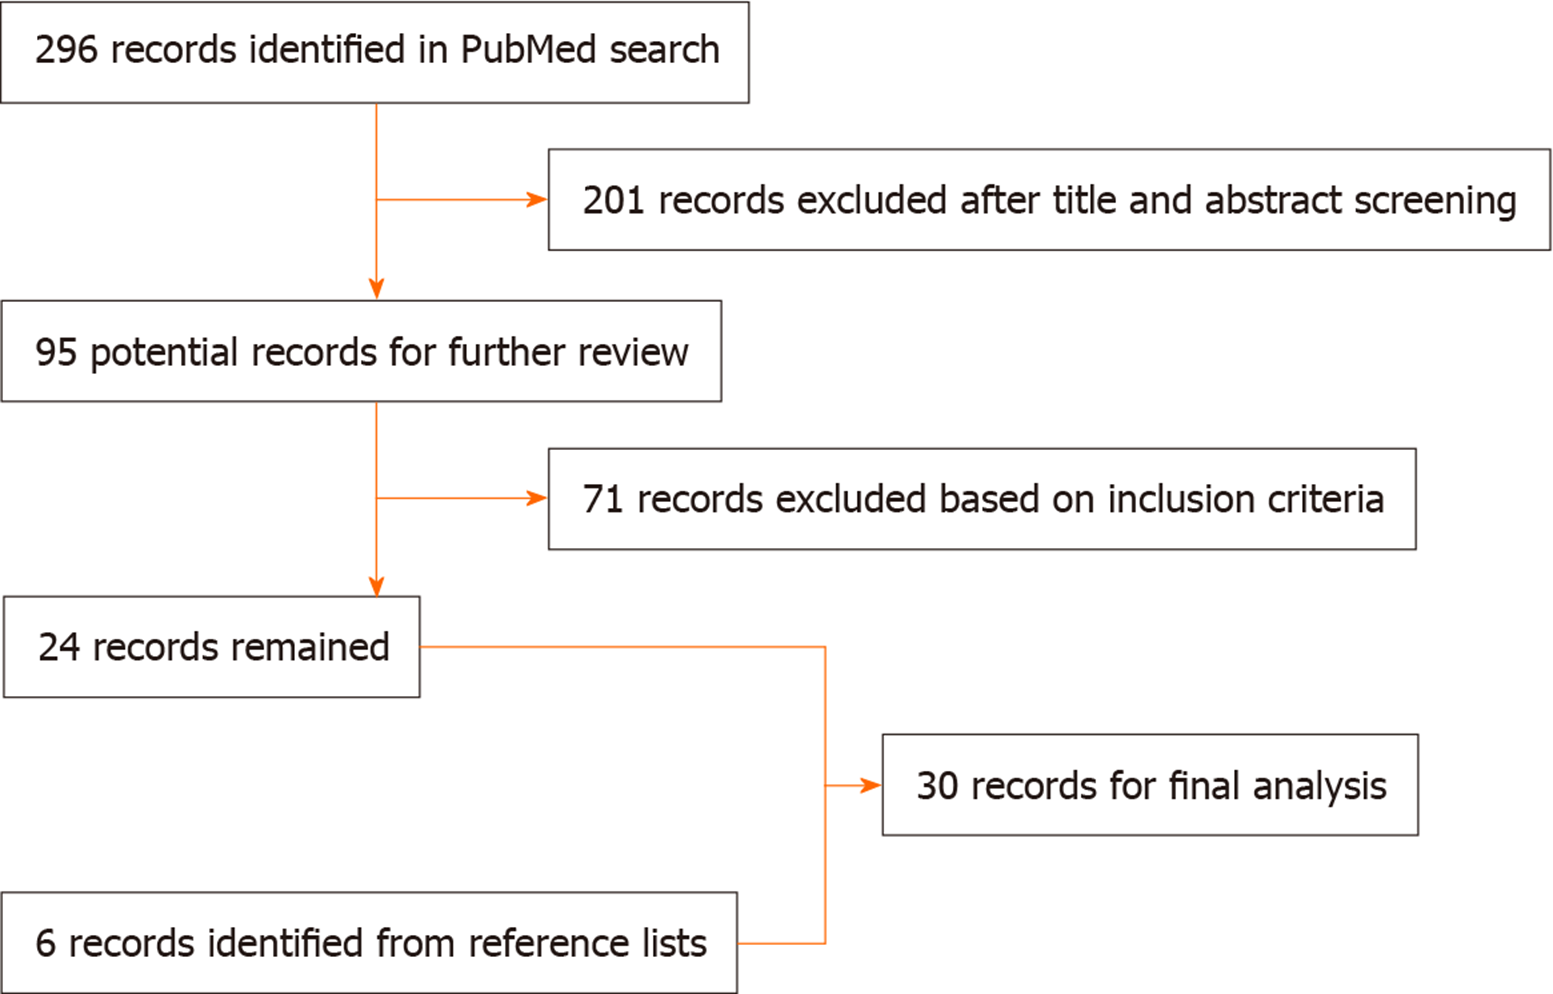
Figure 1 Flowchart showing the selection of related references.
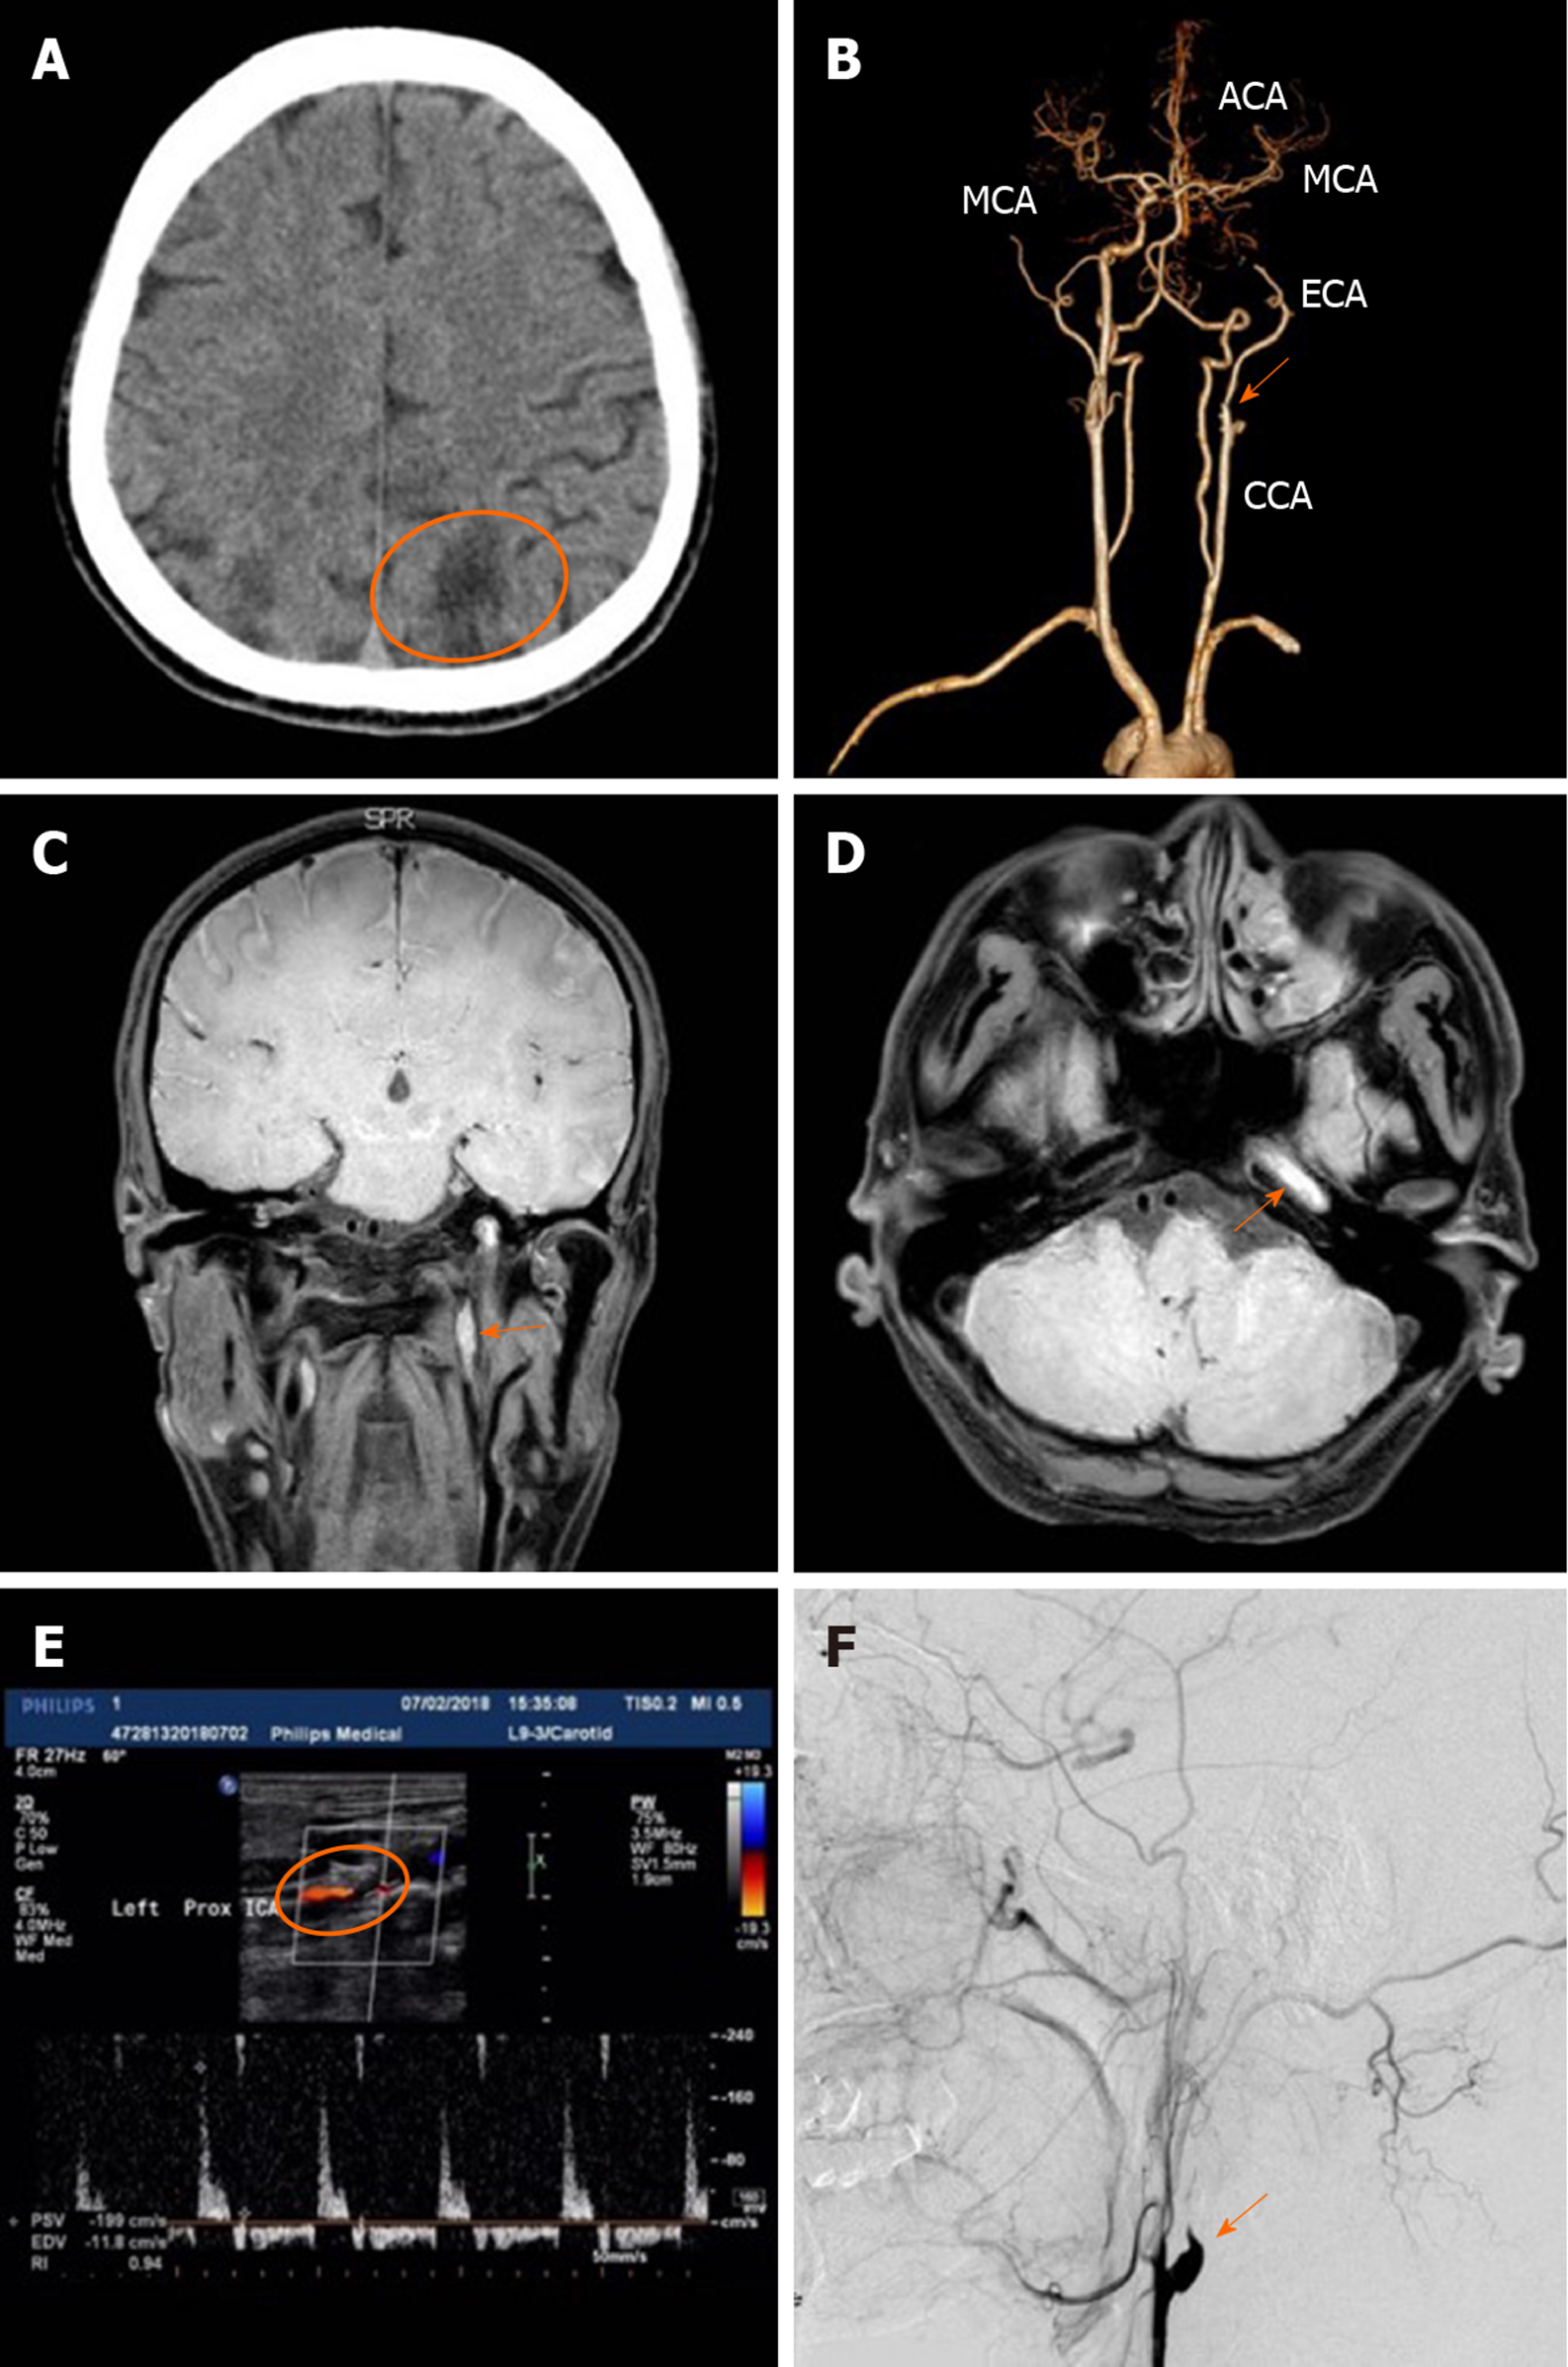
Figure 2 Imaging of case 1.
A: Computed tomography revealed left parietal infarction (ellipse); B: Computed tomography angiography examination revealed tapering occlusion of the Internal carotid artery (ICA) suggestive of ICA dissection (arrow); C and D: Magnetic resonance imaging (T1W-VISTA sequence) demonstrated an intimal intramural hematoma extending to the intracranial section (arrows); E: Duplex ultrasonography examination revealed an intimal flap and significant narrowing of the lumen secondary to the equal-echoic mural hematoma (ellipse); F: Carotid artery digital subtraction angiography showed tapering occlusion of the left ICA just distal to the carotid bifurcation (Rat tail sign) (arrow). ACA: Anterior cerebral artery; CCA: Common carotid artery; ECA: External carotid artery; MCA: Middle cerebral artery.
Figure 3 Imaging of case 2.
A: Computed tomography (CT) showed a hyperdense right middle cerebral artery sign (arrow); B: CT revealed a large hypodense lesion with a mass effect in the frontotemporoparietal region (in the red line region) and a brain contusion in the frontal lobe (arrow); C: CT angiography examination revealed the anterior cerebral artery origin (asterisk) and middle cerebral artery (ellipse) occlusions suggestive of internal carotid artery dissection (arrow); D: A 3D-CT scan showed a mandibular fracture (ellipse). MCA: Middle cerebral artery.
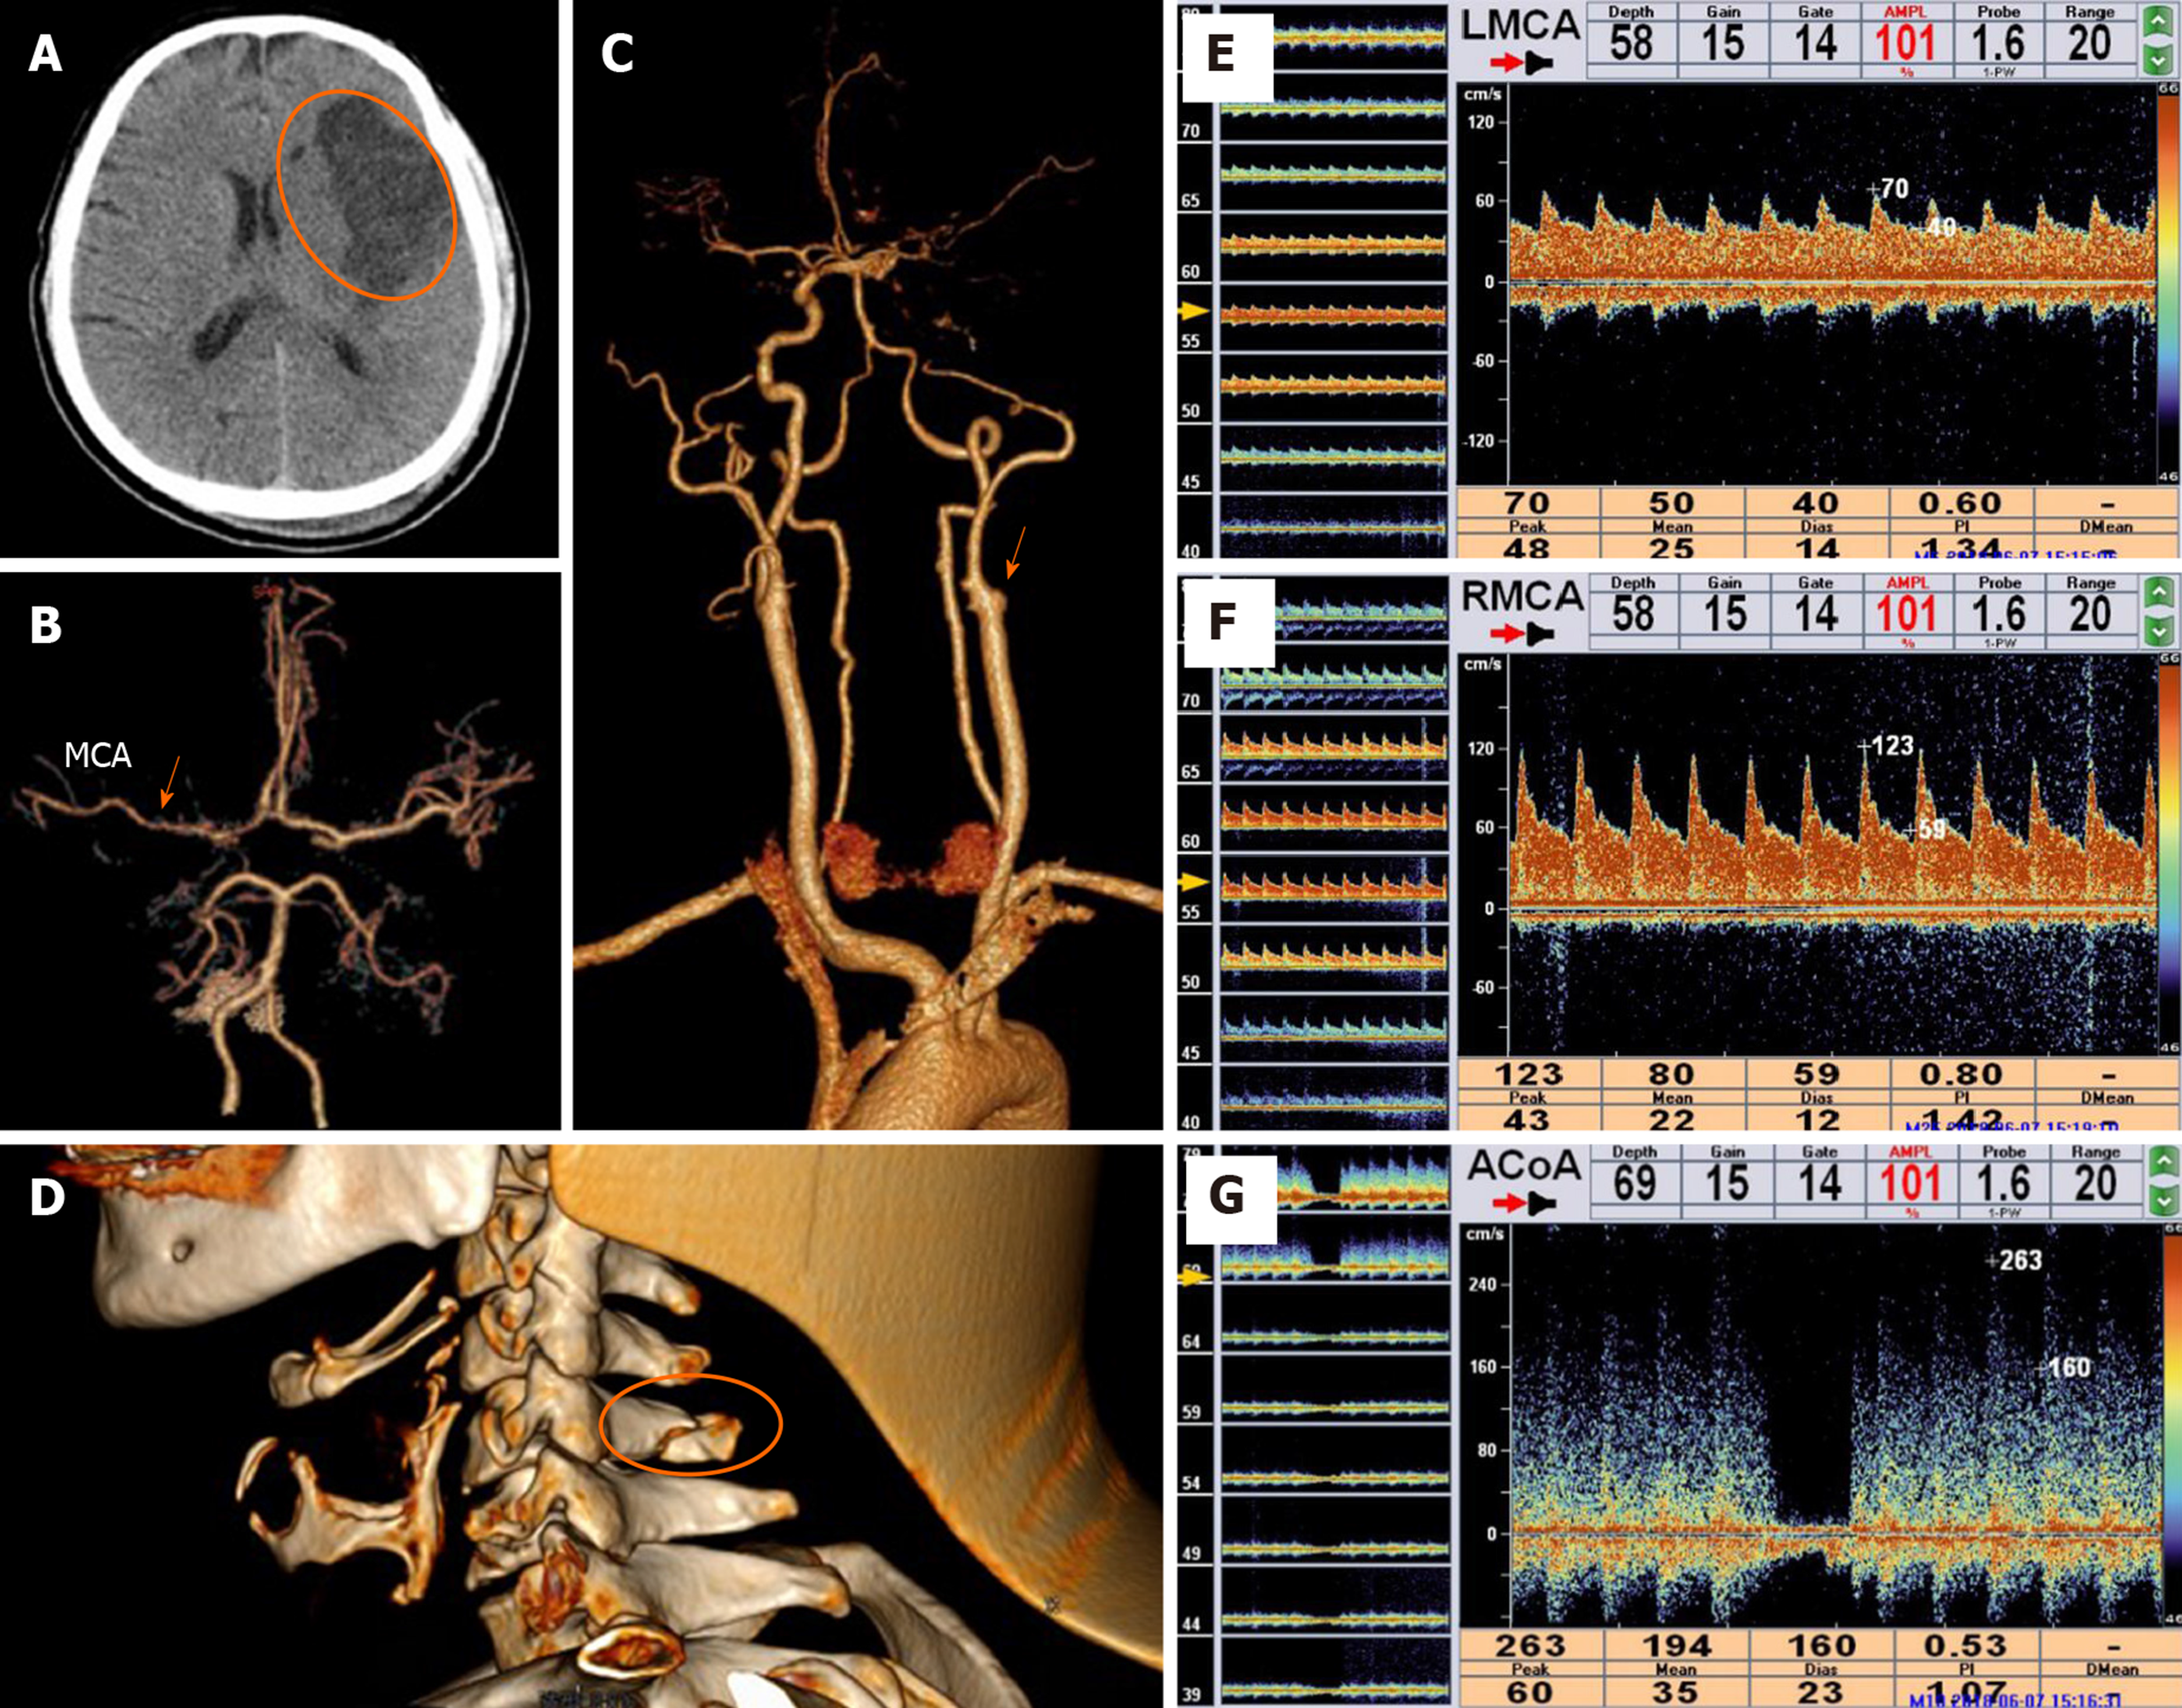
Figure 4 Imaging of case 3.
A: Computed tomography (CT) revealed left frontotemporal infarction (ellipse); B: Head CT angiography revealed a thin middle cerebral artery (arrow); C: Cervical CT angiography revealed left internal carotid artery occlusion (arrow); D: A 3D-CT scan showed a cervical spinous process fracture (ellipse); E and F: Transcranial doppler showed asymmetry between the blood flow velocities of the two middle cerebral artery caused by left traumatic internal carotid artery dissection; G: When the right internal carotid artery was subjected to a neck compression test, the velocity of the anterior communicating artery rapidly decreased to zero and recovered when the compression was released. In E-G: FVd is the diastolic blood flow velocity, FVm is the mean blood flow velocity, FVs is the systolic blood flow velocity, and PI is the pulsatility index. MCA: Middle cerebral artery.
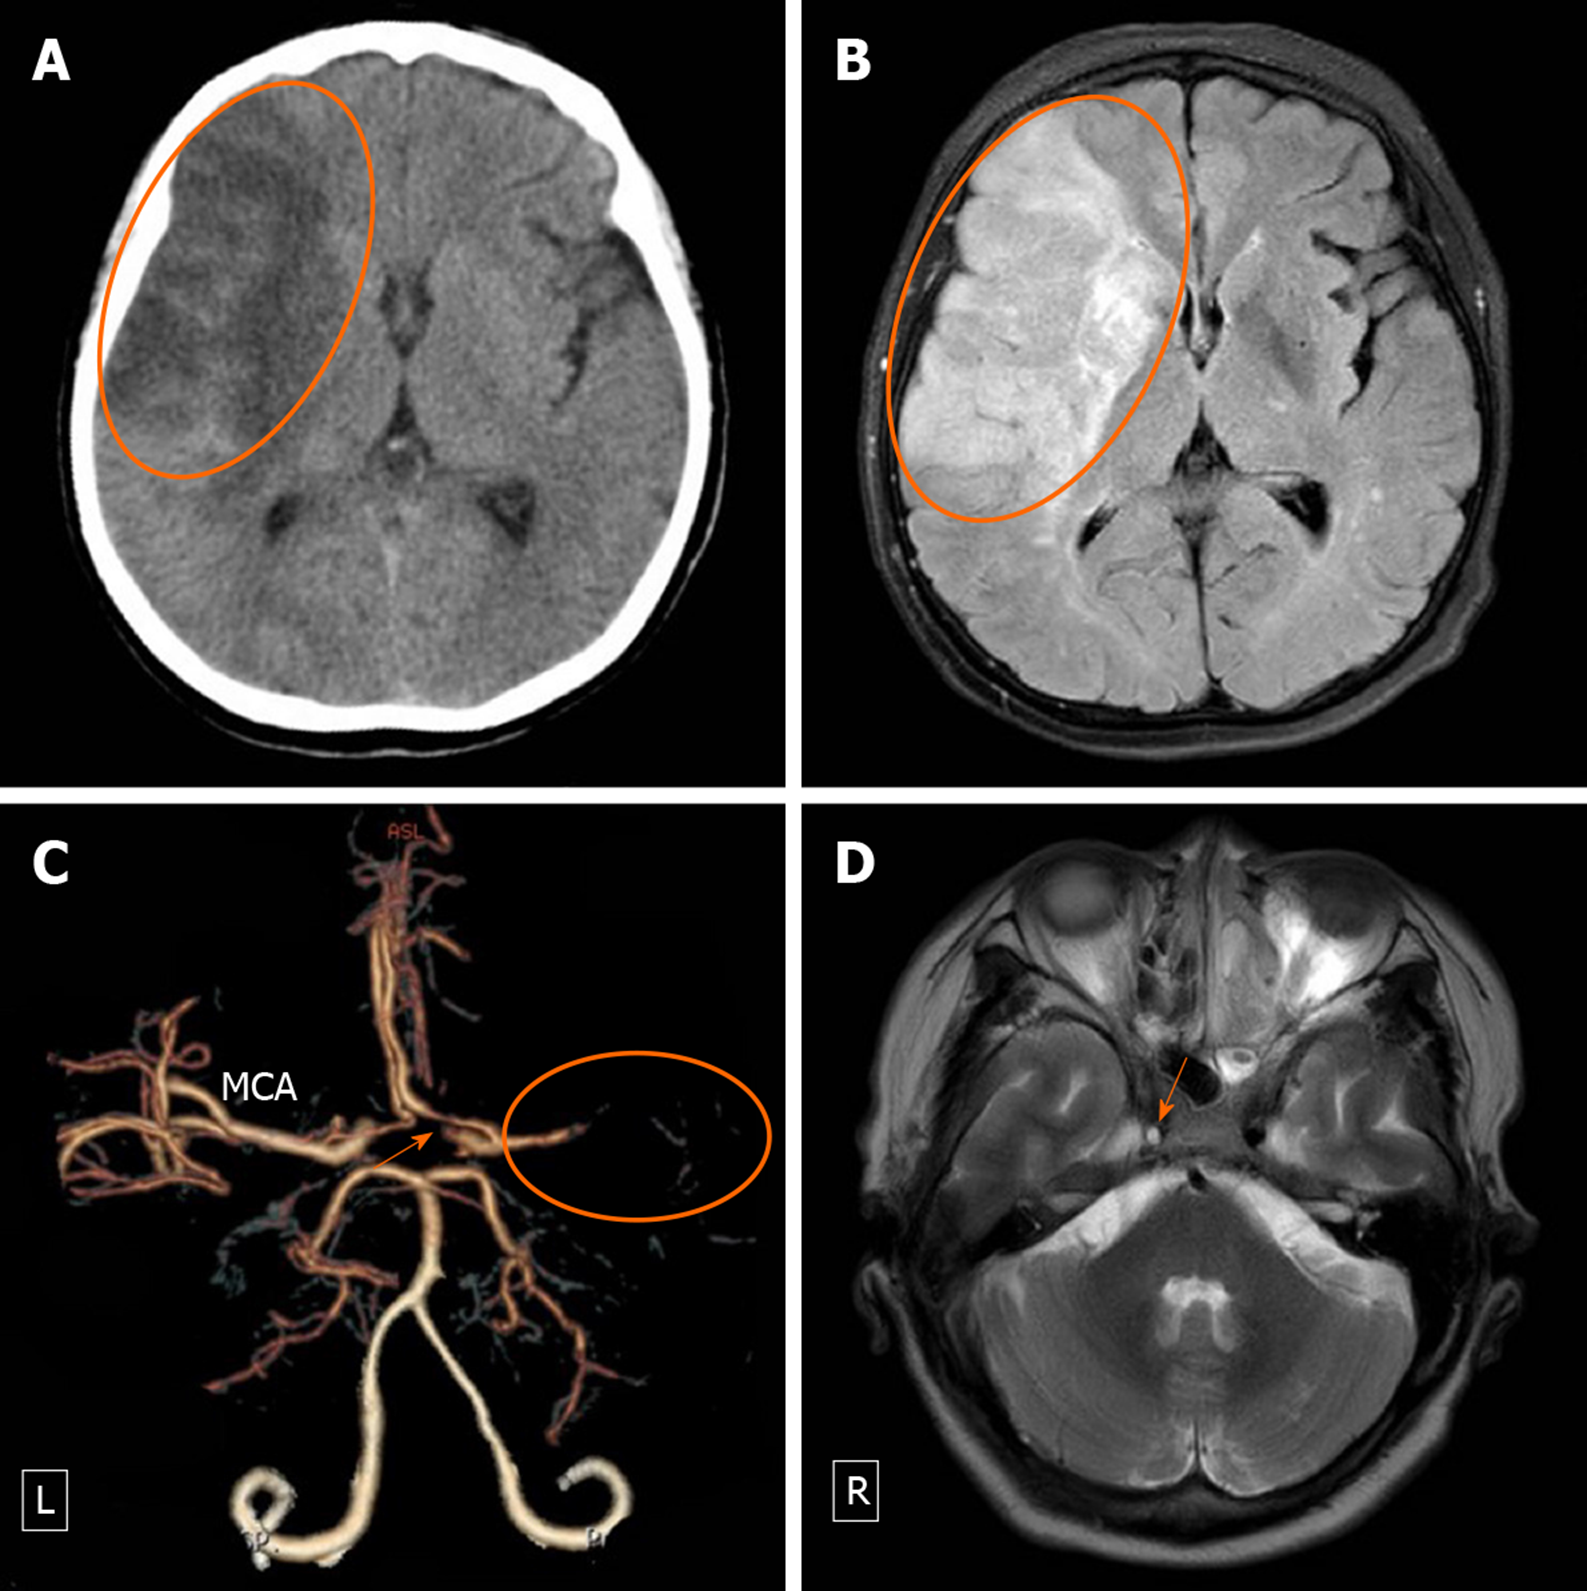
Figure 5 Imaging of case 5.
A and B: Computed tomography (A) and (B) magnetic resonance imaging scans showed cerebral infarction in the territory of the right middle cerebral artery (ellipses); C: Computed tomography angiography revealed tapering occlusion of the right middle cerebral artery (ellipse), and the internal carotid artery in the cavernous sinus segment became thin and irregular (arrow); D: Magnetic resonance imaging showed right internal carotid artery dissection depicted as a partial flow-void lumen surrounded by high-intensity signals of an intramural hematoma (arrow). MCA: Middle cerebral artery.
Figure 6 Imaging of case 6.
A: Computed tomography revealed right frontotemporal infarction (ellipse) with a mass effect on the lateral ventricle and a midline shift; B: Computed tomography angiography revealed right internal carotid artery occlusion (asterisk) and a thin middle cerebral artery (arrow); C: Computed tomography revealed the decompression craniectomy with expansion of the infarcted brain parenchyma. MCA: Middle cerebral artery.
- Citation: Wang GM, Xue H, Guo ZJ, Yu JL. Cerebral infarct secondary to traumatic internal carotid artery dissection. World J Clin Cases 2020; 8(20): 4773-4784
- URL: https://www.wjgnet.com/2307-8960/full/v8/i20/4773.htm
- DOI: https://dx.doi.org/10.12998/wjcc.v8.i20.4773


