Copyright
©The Author(s) 2020.
World J Clin Cases. Jan 26, 2020; 8(2): 390-397
Published online Jan 26, 2020. doi: 10.12998/wjcc.v8.i2.390
Published online Jan 26, 2020. doi: 10.12998/wjcc.v8.i2.390
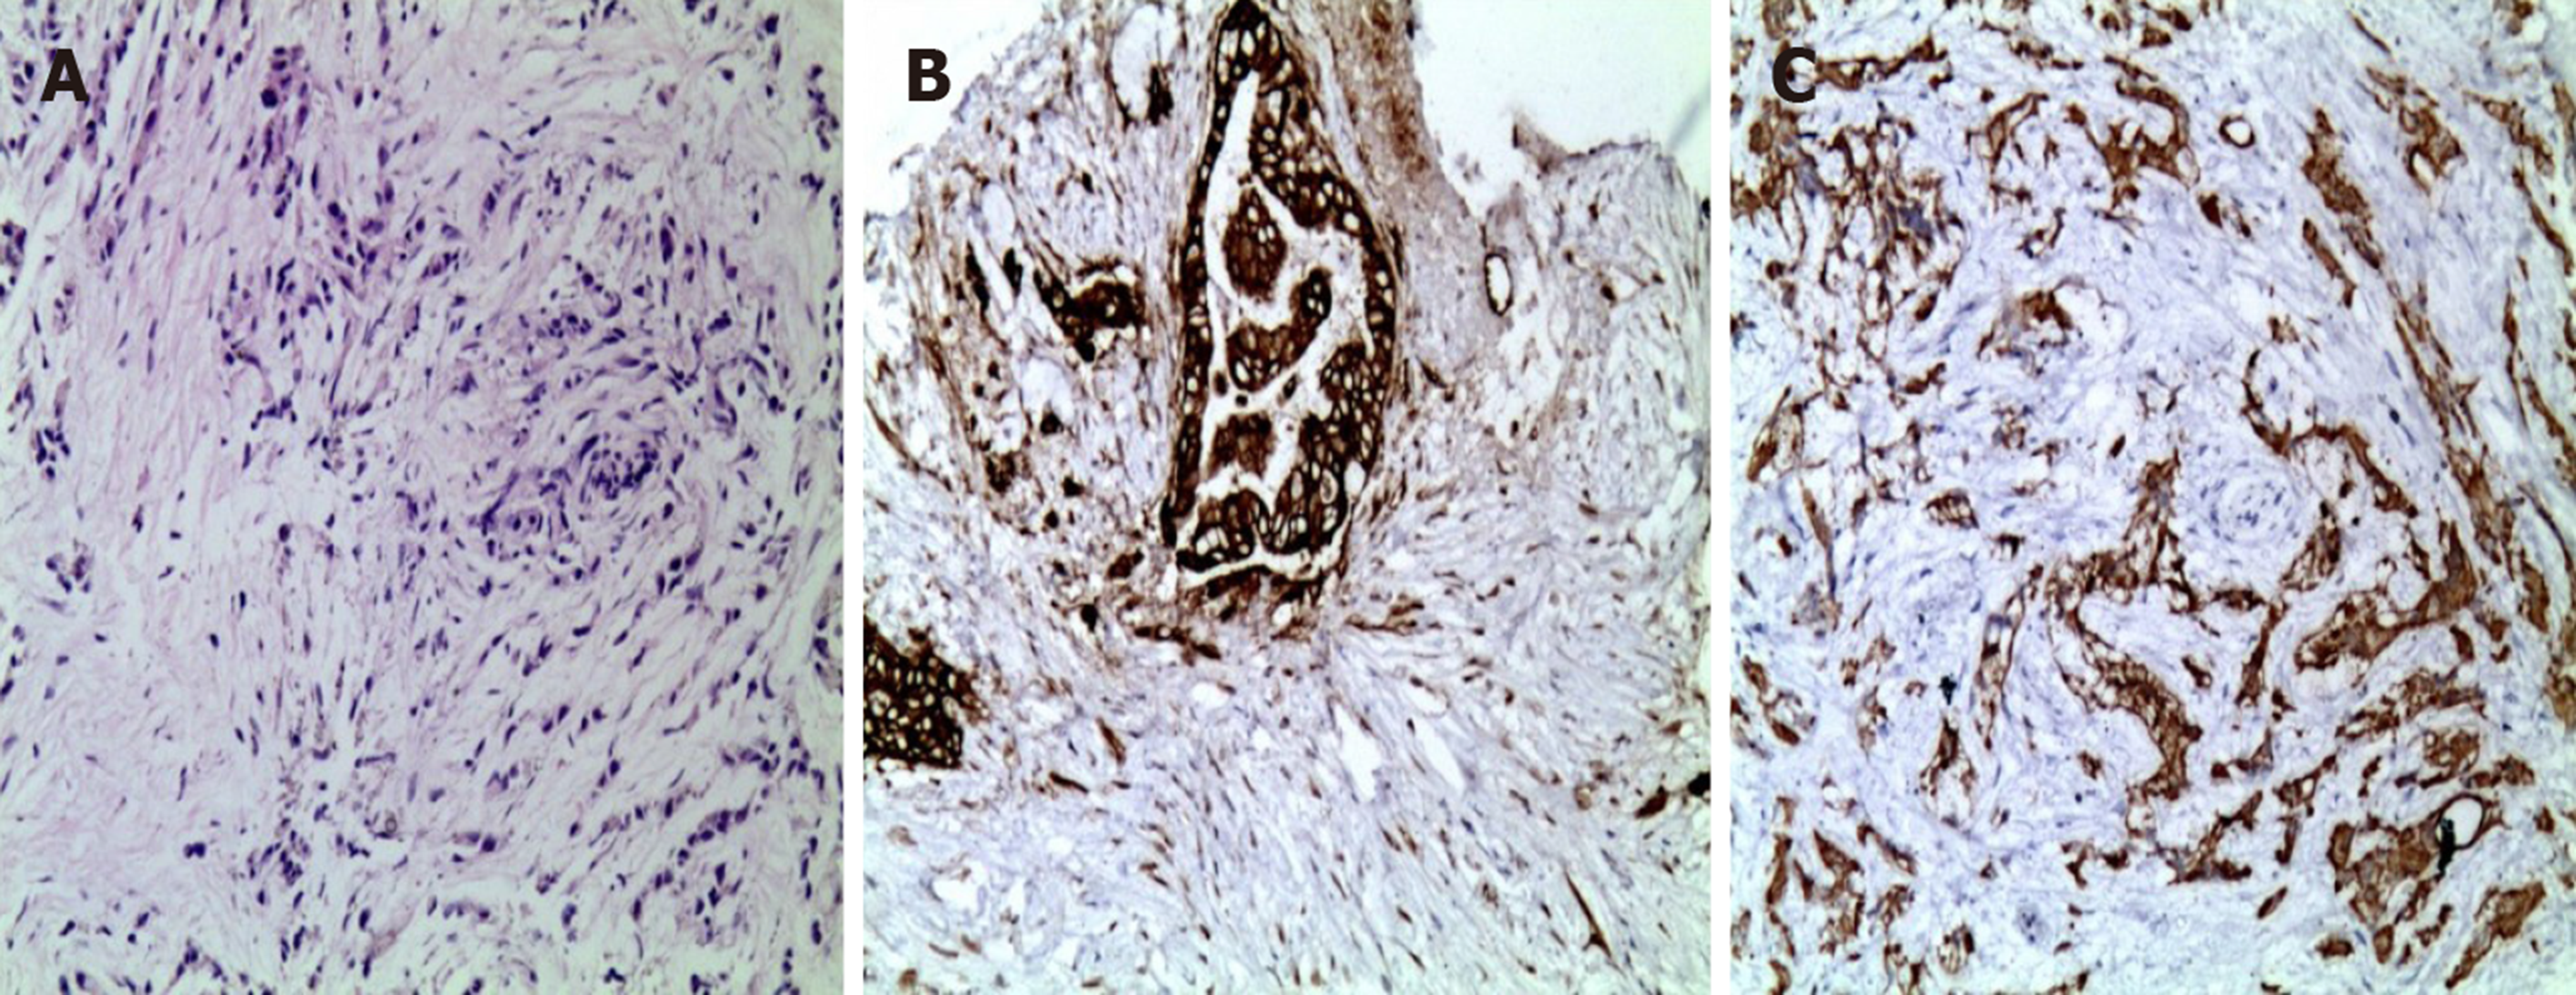
Figure 1 Pathological examination of the pancreatic mass.
A: Hematoxylin and eosin staining; B: CK7 (+); C: CK19 (+) (200×).
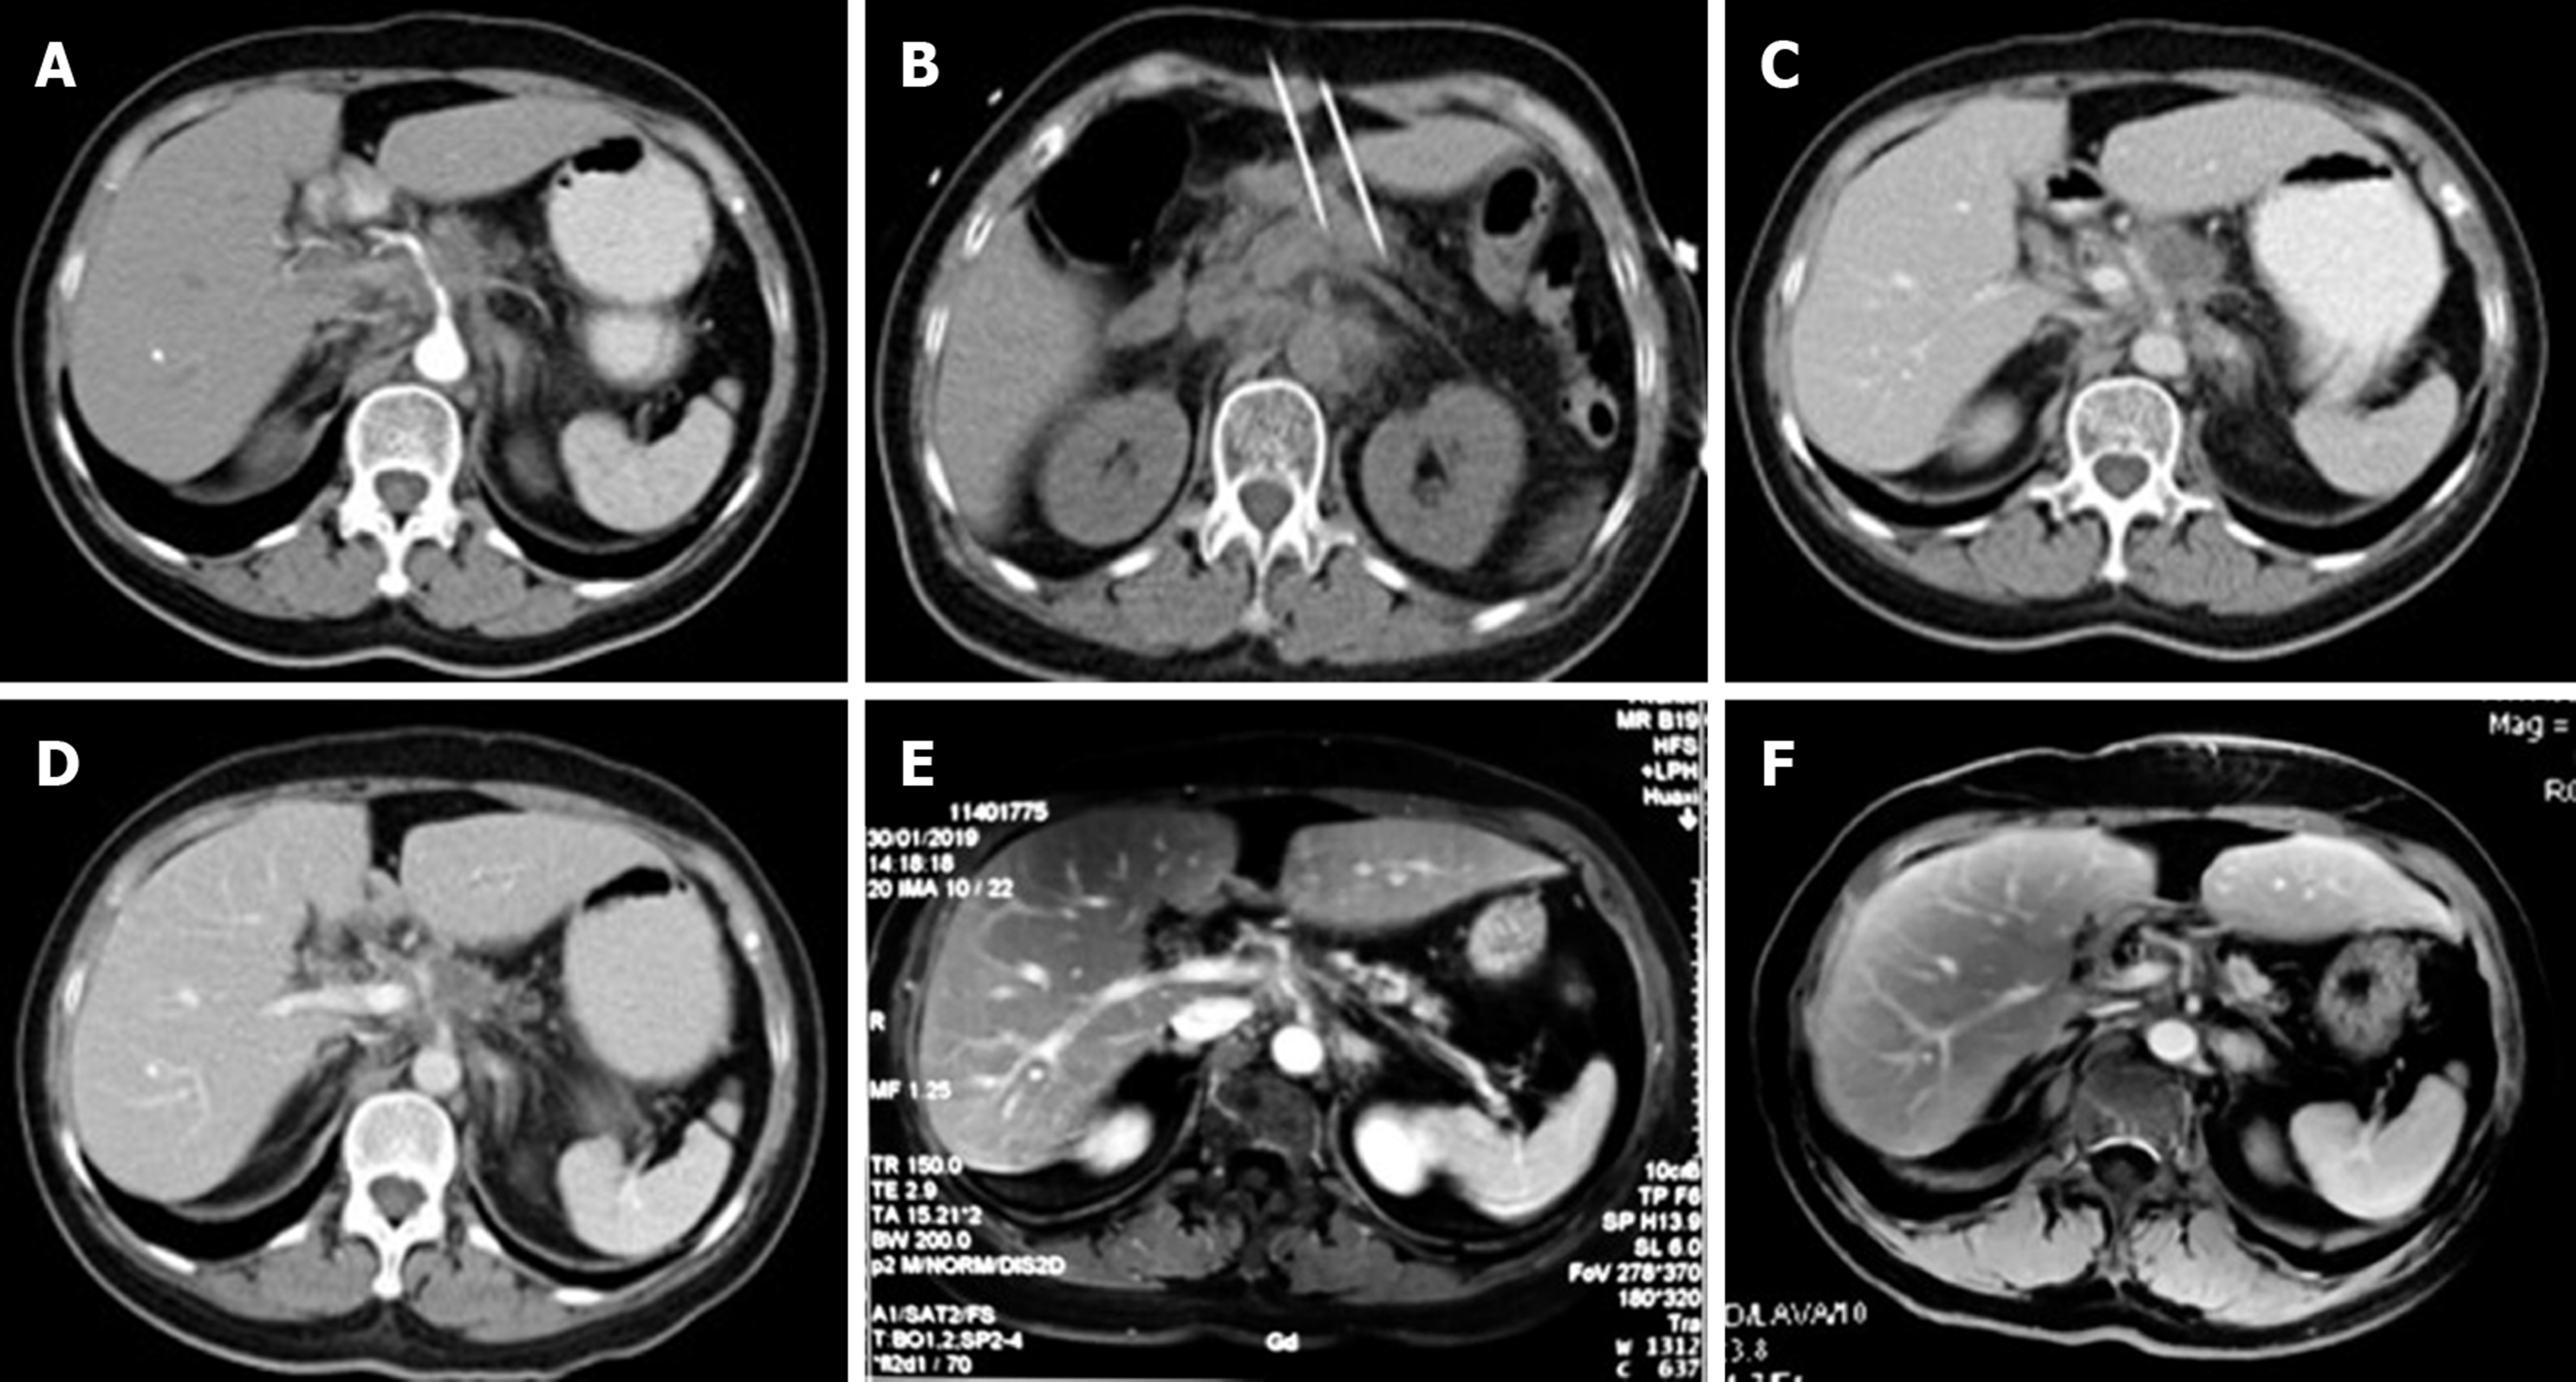
Figure 2 Pancreatic tumor before, during, and after irreversible electroporation.
A: Before irreversible electroporation (IRE), computed tomography showed a pancreatic tumor measuring 2.7 cm × 2.5 cm (arrow); B: IRE was performed; C: At 1 mo after IRE, the tumor shrank to 2.9 cm × 2.0 cm; D: At 4 mo after IRE, the tumor shrank to 2.6 cm × 1.9 cm; E: At 6 mo after IRE, the tumor shrank to 1.5 cm × 1.6 cm; F: At 12 mo after IRE, a complete response was achieved.
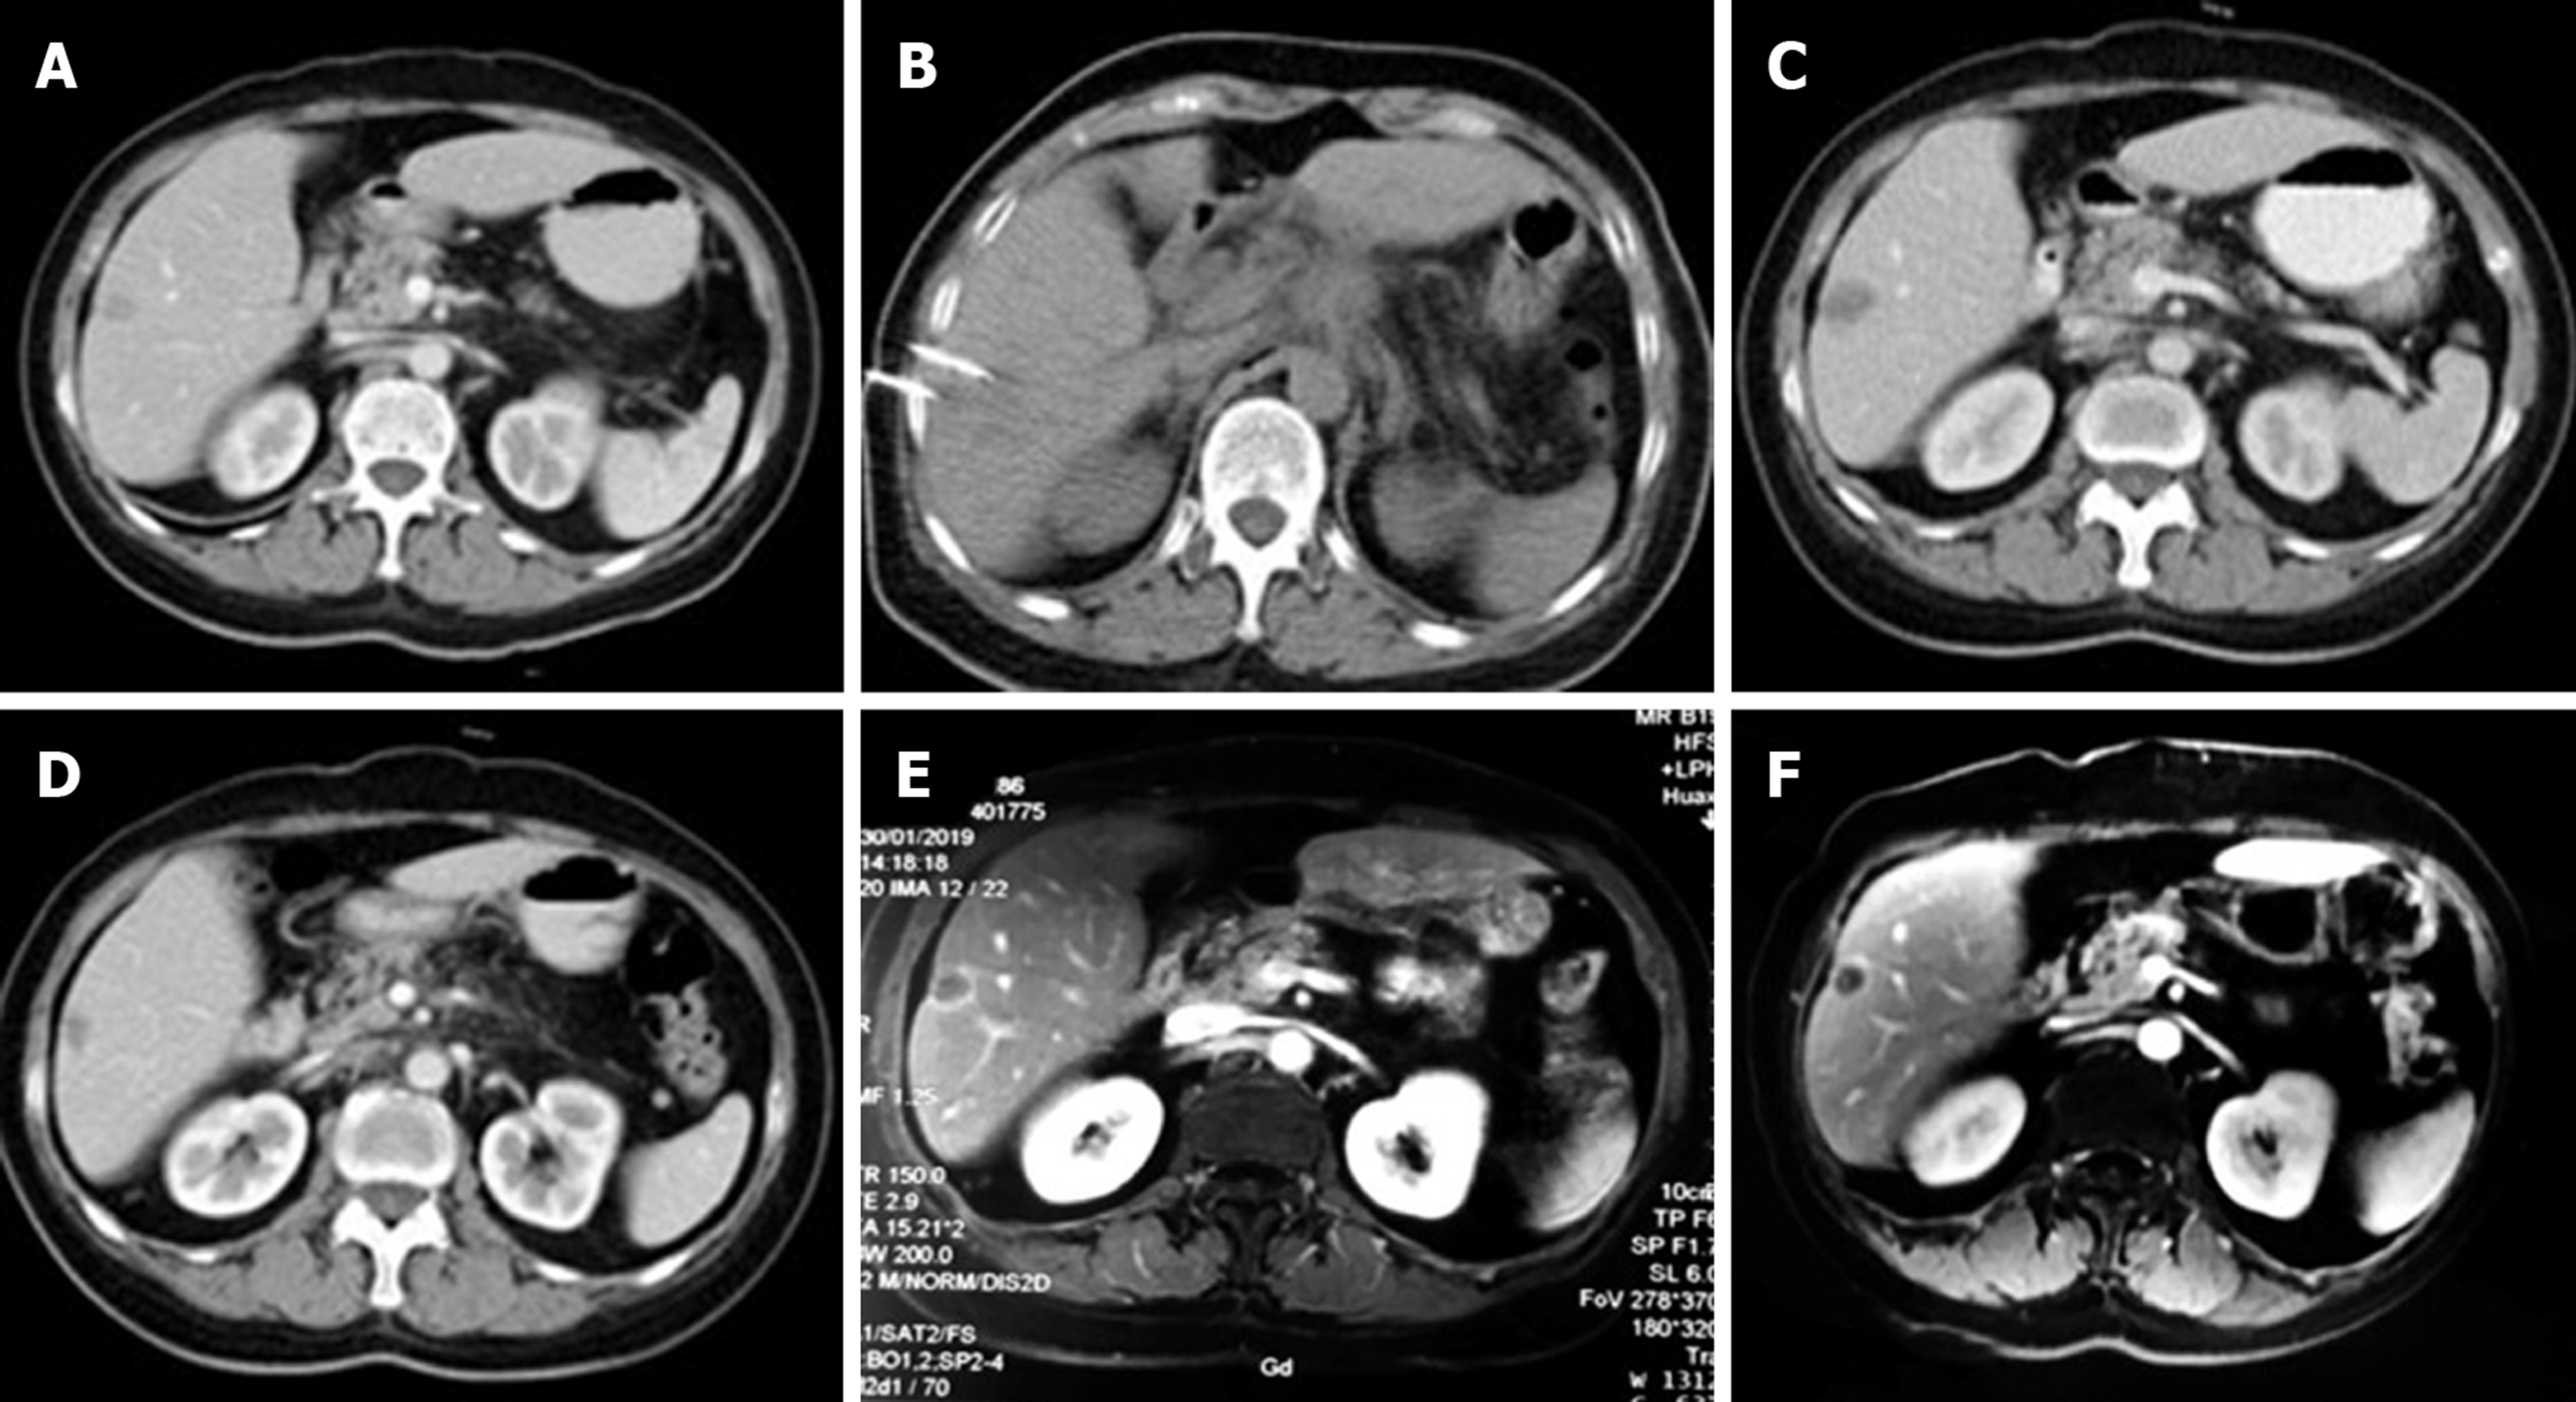
Figure 3 Liver tumor before, during, and after irreversible electroporation.
A: Before irreversible electroporation (IRE), computed tomography showed a liver tumor measuring 1.4 cm × 1.1 cm (arrow); B: IRE was performed; C: At 1 mo after IRE, the tumor shrank to 1.9 cm × 1.5 cm; D: At 4 mo after IRE, the tumor shrank to 1.4 cm × 1.4 cm; E: At 6 mo after IRE, the tumor shrank to 1.4 cm × 1.2 cm; F: At 12 mo after IRE, the tumor shrank to 1.2 cm × 0.9 cm.
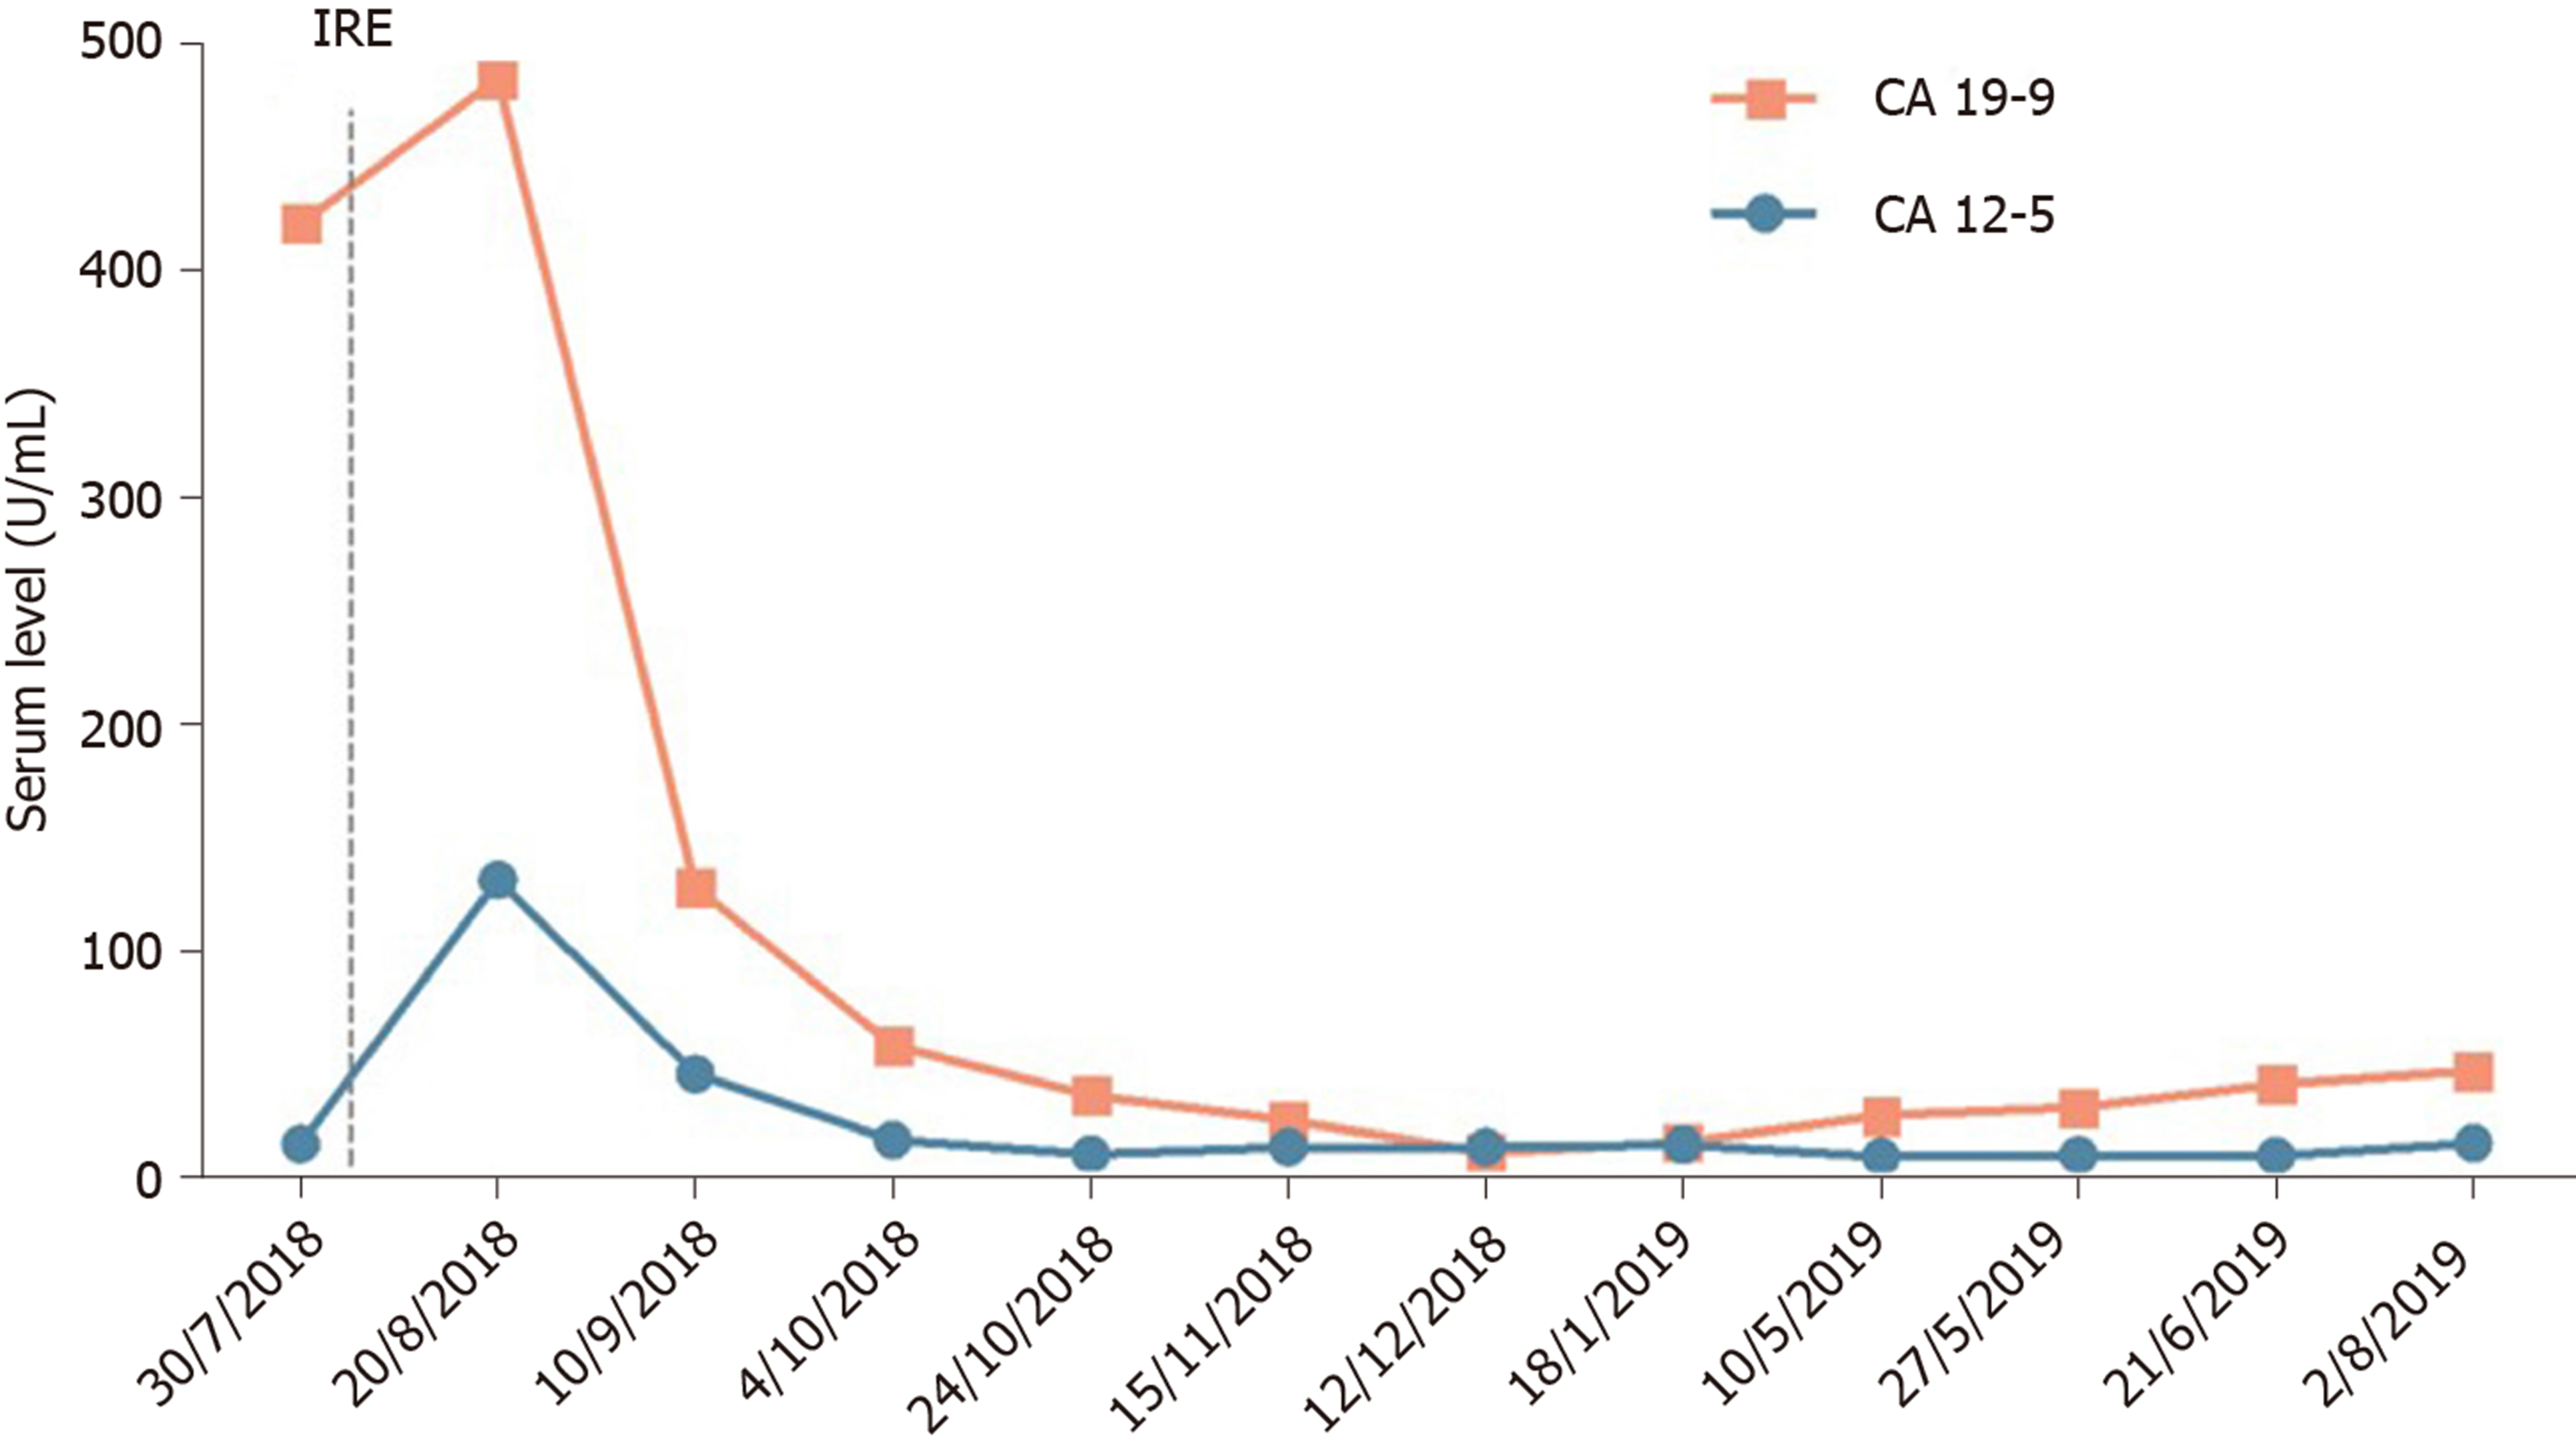
Figure 4 Serum carbohydrate antigen 19-9 and carbohydrate antigen 12-5 levels during treatment.
CA: Carbohydrate antigen; IRE: Irreversible electroporation.
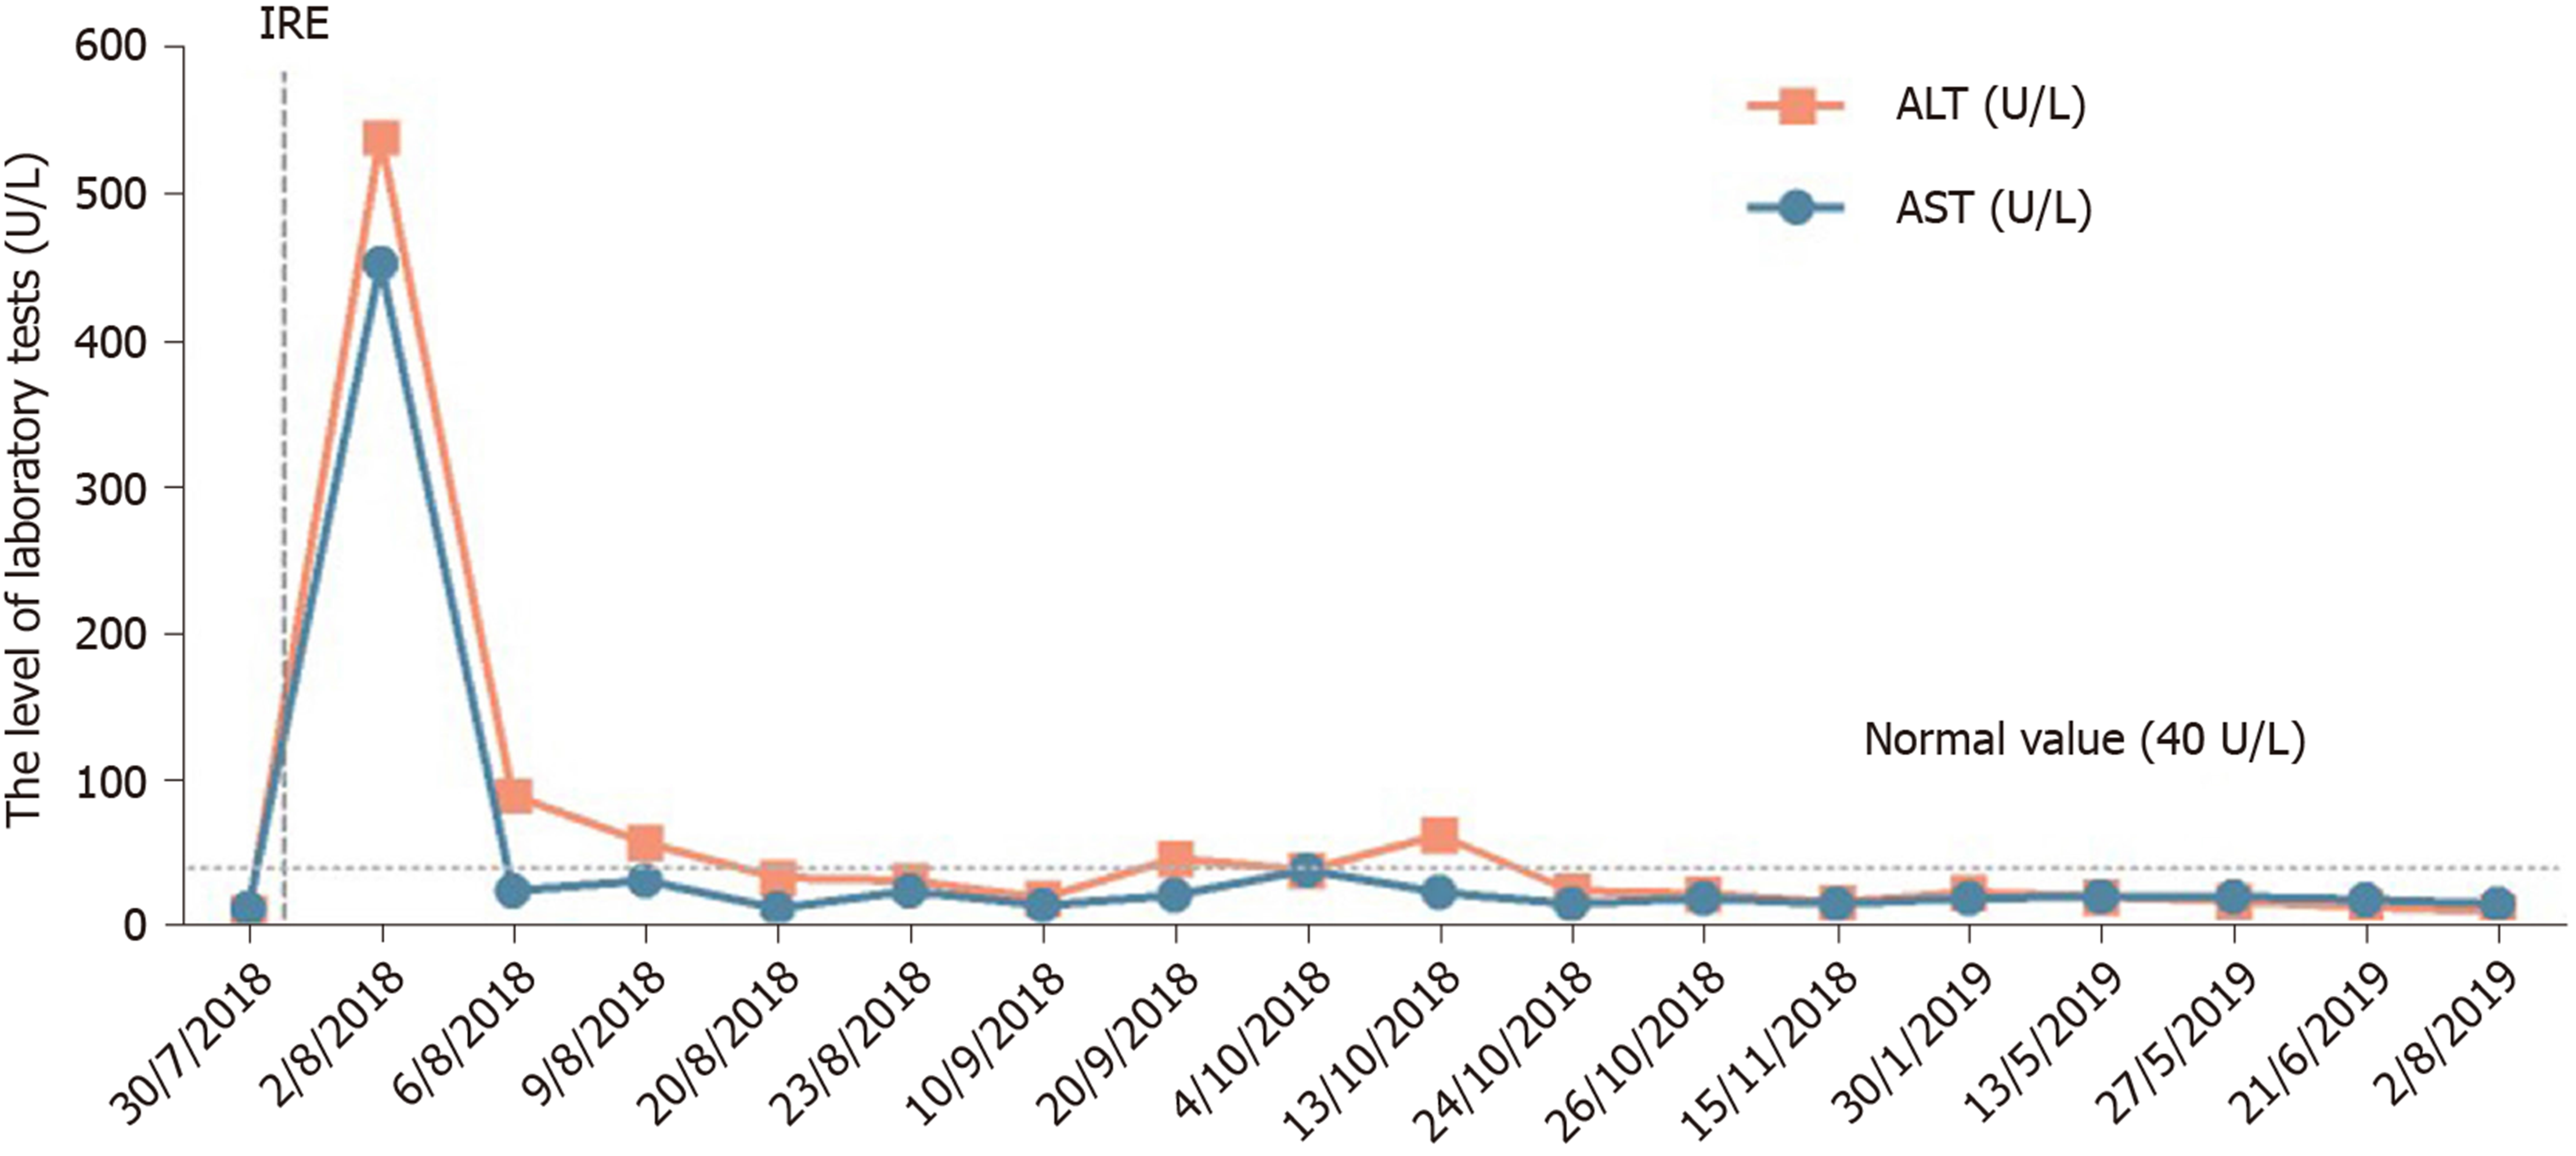
Figure 5 Changes in alanine aminotransferase and aspartate aminotransferase levels during the hospital stay.
ALT: Alanine aminotransferase; AST: Aspartate aminotransferase; IRE: Irreversible electroporation.
- Citation: Ma YY, Shi JJ, Chen JB, Xu KC, Niu LZ. Irreversible electroporation for liver metastasis from pancreatic cancer: A case report. World J Clin Cases 2020; 8(2): 390-397
- URL: https://www.wjgnet.com/2307-8960/full/v8/i2/390.htm
- DOI: https://dx.doi.org/10.12998/wjcc.v8.i2.390


