Copyright
©The Author(s) 2020.
World J Clin Cases. Sep 26, 2020; 8(18): 4135-4150
Published online Sep 26, 2020. doi: 10.12998/wjcc.v8.i18.4135
Published online Sep 26, 2020. doi: 10.12998/wjcc.v8.i18.4135
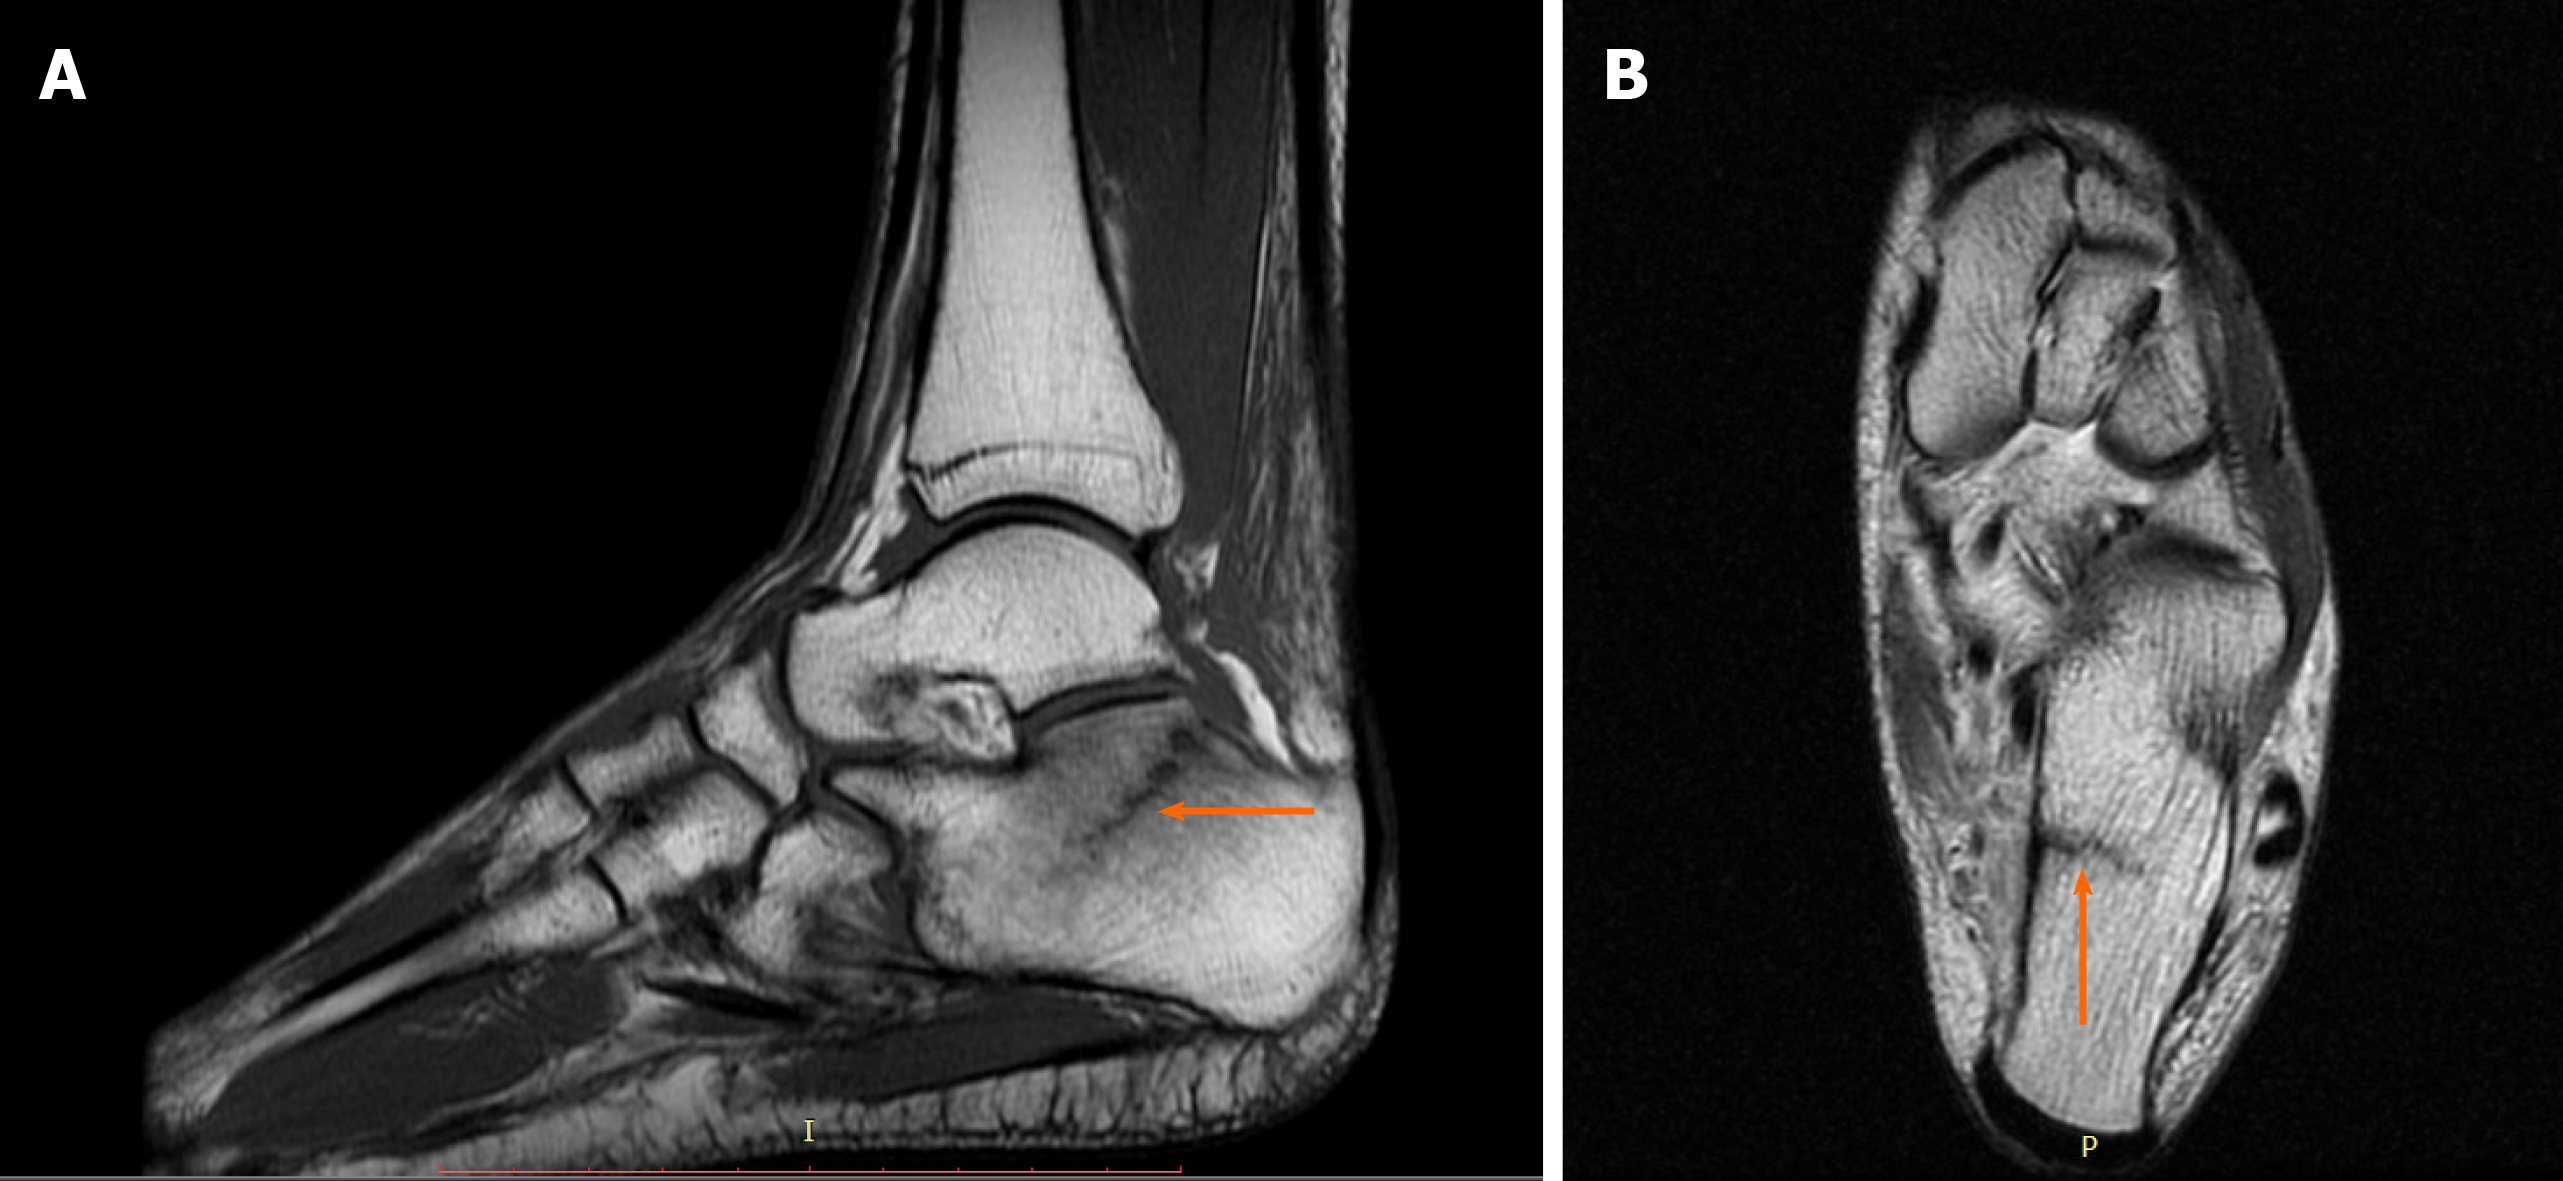
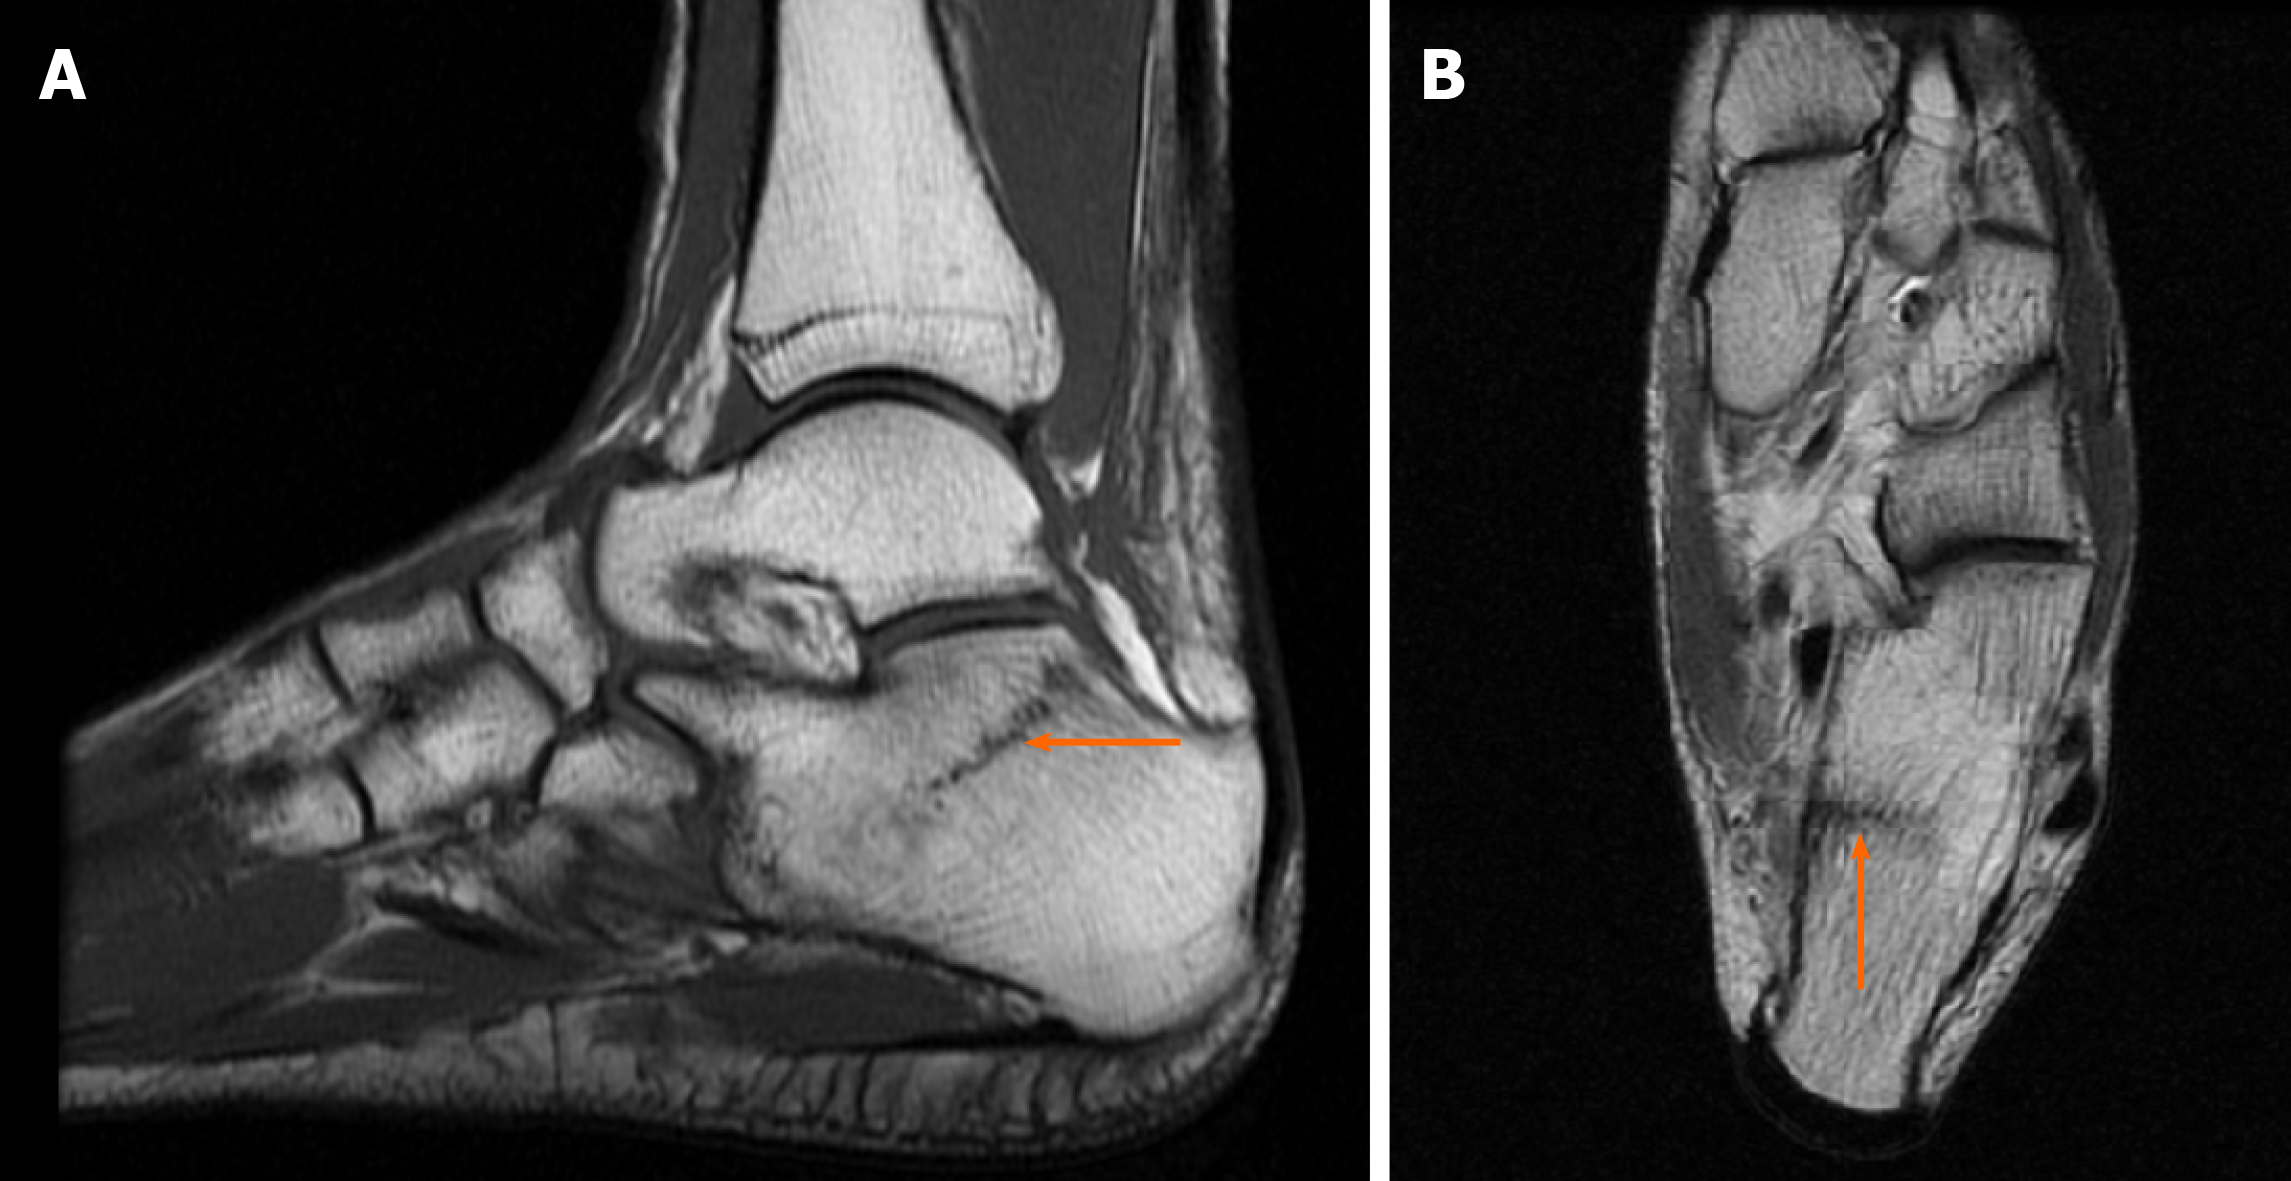
Figure 1 Diagnostic images from the magnetic resonance imaging examination.
A: T1-weighted sagittal fast spin echo cross-section of the left foot; B: T2-weighted axial FSE cross-section, with the fracture site marked (orange arrow).
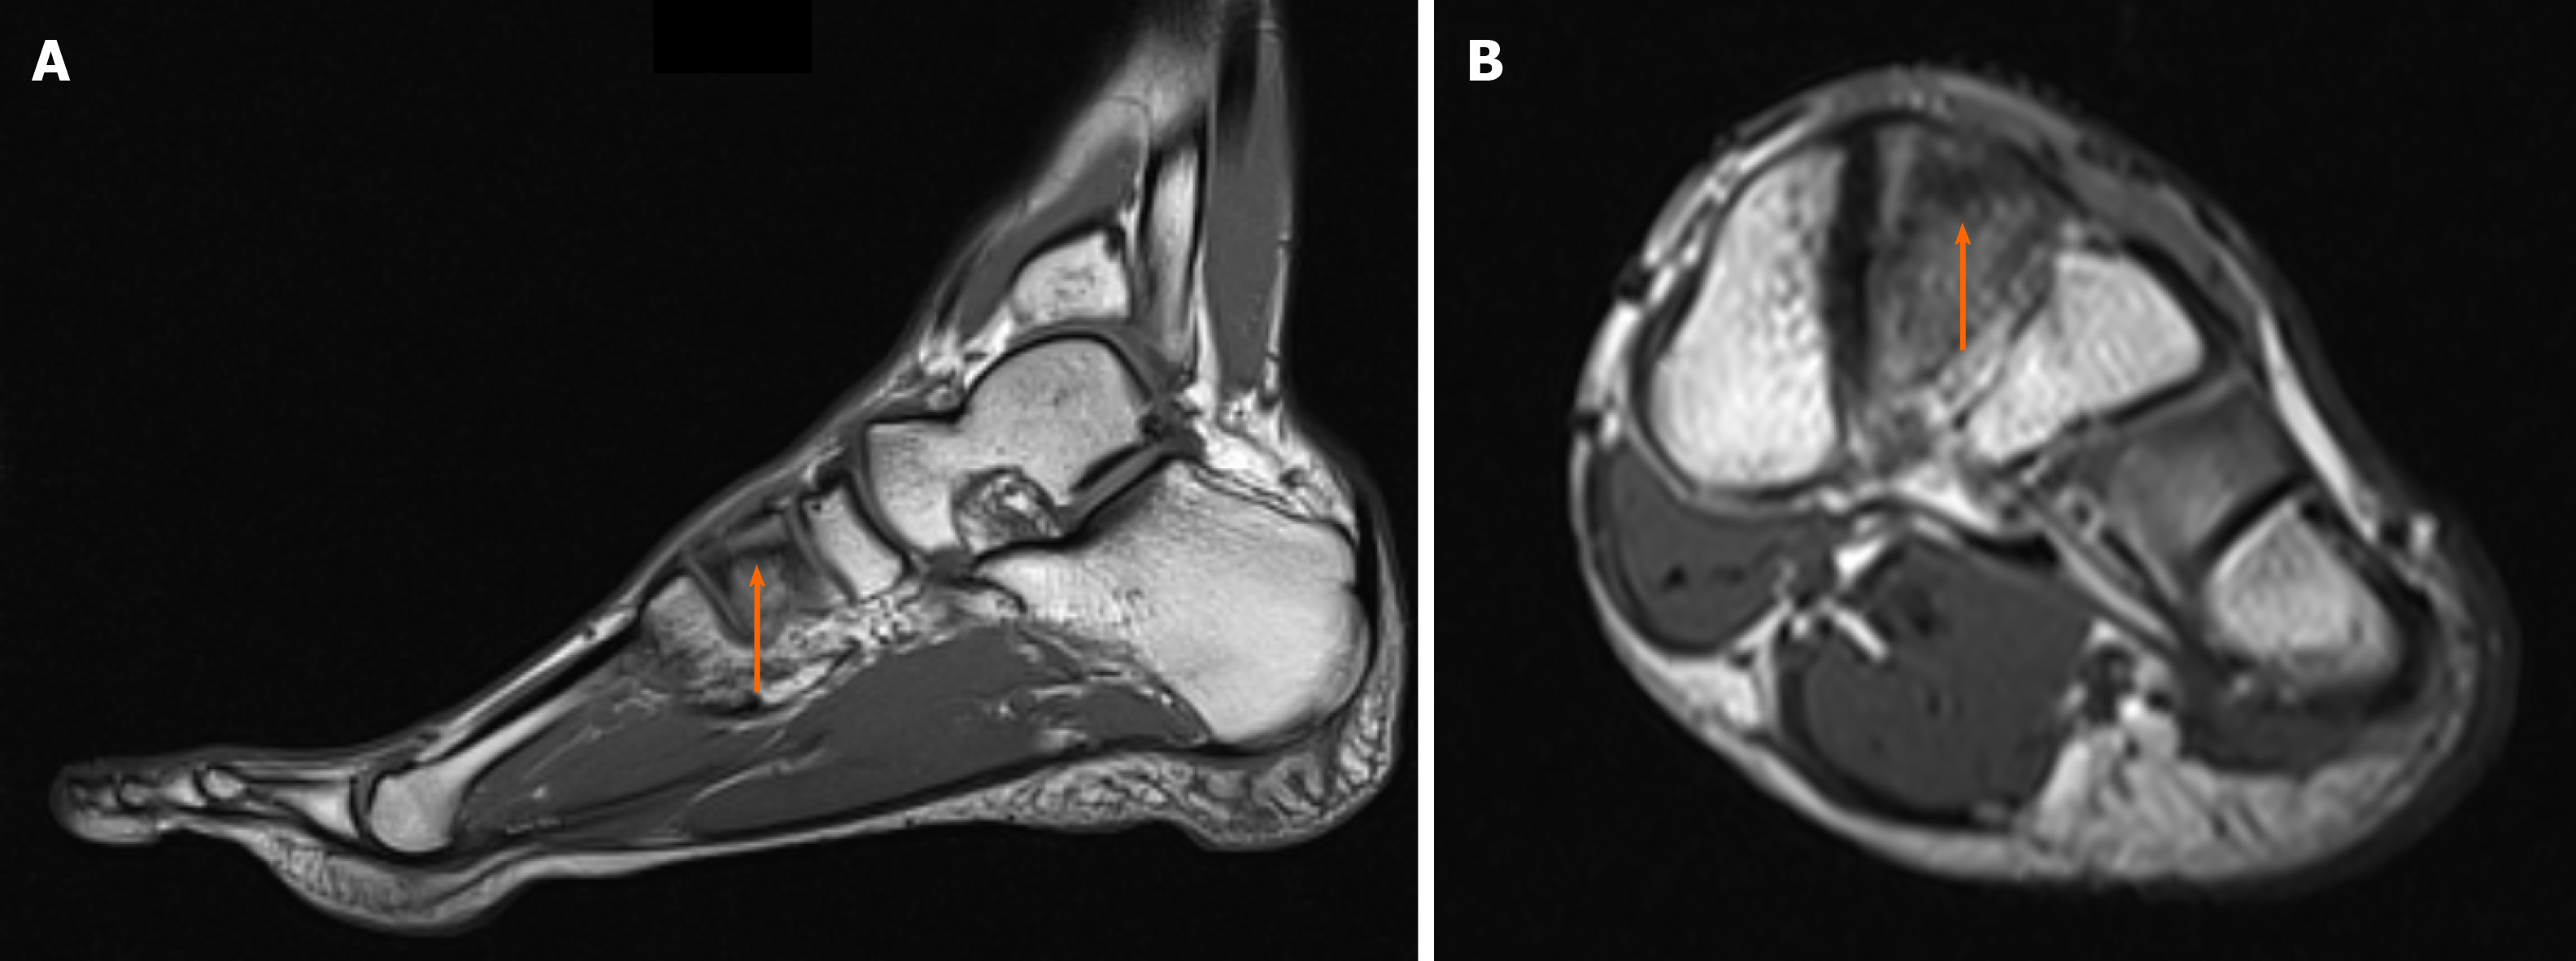
Figure 2 Diagnostic images from the magnetic resonance imaging examination.
A: T1-weighted sagittal cross-section of the left foot; B: T1-weighted coronal cross-section, with the fracture site marked (orange arrow).
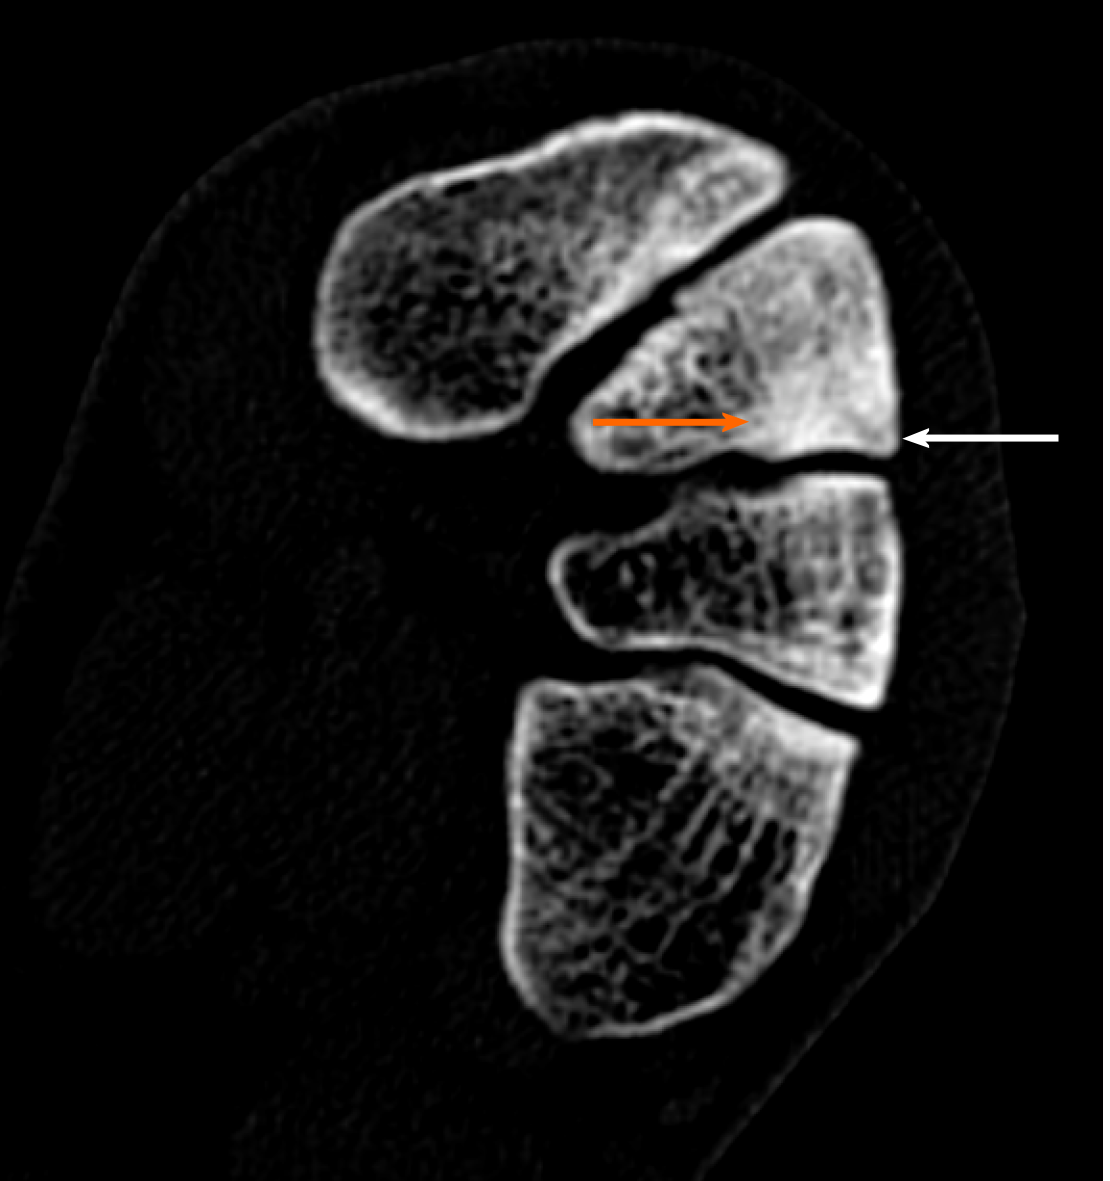
Figure 3 Diagnostic images from the computed tomography examination; sclerotic remodeling of bone tissue–orange arrow, very small cleft of the fracture–white arrow.
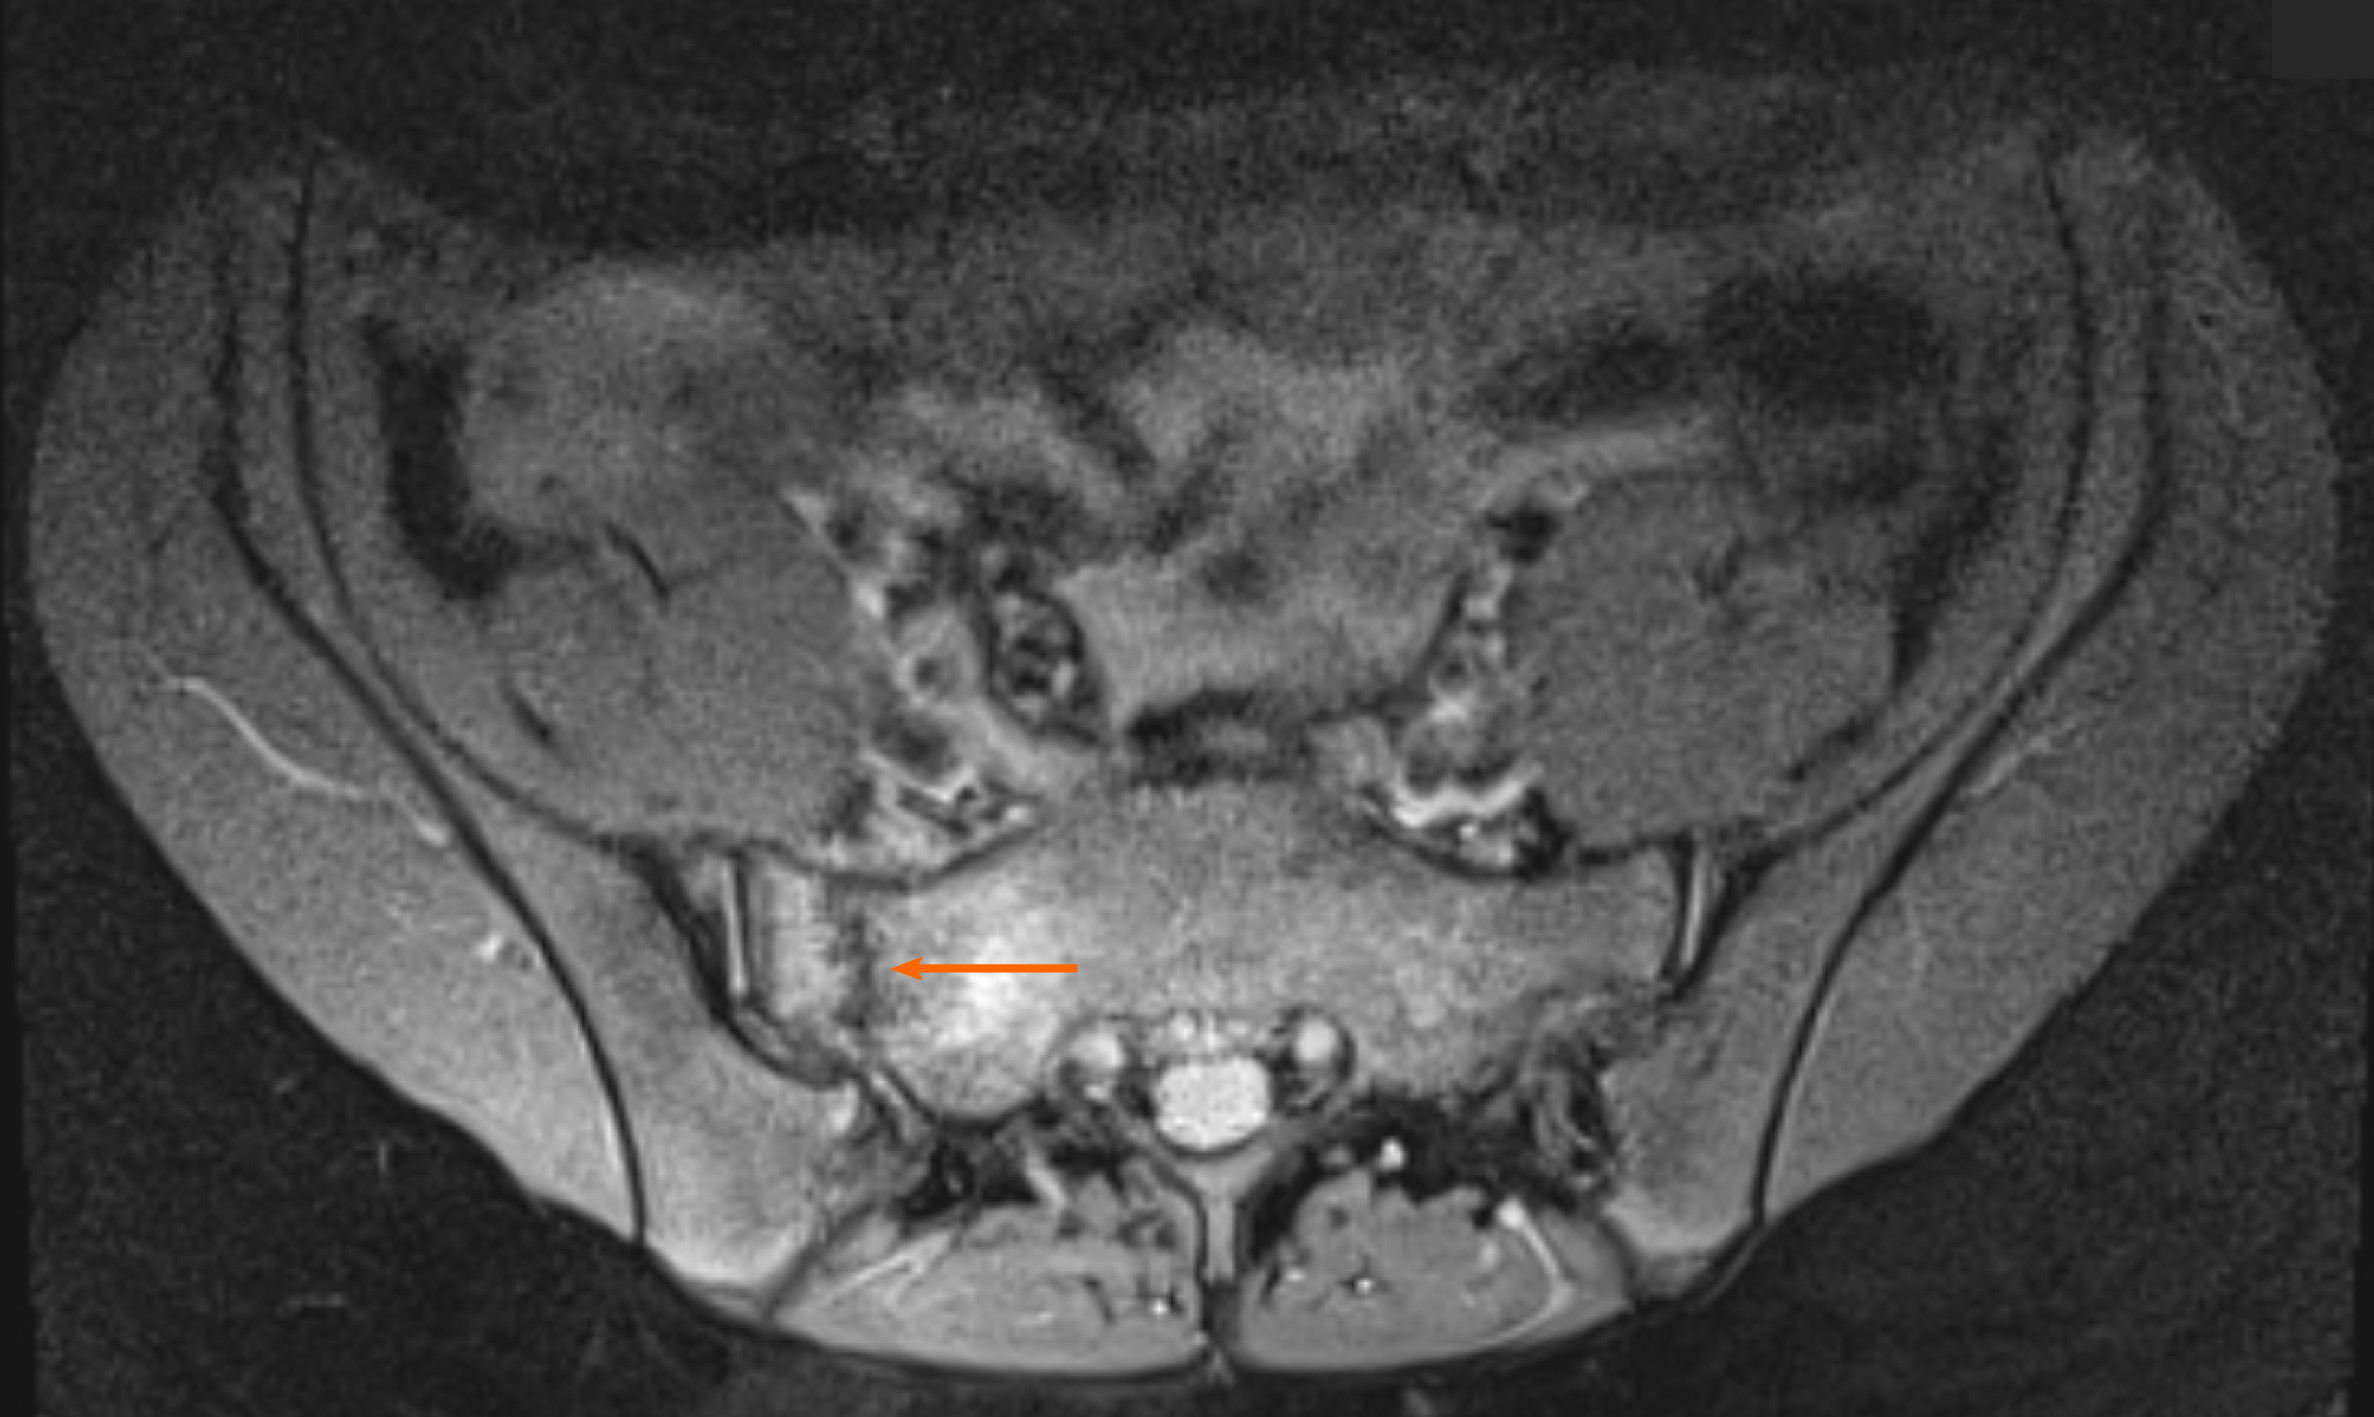
Figure 4 Diagnostic proton density weighted fat-suppressed (fs) axial images from the magnetic resonance imaging examination, with the fracture site marked (orange arrow).
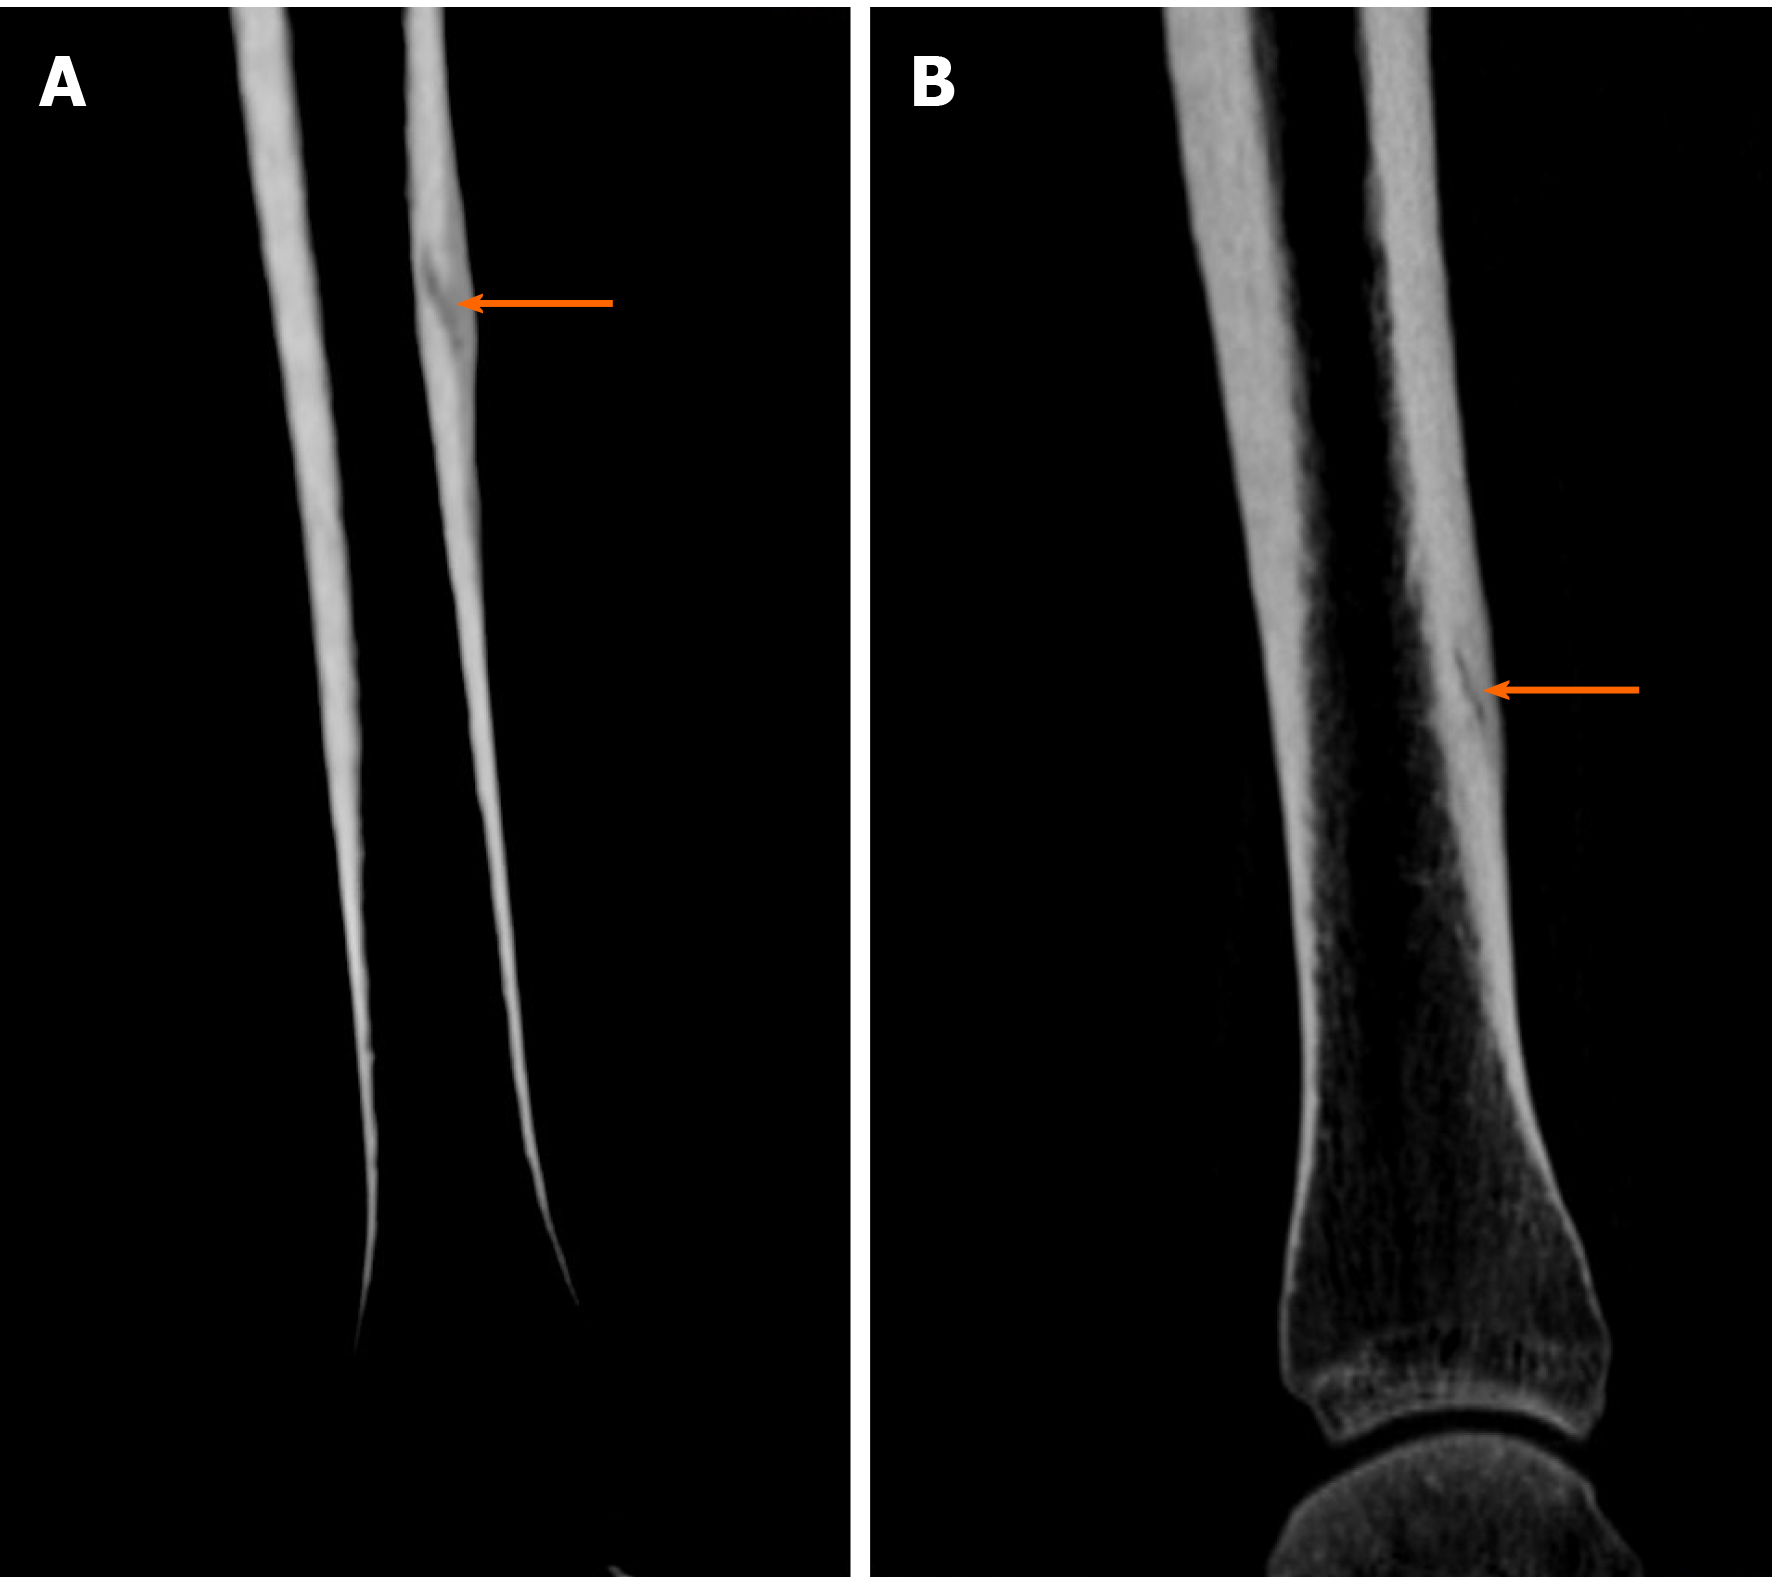
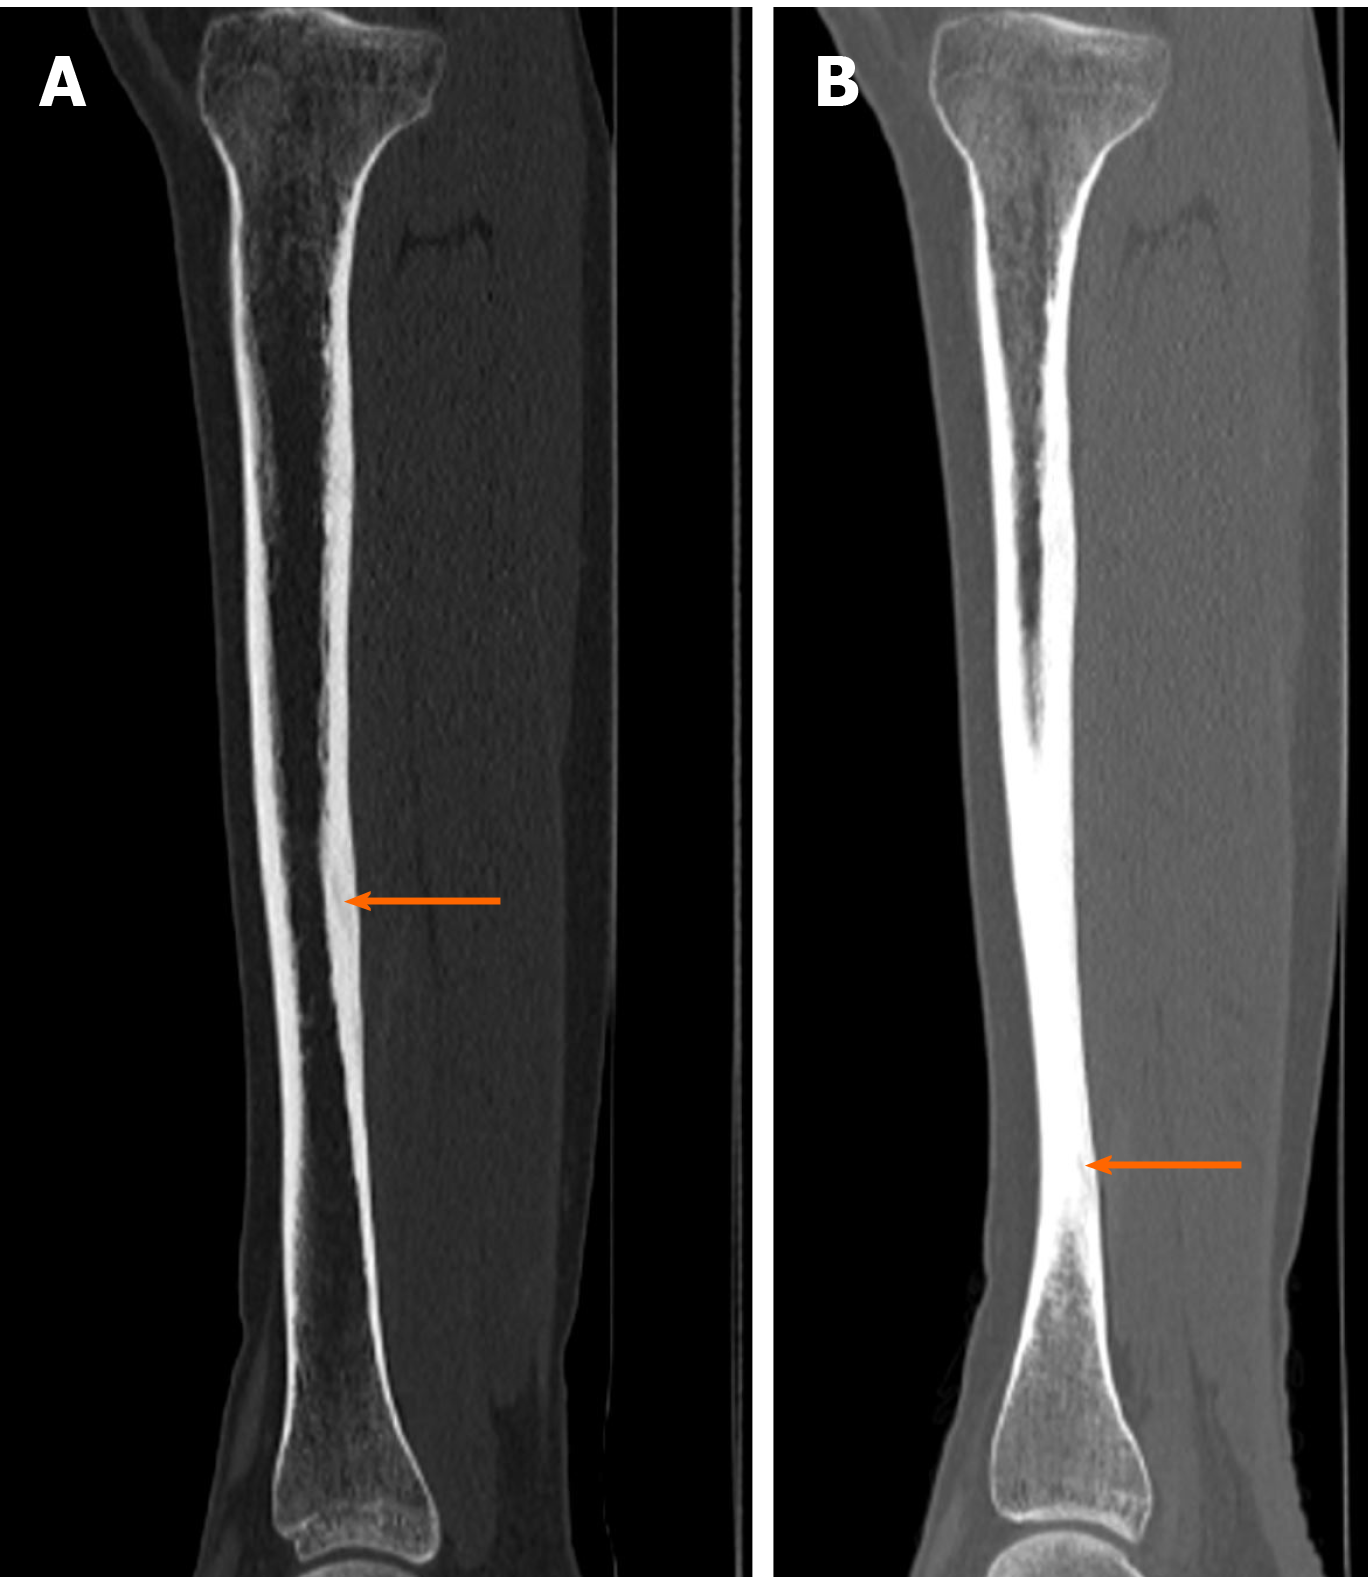
Figure 5 Diagnostic images from the computed tomography examination.
A: Right tibia; B: Left tibia, with the fracture site marked (orange arrow).
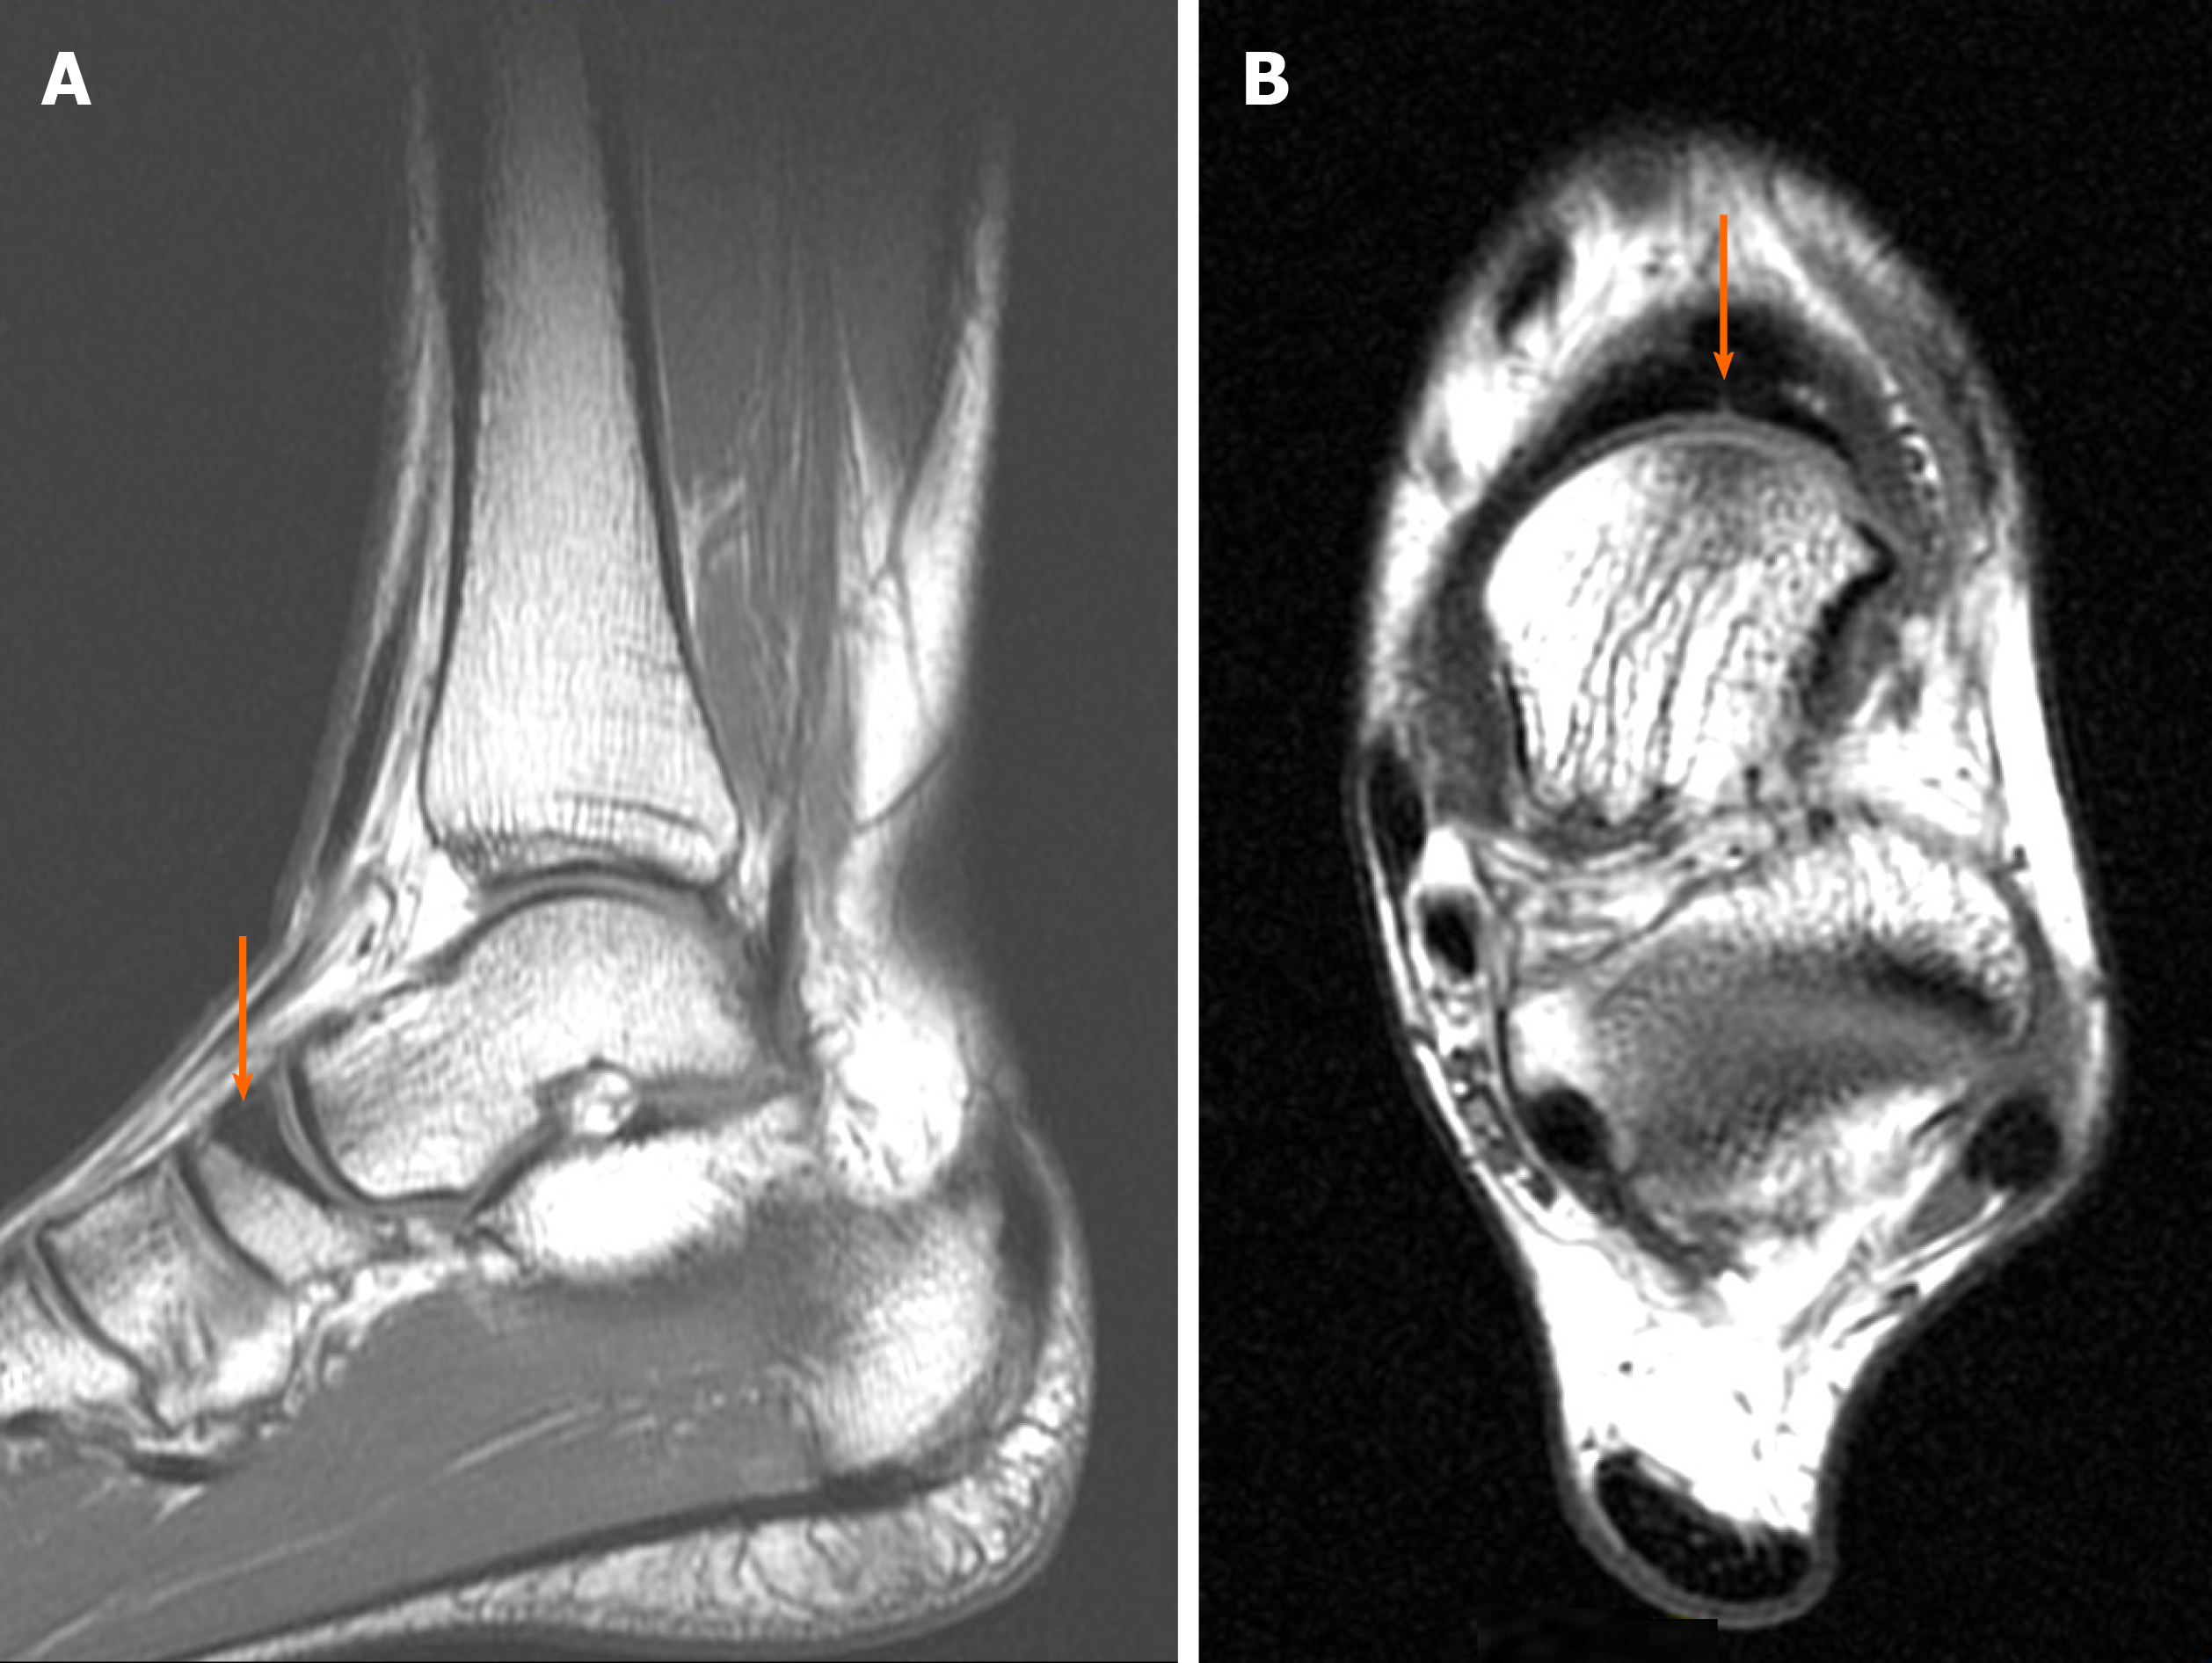
Figure 6 Magnetic resonance imaging diagnostic images of the left ankle.
A: Saggital T1-weighted image: bone sclerosis is indicated by the orange arrow; B: Axial T1-weighted image: the small crack is indicated by the orange arrow.
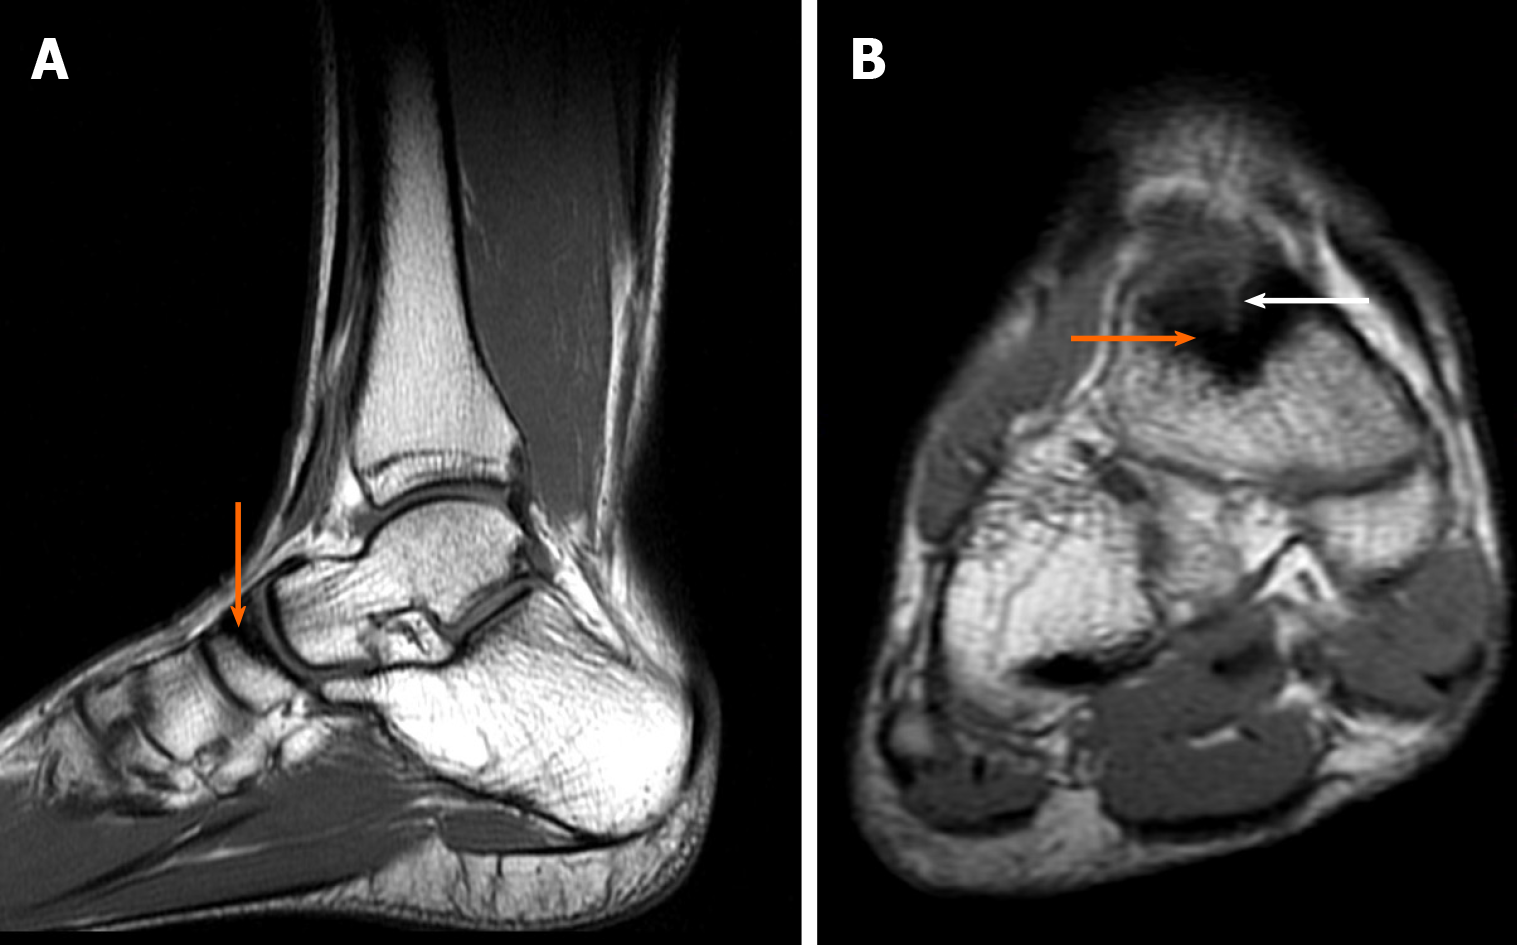
Figure 7 Magnetic resonance imaging diagnostic images of the right ankle.
A: Saggital T1-weighted image: bone sclerosis is indicated by the orange arrow; B: Coronal T1: bone sclerosis (orange arrow) and cleft of the fracture are indicated by the white arrow.
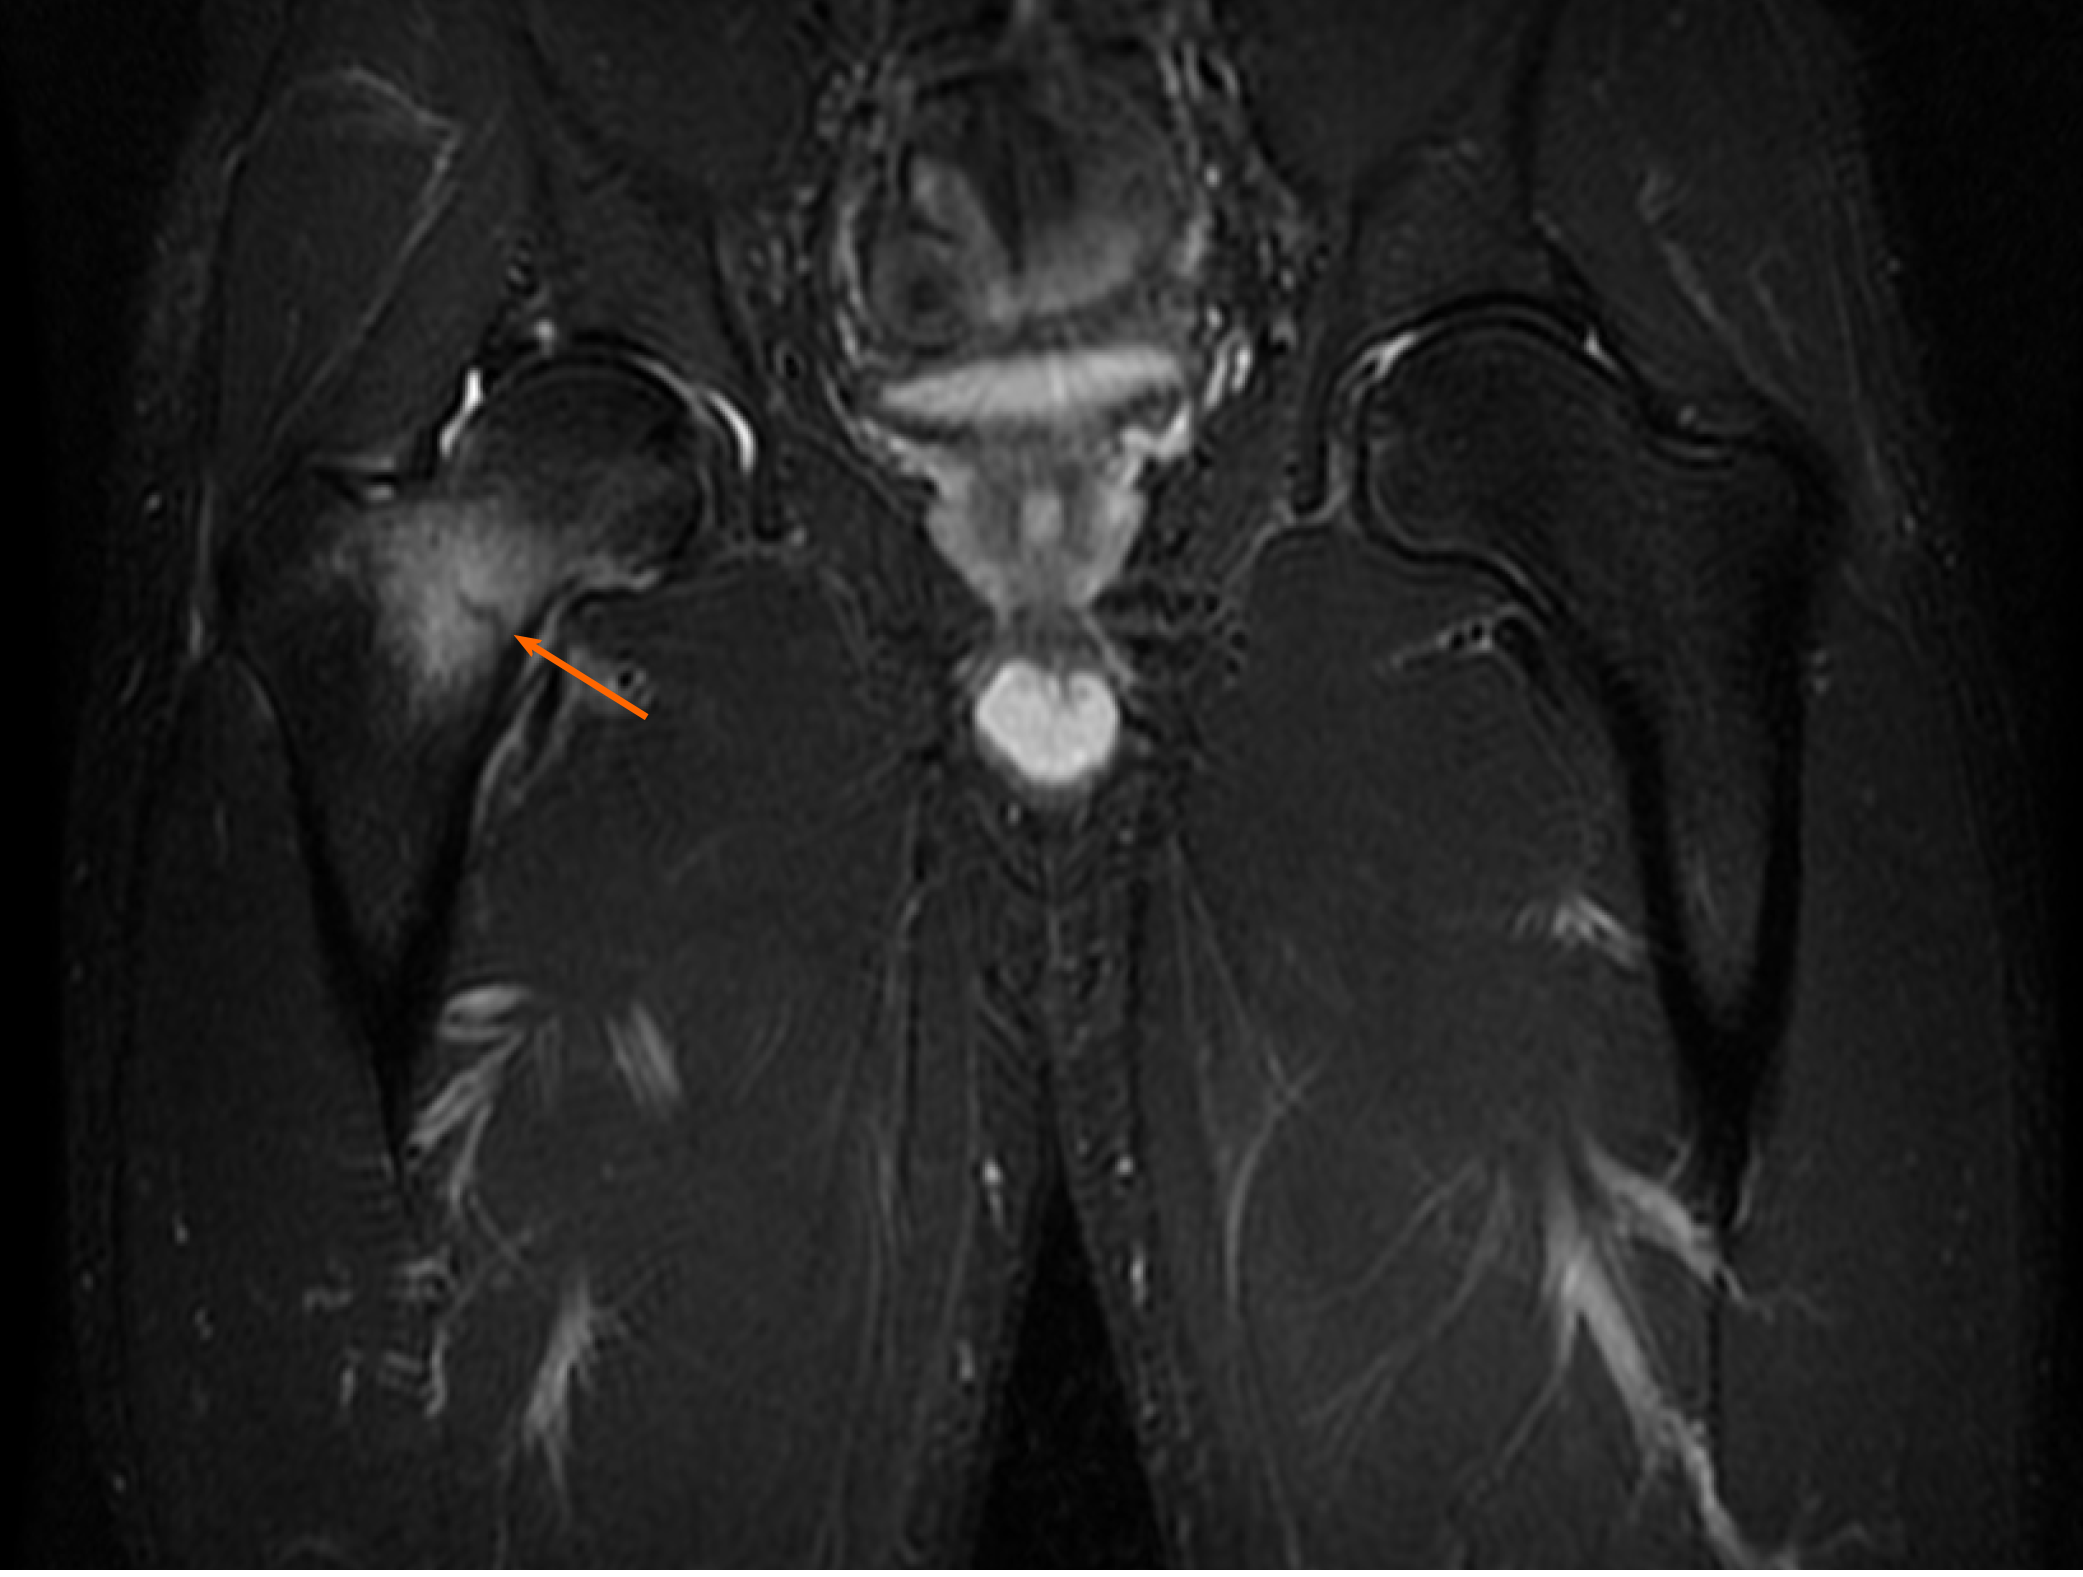
Figure 8 Diagnostic images from the magnetic resonance imaging examination.
Coronal short T1 inversion recovery sequence. Edema and the fracture cleft are indicated by the orange arrow.
Figure 9 Diagnostic images from the magnetic resonance imaging examination from the control visit.
A: T1-weighted sagittal fast spin echo cross-section of the left foot; B: T2-weighted axial FSE cross-section, with the fracture site marked (orange arrow).
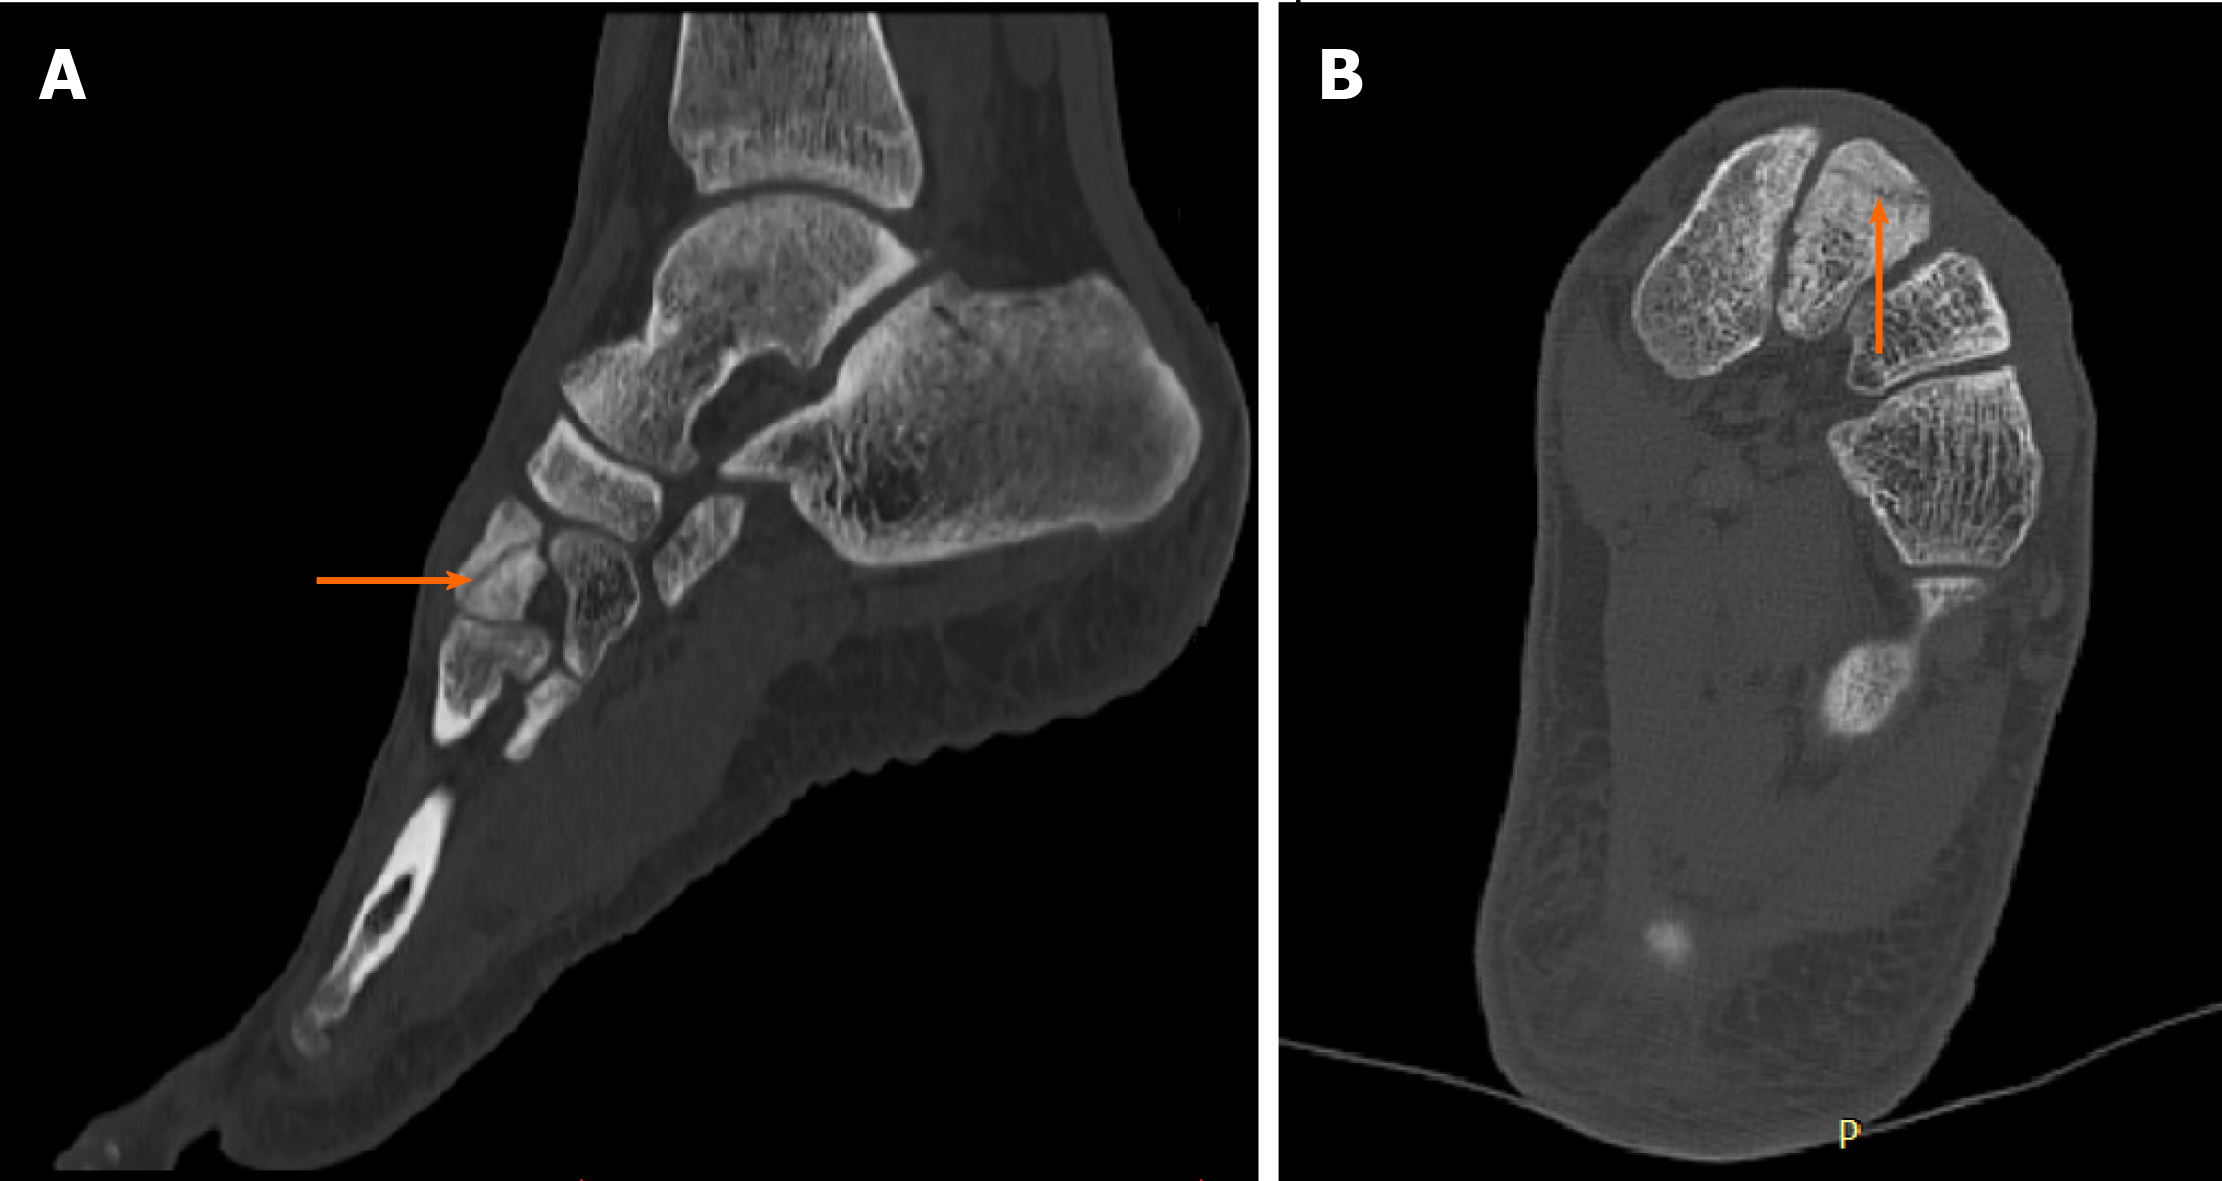
Figure 10 Diagnostic images from the computed tomography examination from the first control visit.
A: Sagittal multiplanar reconstruction; B: Axial multiplanar reconstruction image with the fracture site marked (orange arrow).
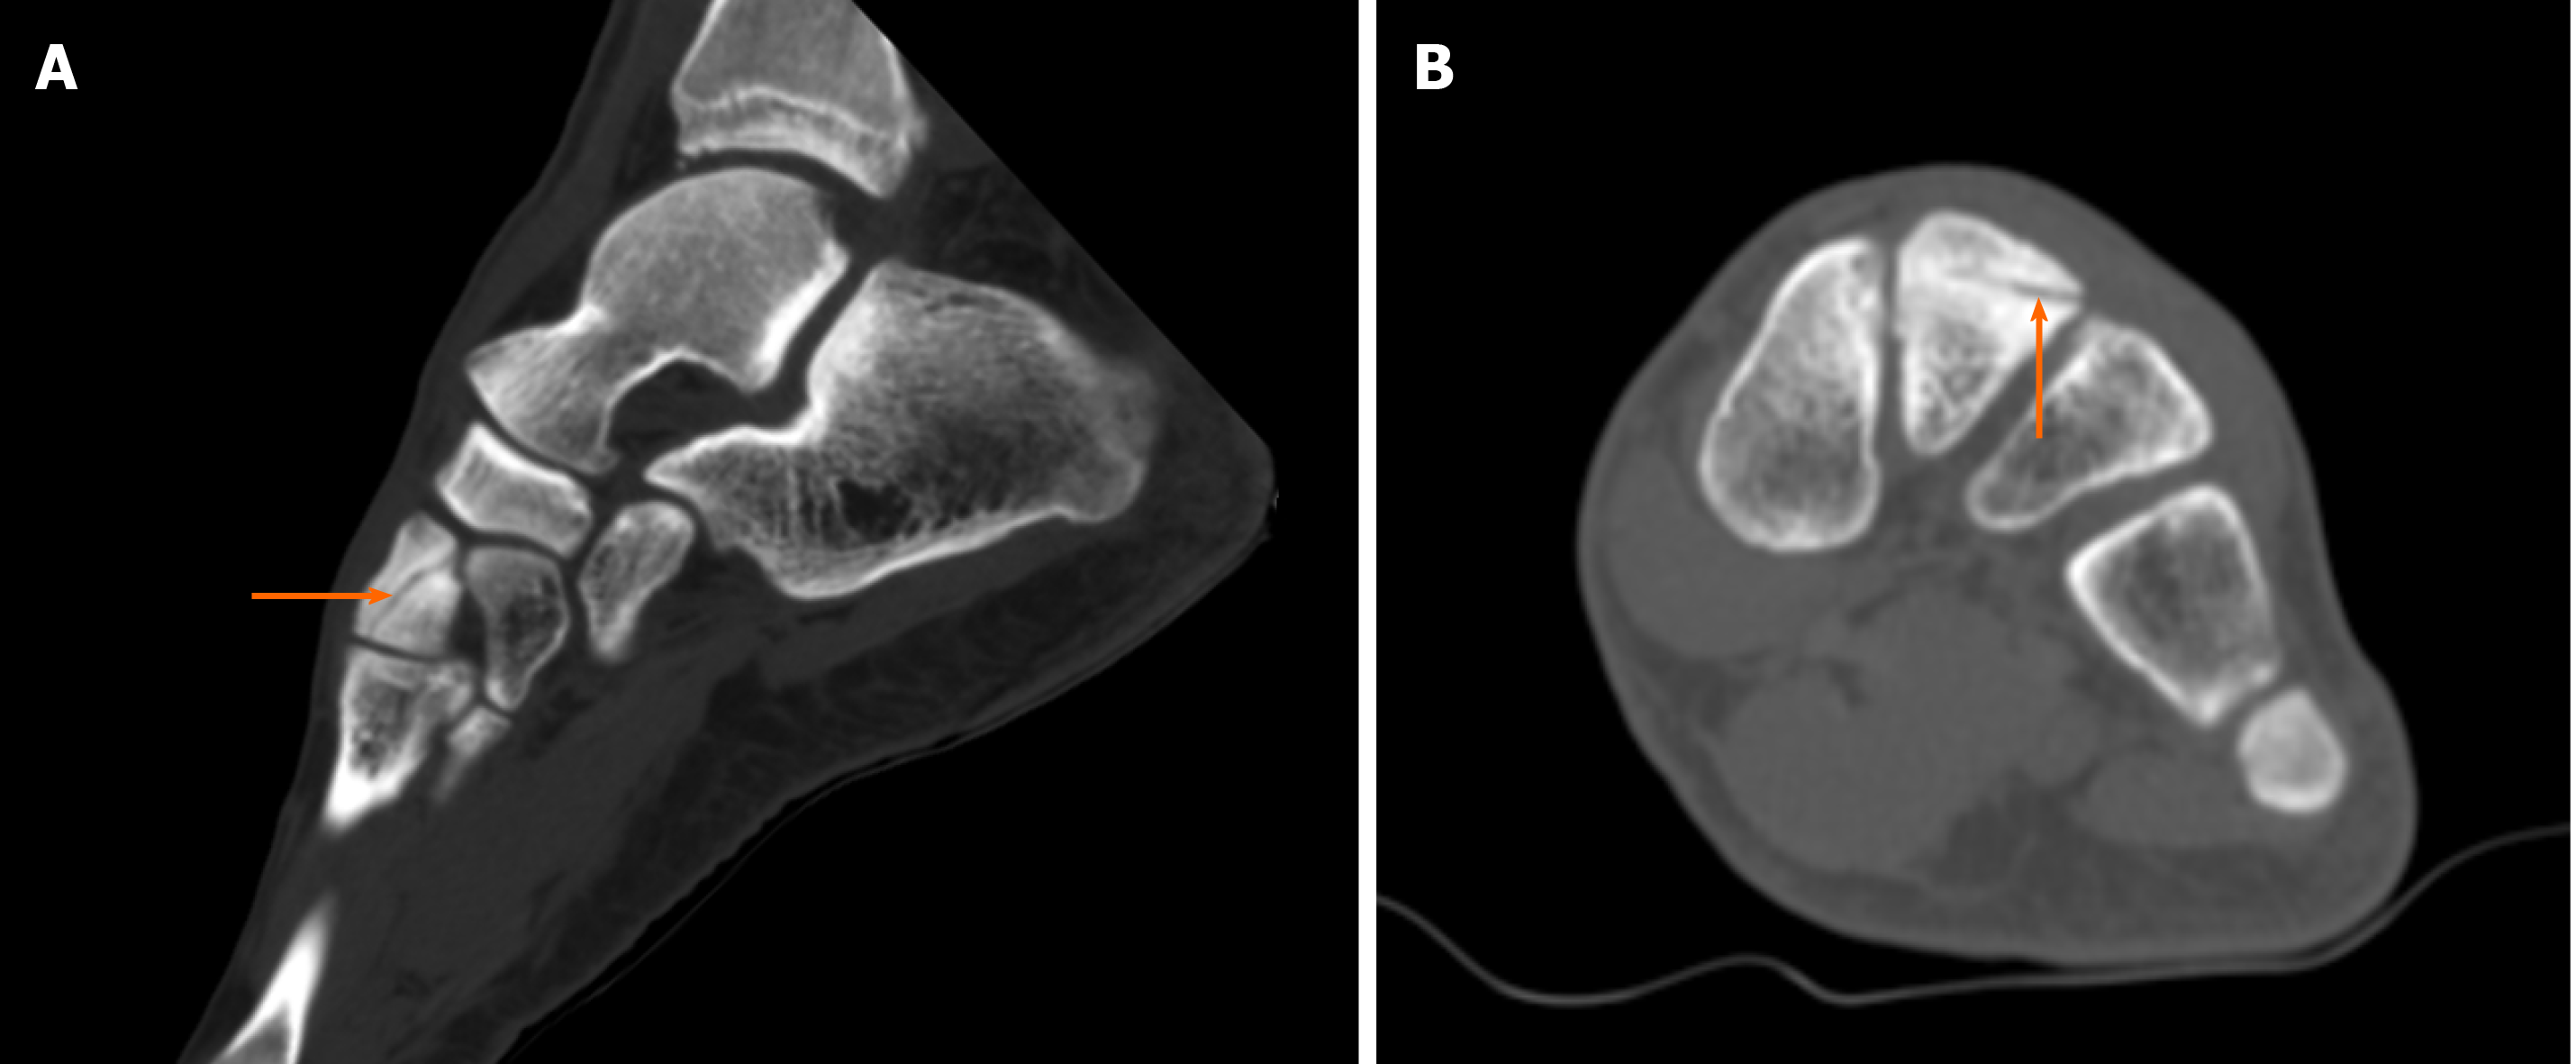
Figure 11 Diagnostic images from the computed tomography examination from the second control visit.
A: Sagittal multiplanar reconstruction; B: Axial multiplanar reconstruction image with the fracture site marked (orange arrow).
Figure 12 Diagnostic images from the control computed tomography examination after 5 mo.
A: right tibia; B: left tibia, with the fracture site marked (orange arrow).
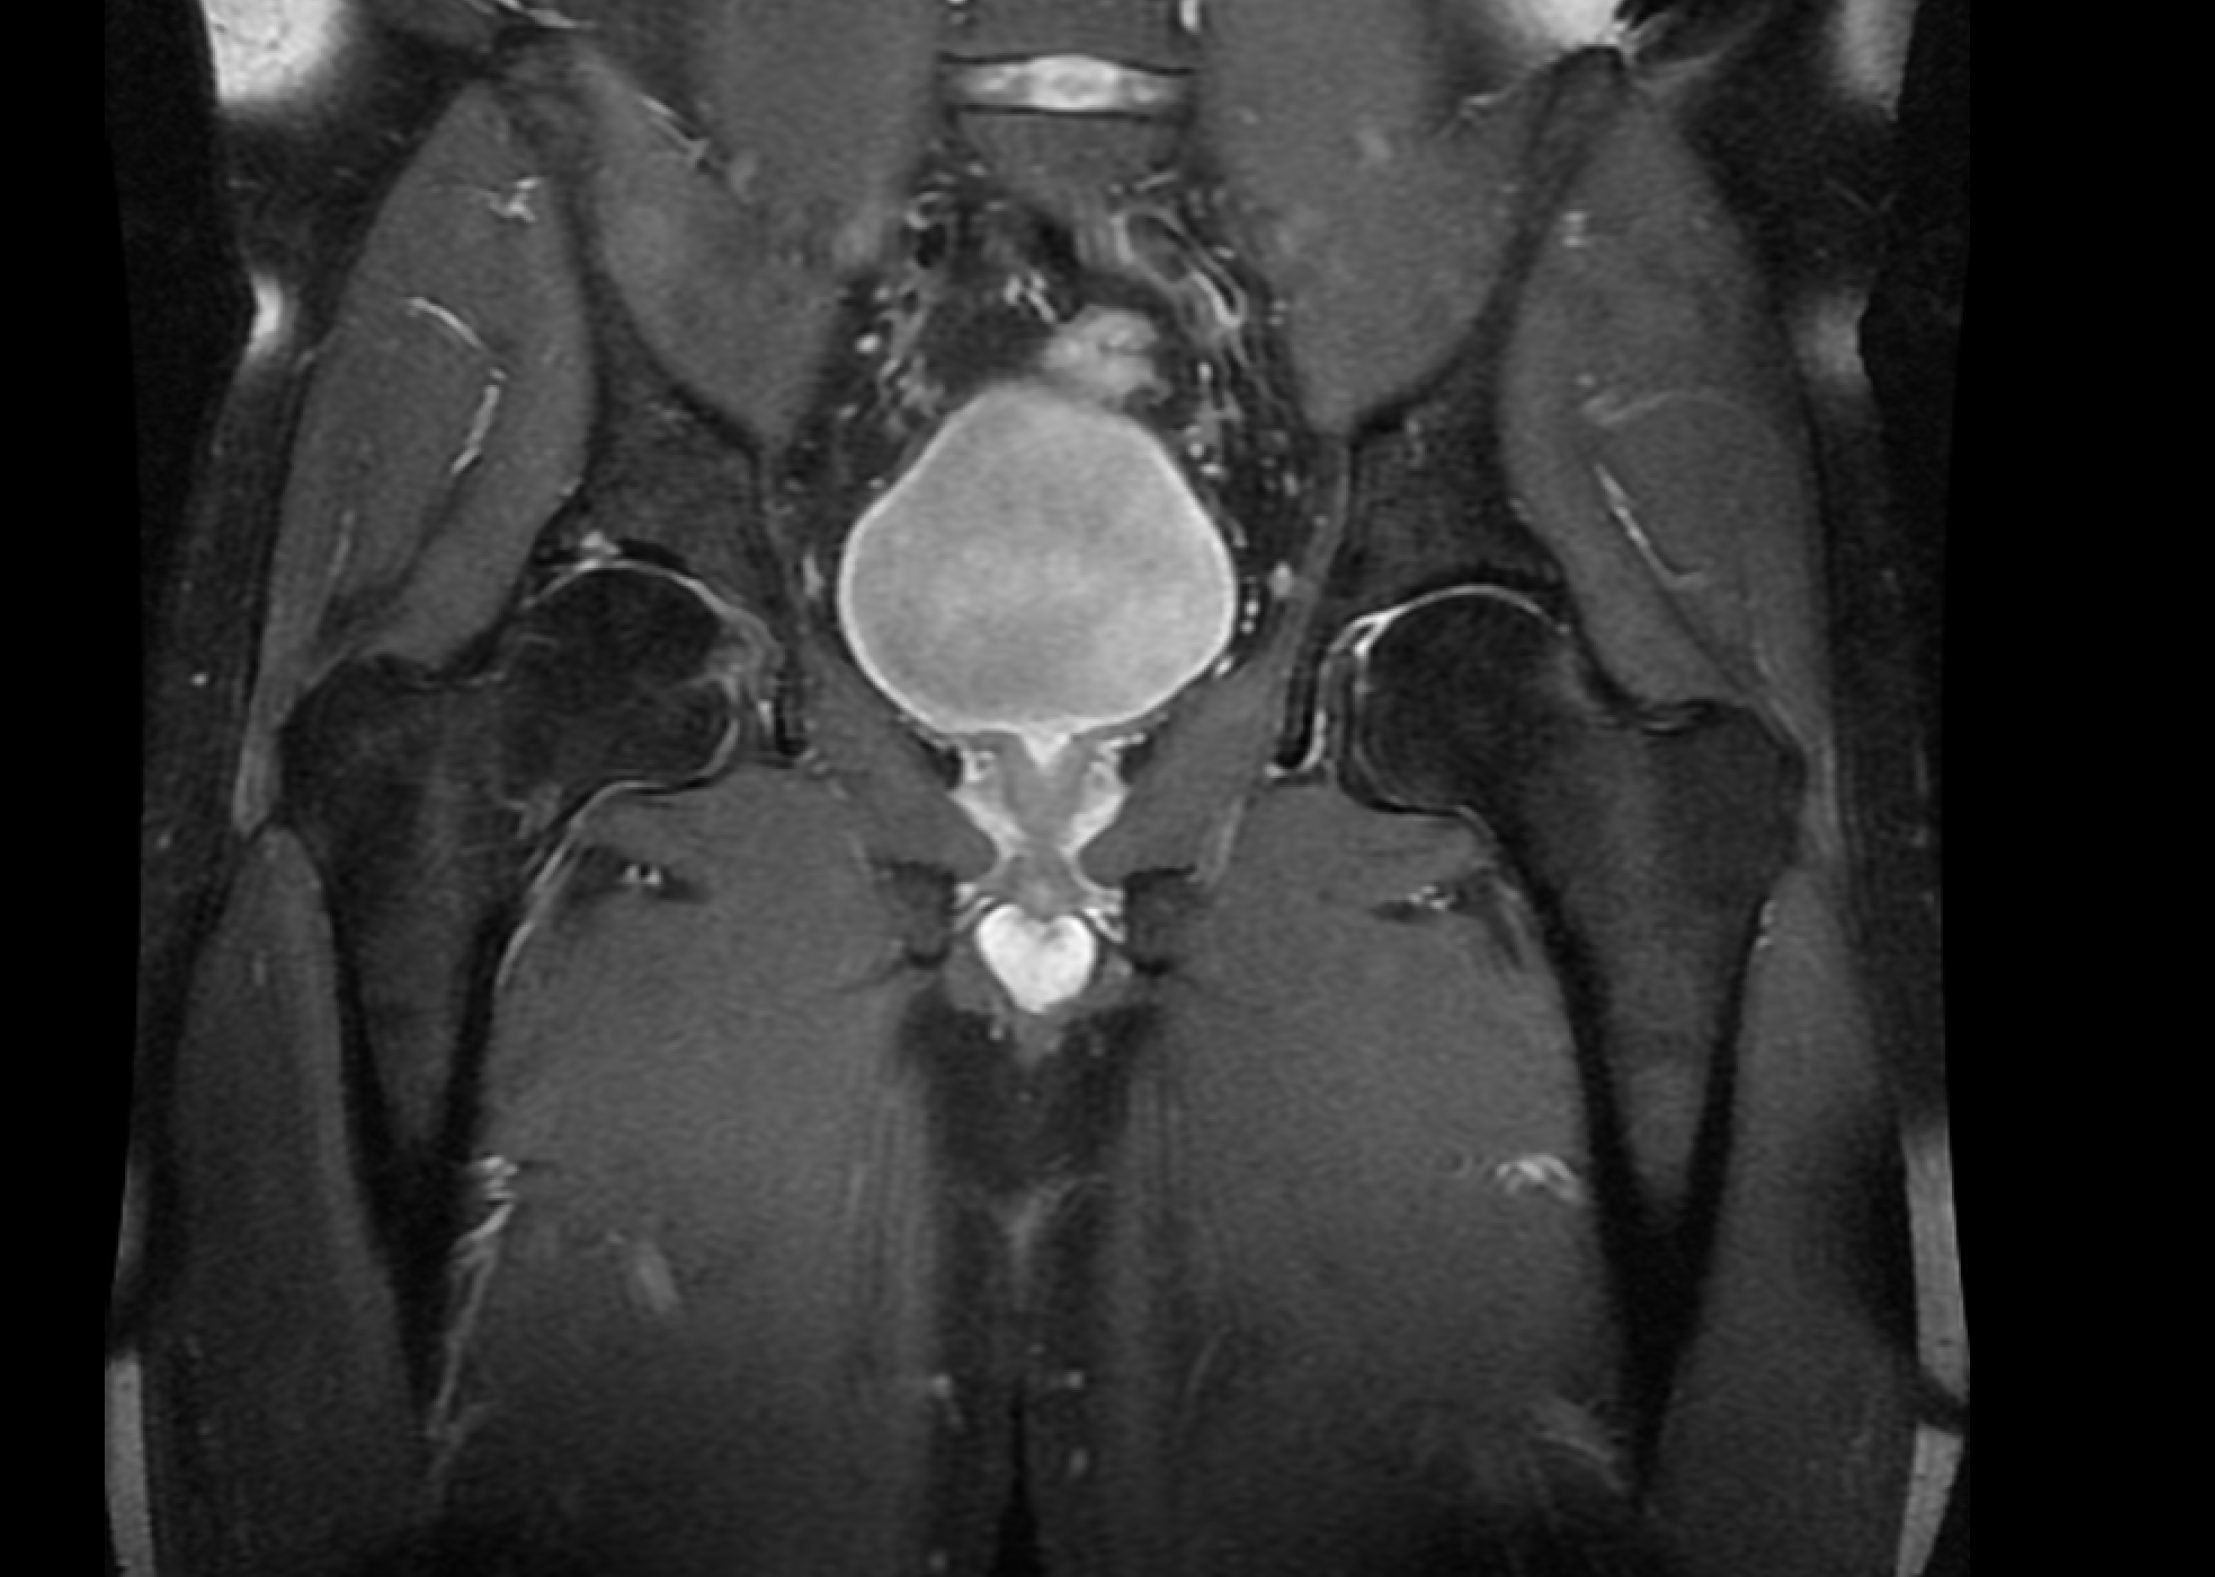
Figure 13 Control magnetic resonance imaging scan of the right hip.
Coronal proton density fat-suppressed sequence.
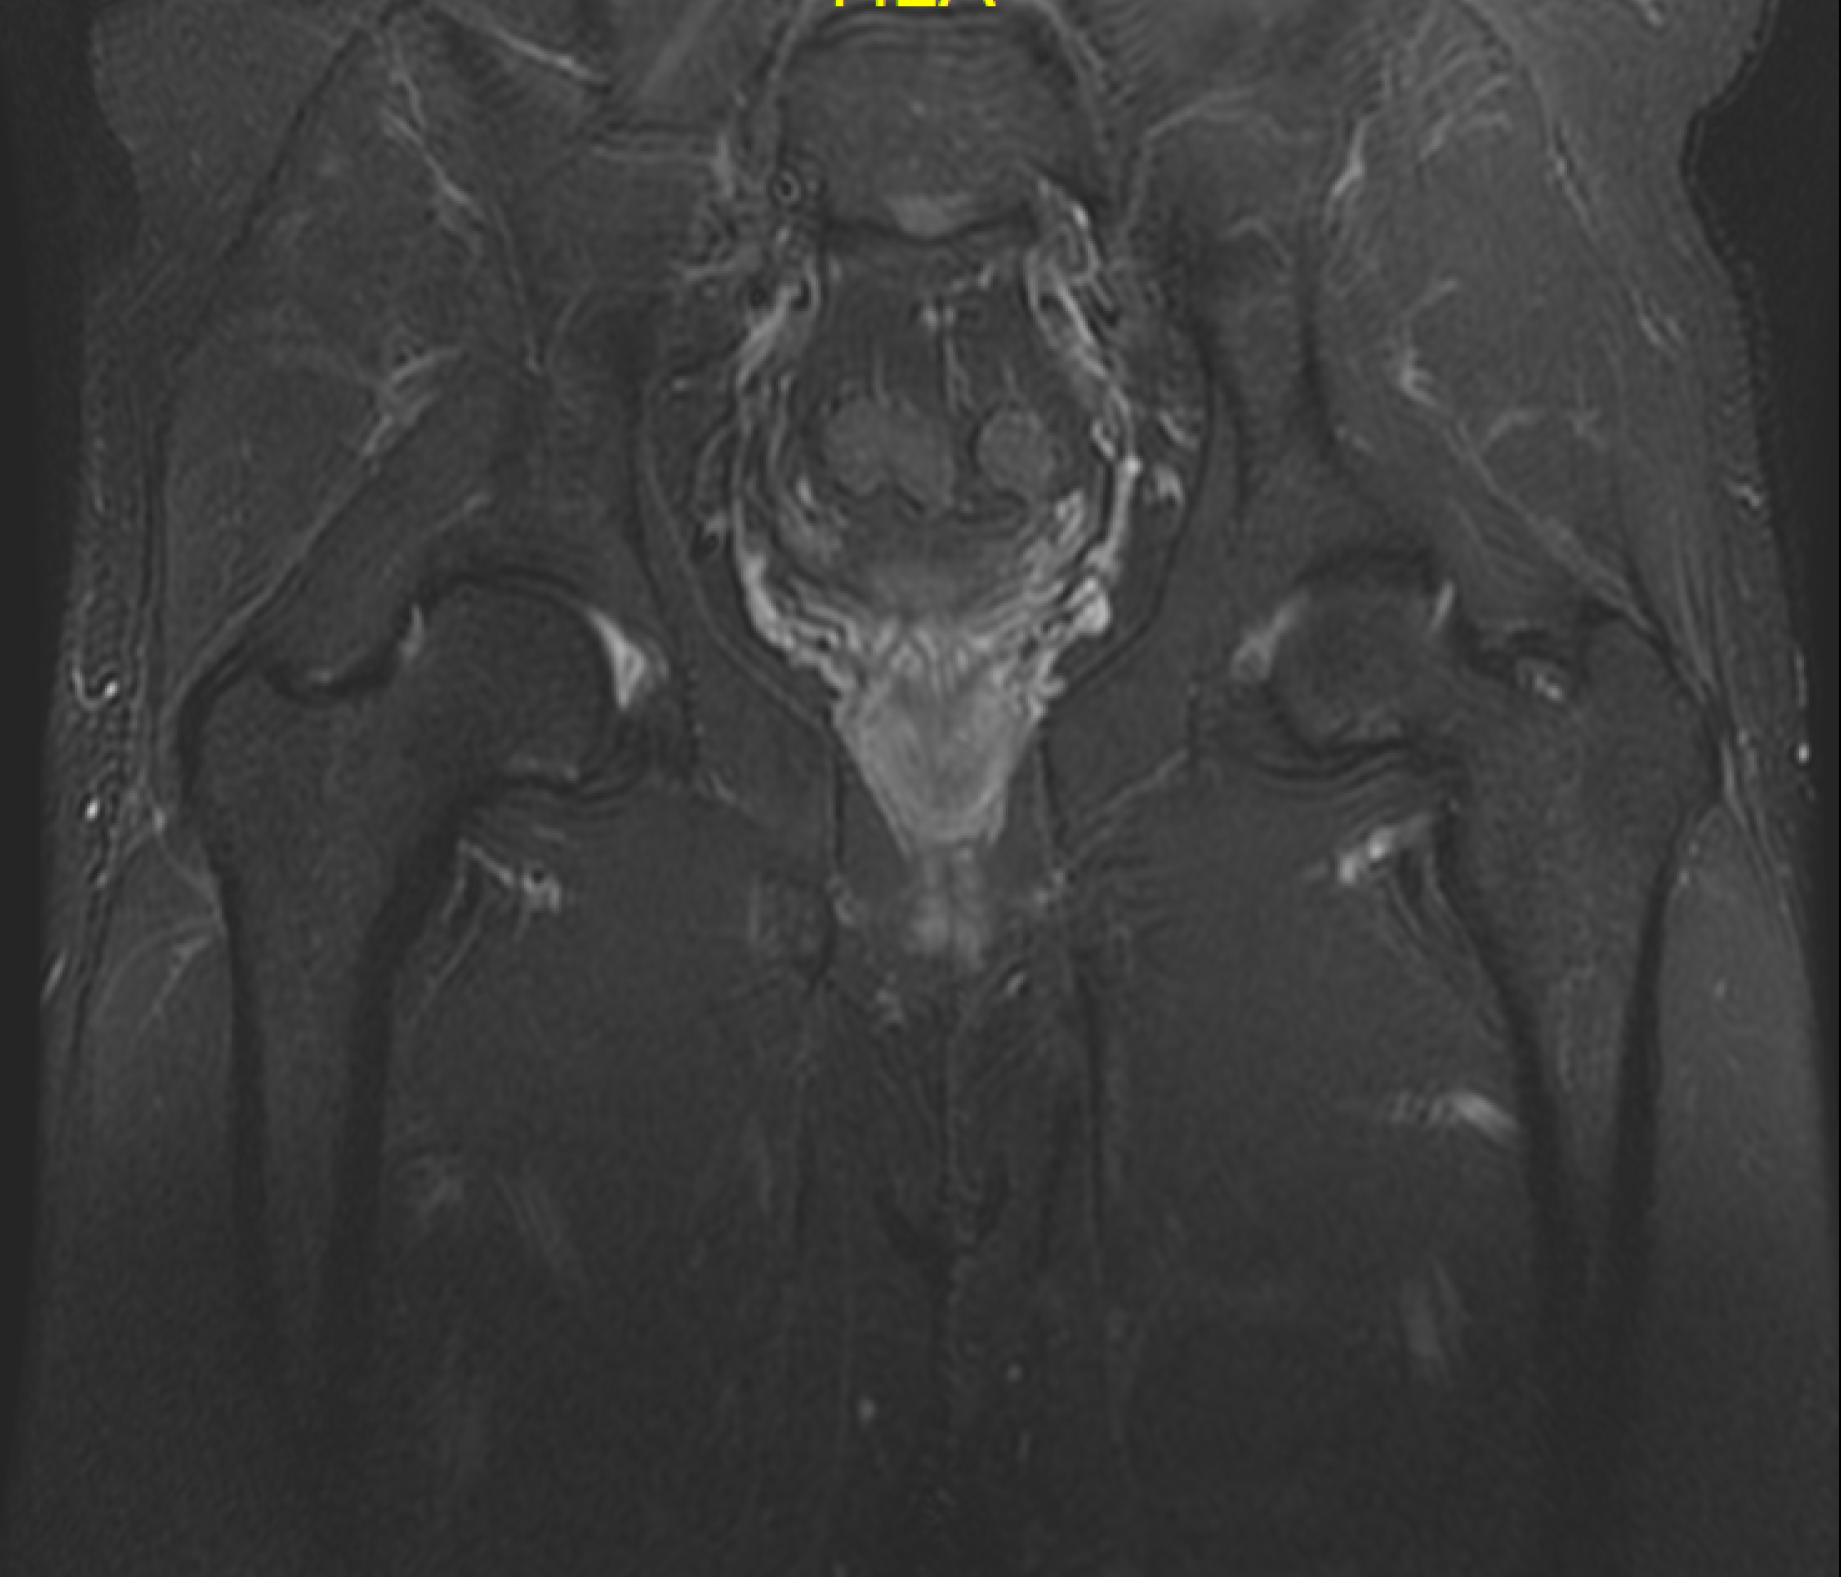
Figure 14 Control magnetic resonance imaging scan of the right hip.
Coronal short T1 inversion recovery sequence.
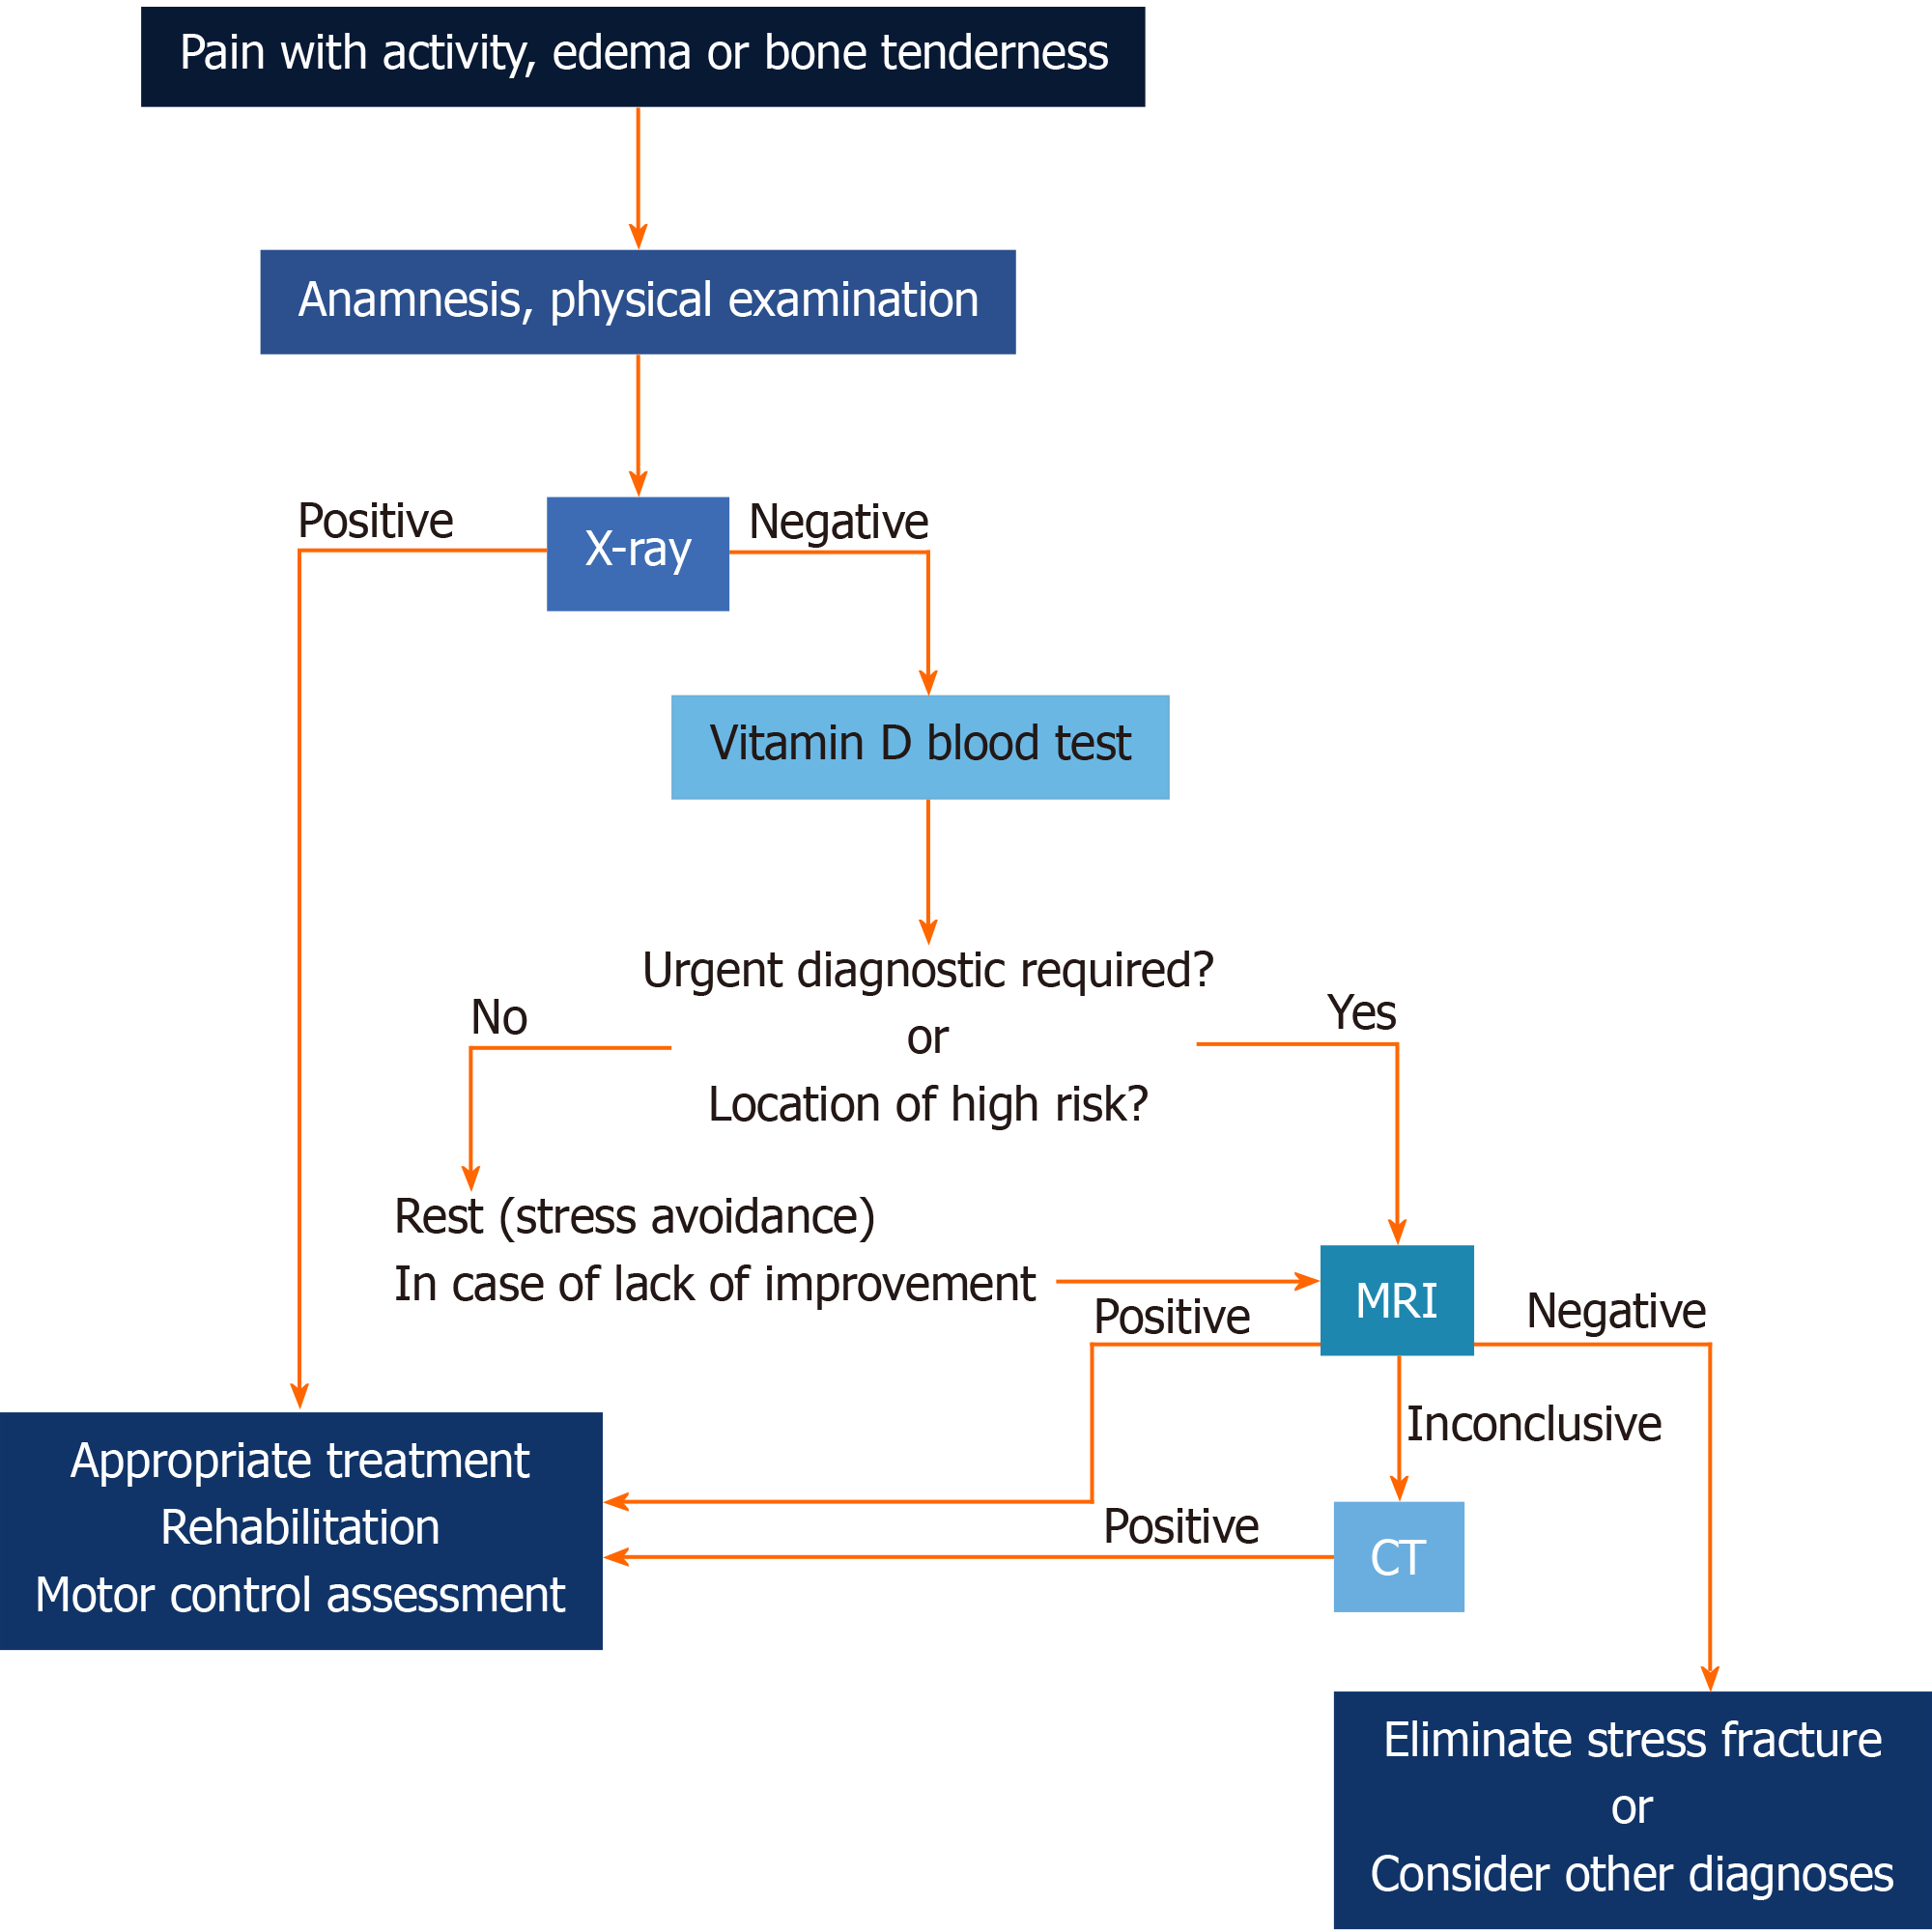
Figure 15 Diagnostic algorithm.
CT: Computed tomography.
- Citation: Ficek K, Cyganik P, Rajca J, Racut A, Kiełtyka A, Grzywocz J, Hajduk G. Stress fractures in uncommon location: Six case reports and review of the literature. World J Clin Cases 2020; 8(18): 4135-4150
- URL: https://www.wjgnet.com/2307-8960/full/v8/i18/4135.htm
- DOI: https://dx.doi.org/10.12998/wjcc.v8.i18.4135


