Copyright
©The Author(s) 2020.
World J Clin Cases. Aug 6, 2020; 8(15): 3355-3364
Published online Aug 6, 2020. doi: 10.12998/wjcc.v8.i15.3355
Published online Aug 6, 2020. doi: 10.12998/wjcc.v8.i15.3355
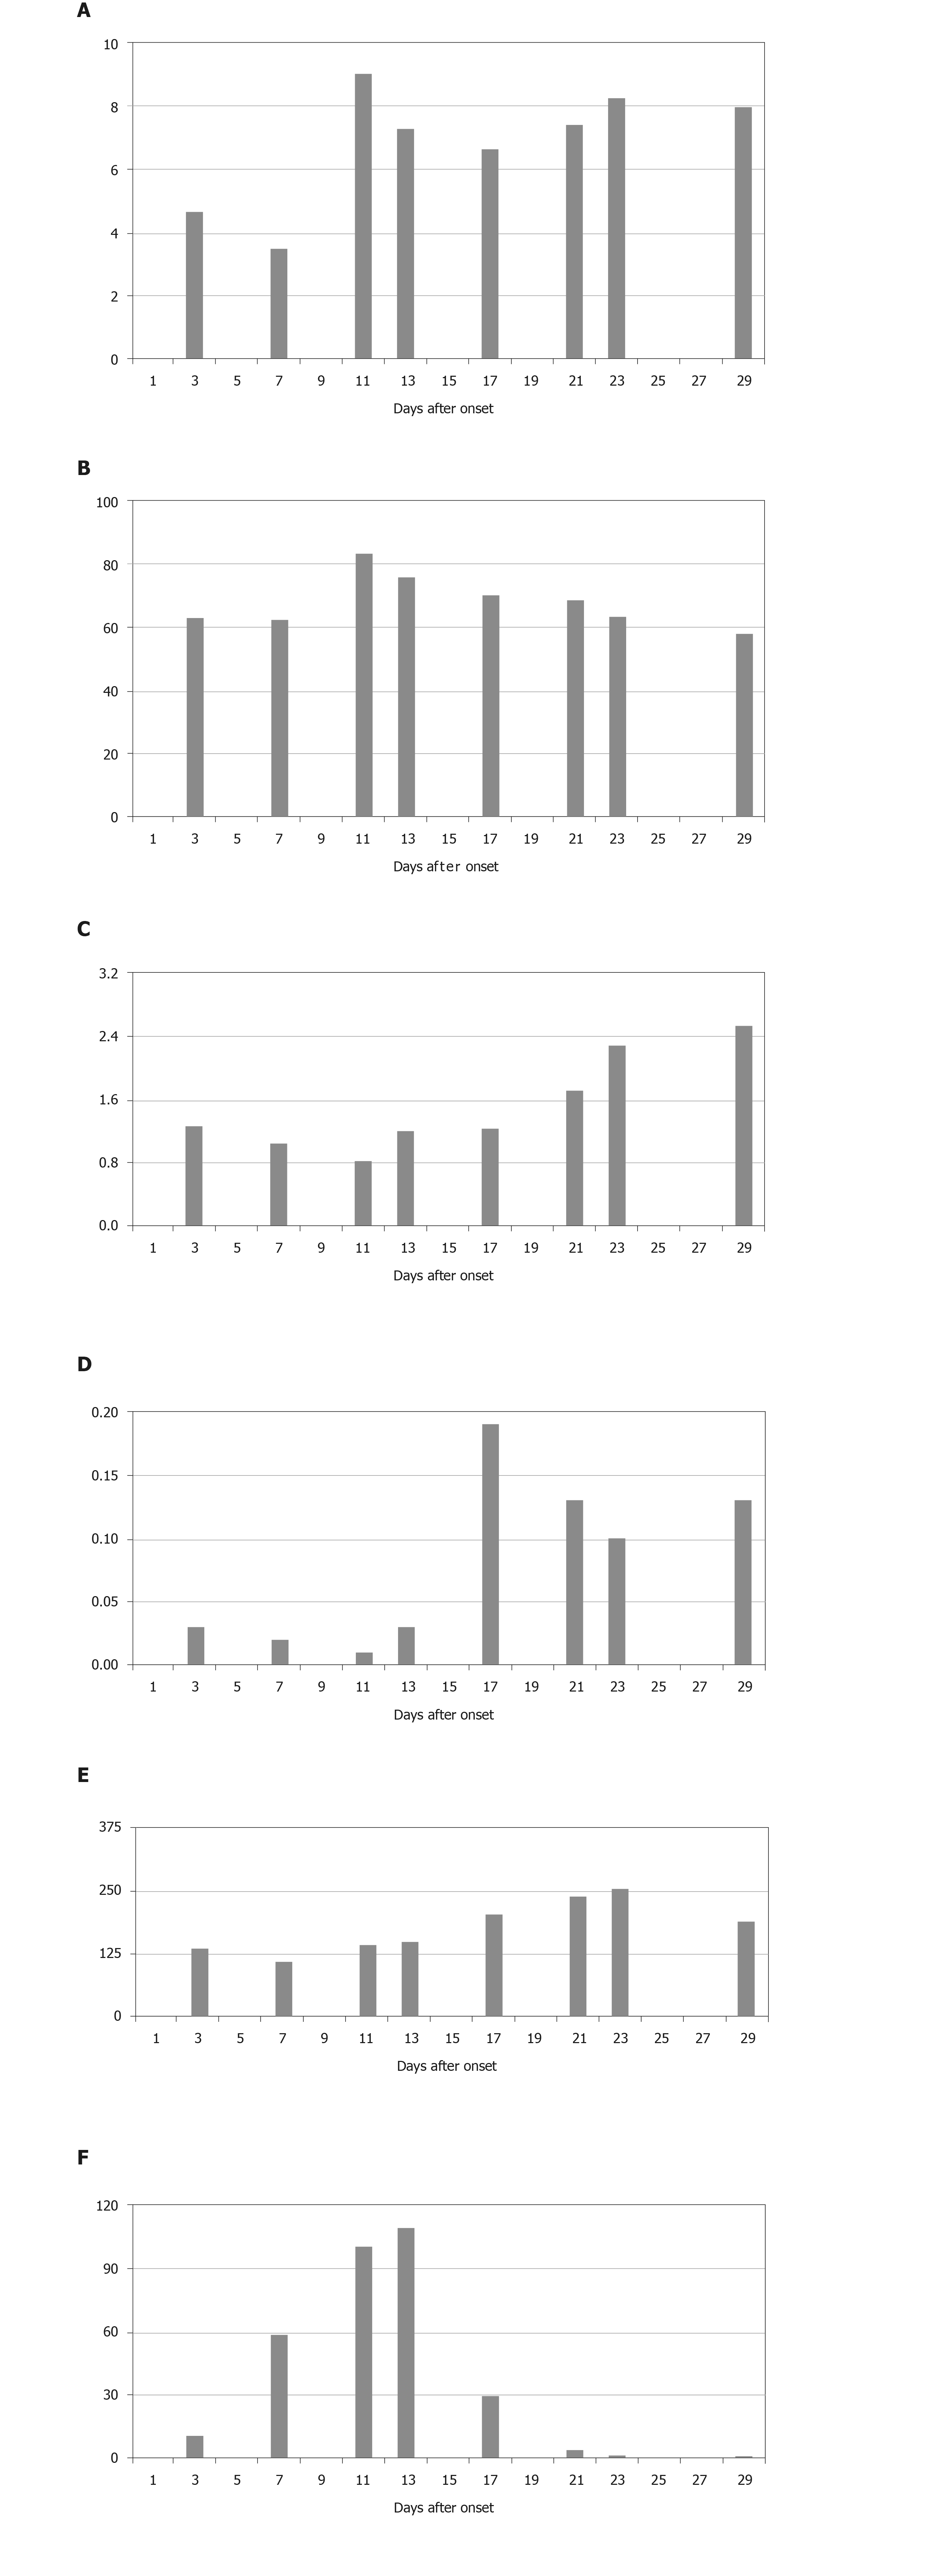
Figure 1 Dynamic profile of laboratory parameters in a 48-year-old male with coronavirus disease 2019 and asthma.
A: White blood cell count (3.5 × 10⁹/L-9.5 × 109/L); B: Neutrophil rate (45%-77%); C: Lymphocyte count (0.8 × 10⁹/L-4 × 109/L); D: Eosinophil count (0.05 × 10⁹/L -0.5 × 10⁹/L); E: Platelet count (125 × 109/L-350 × 109/L); F: C-reactive protein (0-4 mg/L); G: Oxygenation index (400-500 mmHg); H: Albumin (38-55 g/L); I: Glutamic oxaloacetic transaminase (5-35 U/L); J: Lactate dehydrogenase (100-190 U/L); K: Fibrinogen (2-4 g/L); L: D-Dimer (0-0.5 mg/L).
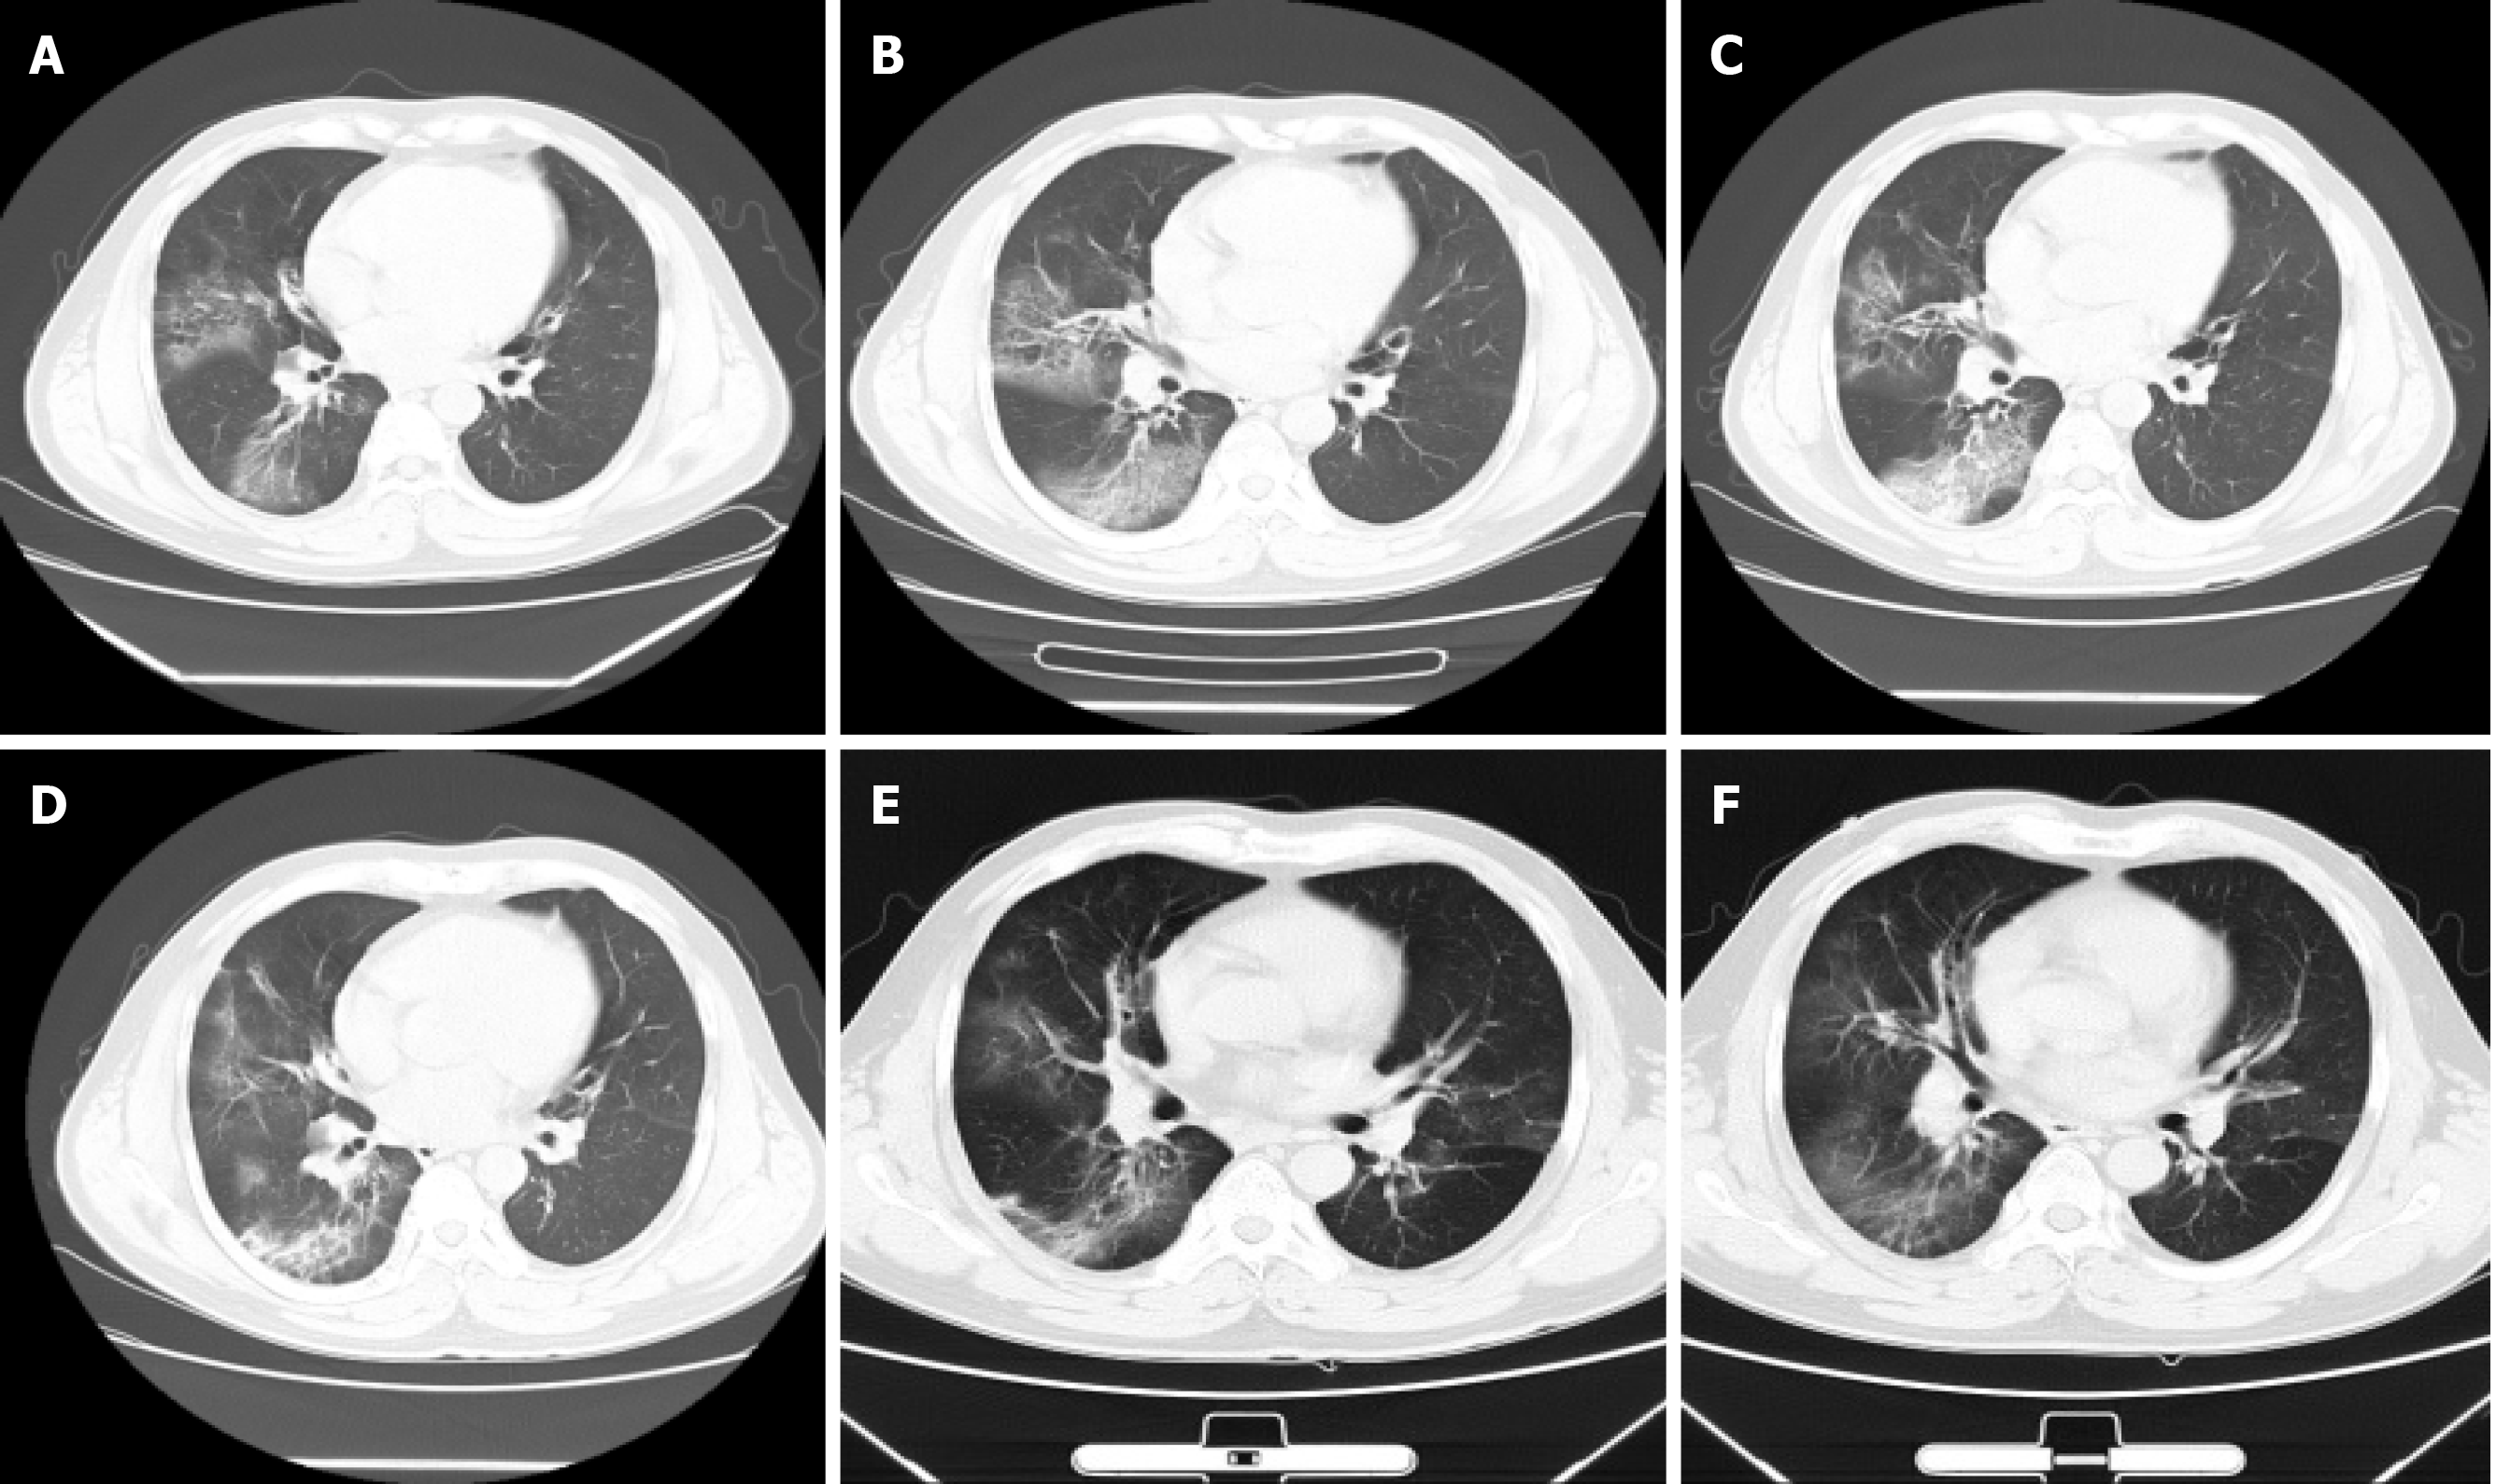
Figure 2 Chest computed tomography images of a 48-year-old male with coronavirus disease 2019 and asthma showing dynamic changes of lesions.
A: Computed tomography (CT) images on day 6 after symptom onset showing ground-glass opacity on right lung; B: CT images on day 8 after symptom onset. Lesion’s area expanded; C: CT images on day 13 after symptom onset. The density of lesions was higher than before; D: CT images on day 20 after symptom onset. Partial lesions had been absorbed; E: CT images on day 24 after symptom onset showing obvious absorption of lesions; F: CT images on day 30 after symptom onset. Most lesions had been absorbed, and some ground-glass opacity and fiber strip shadow left.
- Citation: Liu AL, Xu N, Li AJ. COVID-19 with asthma: A case report. World J Clin Cases 2020; 8(15): 3355-3364
- URL: https://www.wjgnet.com/2307-8960/full/v8/i15/3355.htm
- DOI: https://dx.doi.org/10.12998/wjcc.v8.i15.3355


