Copyright
©The Author(s) 2020.
World J Clin Cases. Jul 26, 2020; 8(14): 3000-3005
Published online Jul 26, 2020. doi: 10.12998/wjcc.v8.i14.3000
Published online Jul 26, 2020. doi: 10.12998/wjcc.v8.i14.3000
Figure 1 Electromyography of the orbicularis oculi muscle: A disposable concentric facial electromyography needle electrode was inserted into Horner’s muscle.
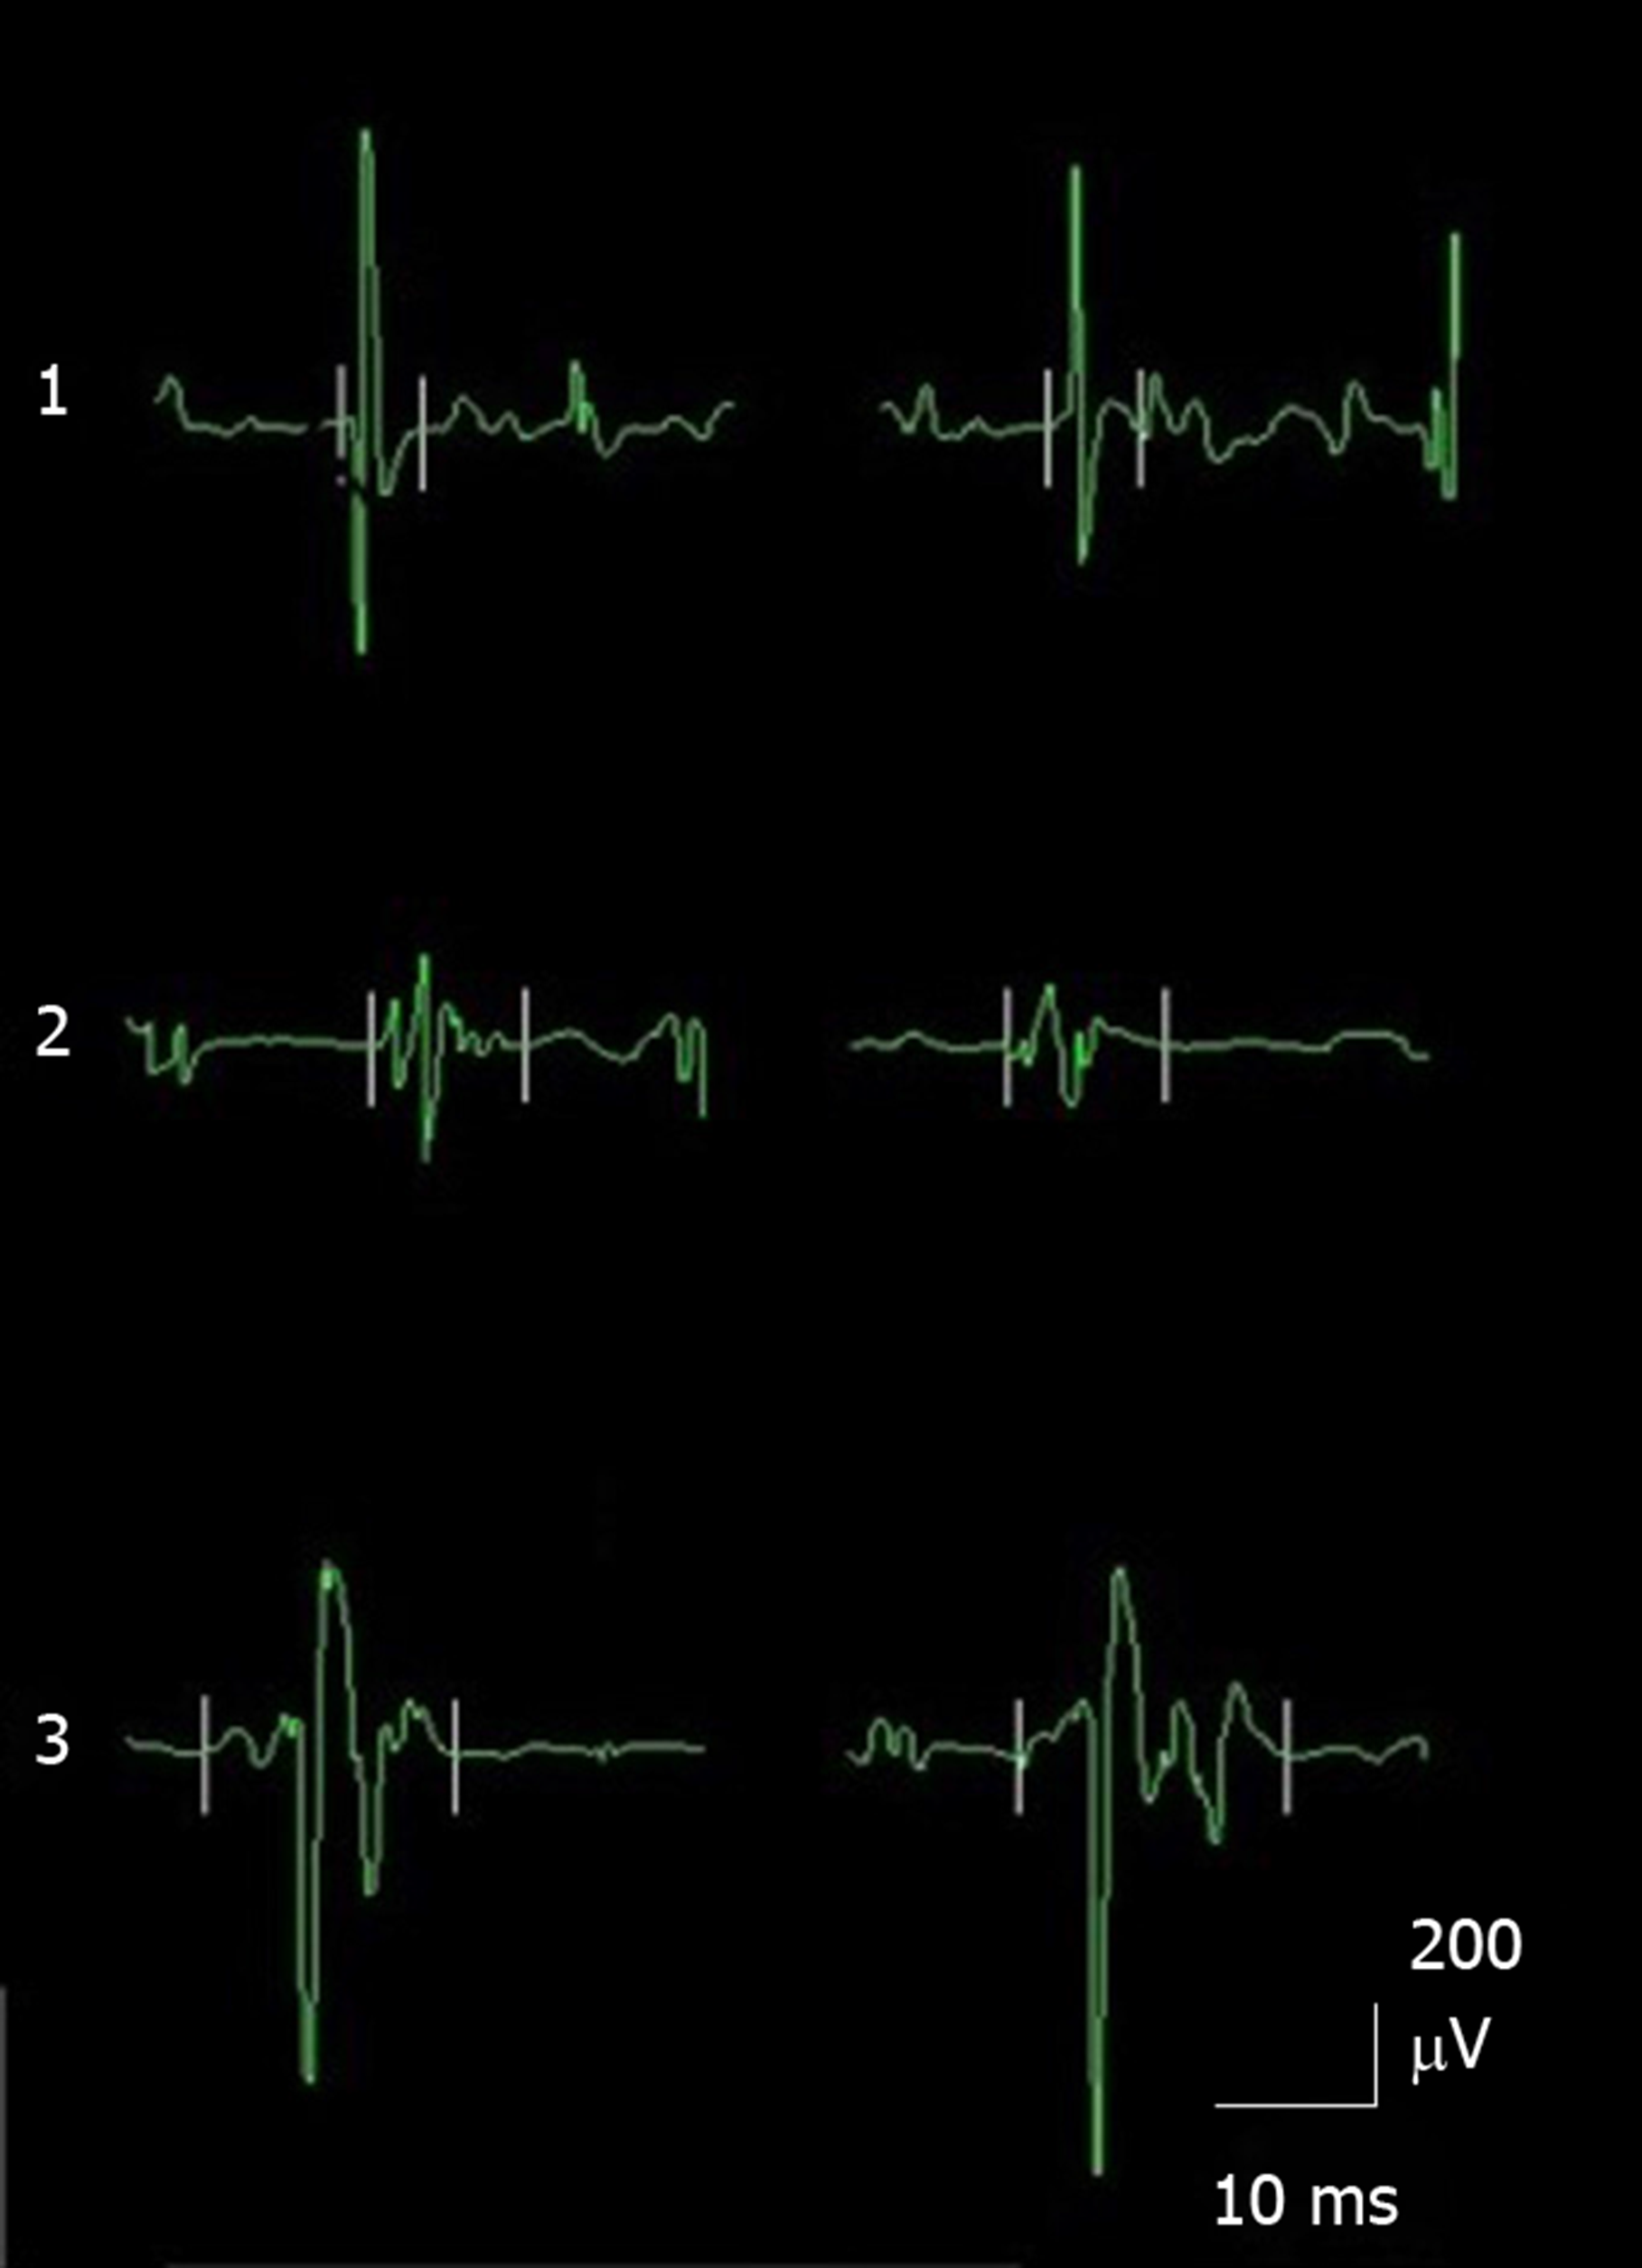
Figure 2 The electromyography waveforms in the subjects.
The time between the two vertical white bars is the duration of the electromyography waveform. 1: The normal control group; 2: The functional epiphora group; 3; The facial palsy group. The bar represents 10 ms.
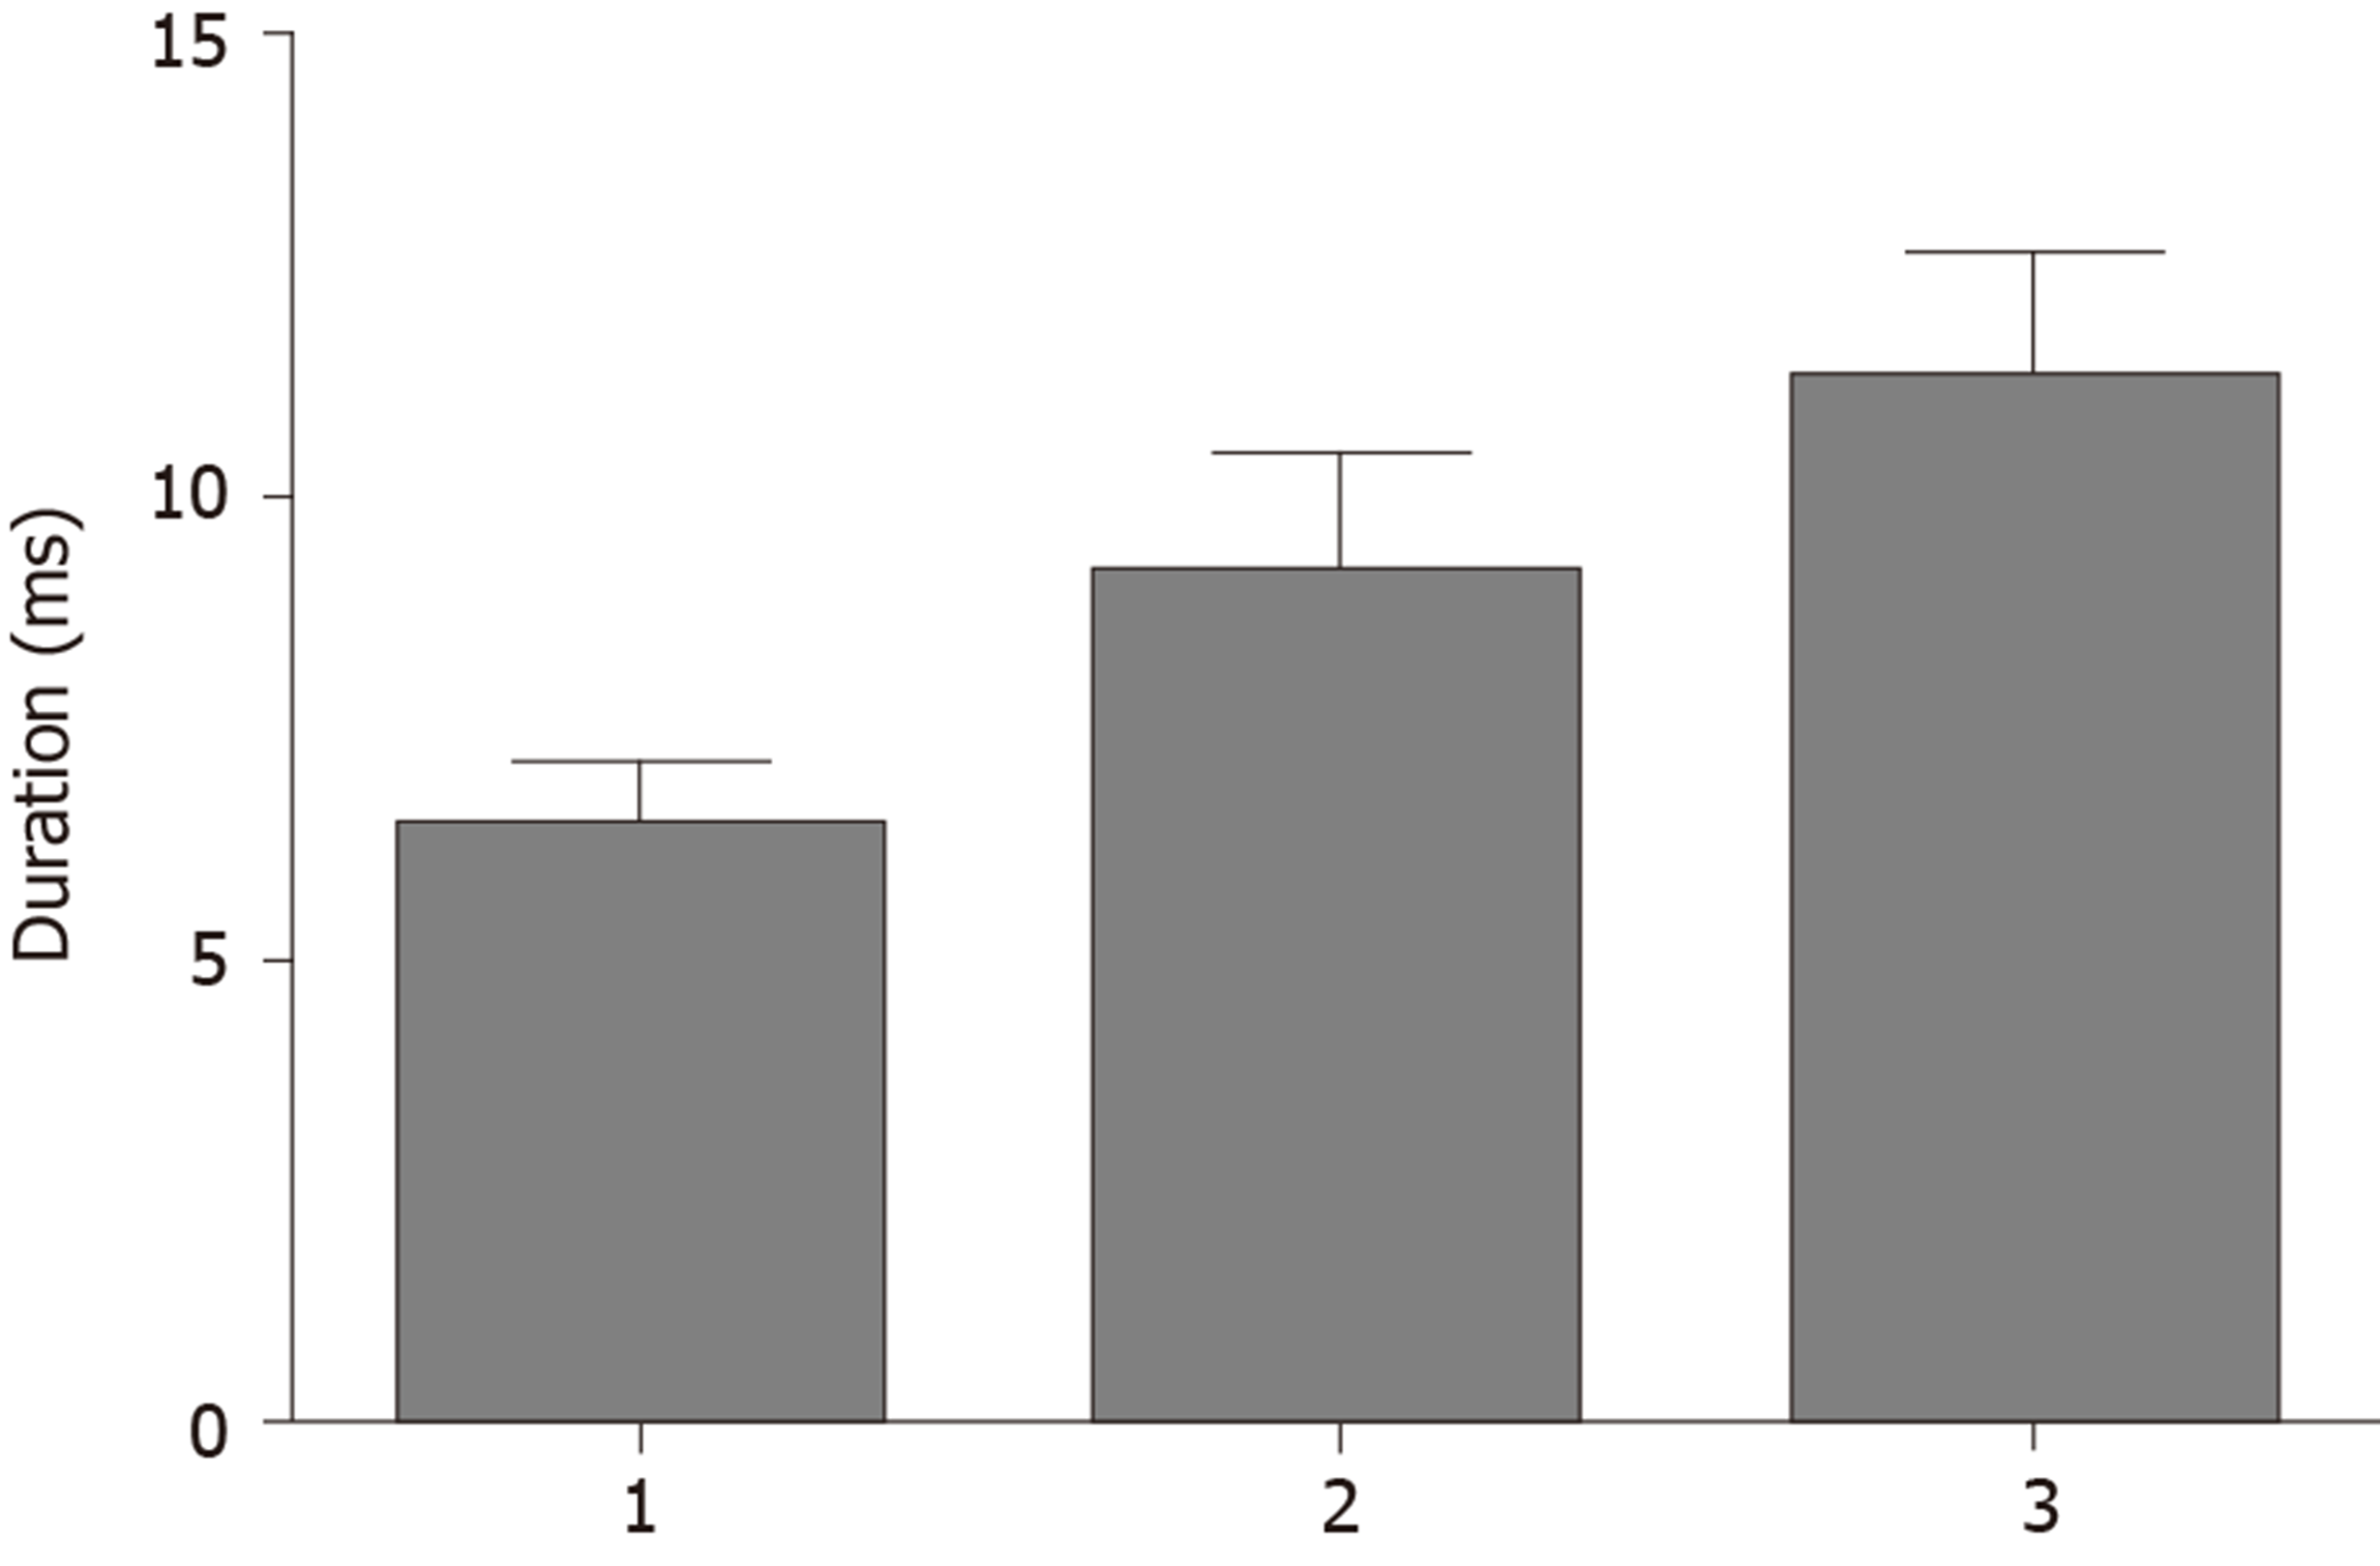
Figure 3 The duration of the electromyography waveform in the different groups.
The durations in group 2 and group 3 were significantly longer than that in group 1 (P < 0.05). 1: The normal control group; 2: The functional epiphora group; 3: The facial palsy group.
- Citation: Lu H, Liu PD, Yao X, Wang ZF, Gao LF, Wang SP. Diagnostic value of orbicularis oculi muscle electromyography in functional epiphora. World J Clin Cases 2020; 8(14): 3000-3005
- URL: https://www.wjgnet.com/2307-8960/full/v8/i14/3000.htm
- DOI: https://dx.doi.org/10.12998/wjcc.v8.i14.3000


