Copyright
©The Author(s) 2020.
World J Clin Cases. Jul 26, 2020; 8(14): 2977-2987
Published online Jul 26, 2020. doi: 10.12998/wjcc.v8.i14.2977
Published online Jul 26, 2020. doi: 10.12998/wjcc.v8.i14.2977
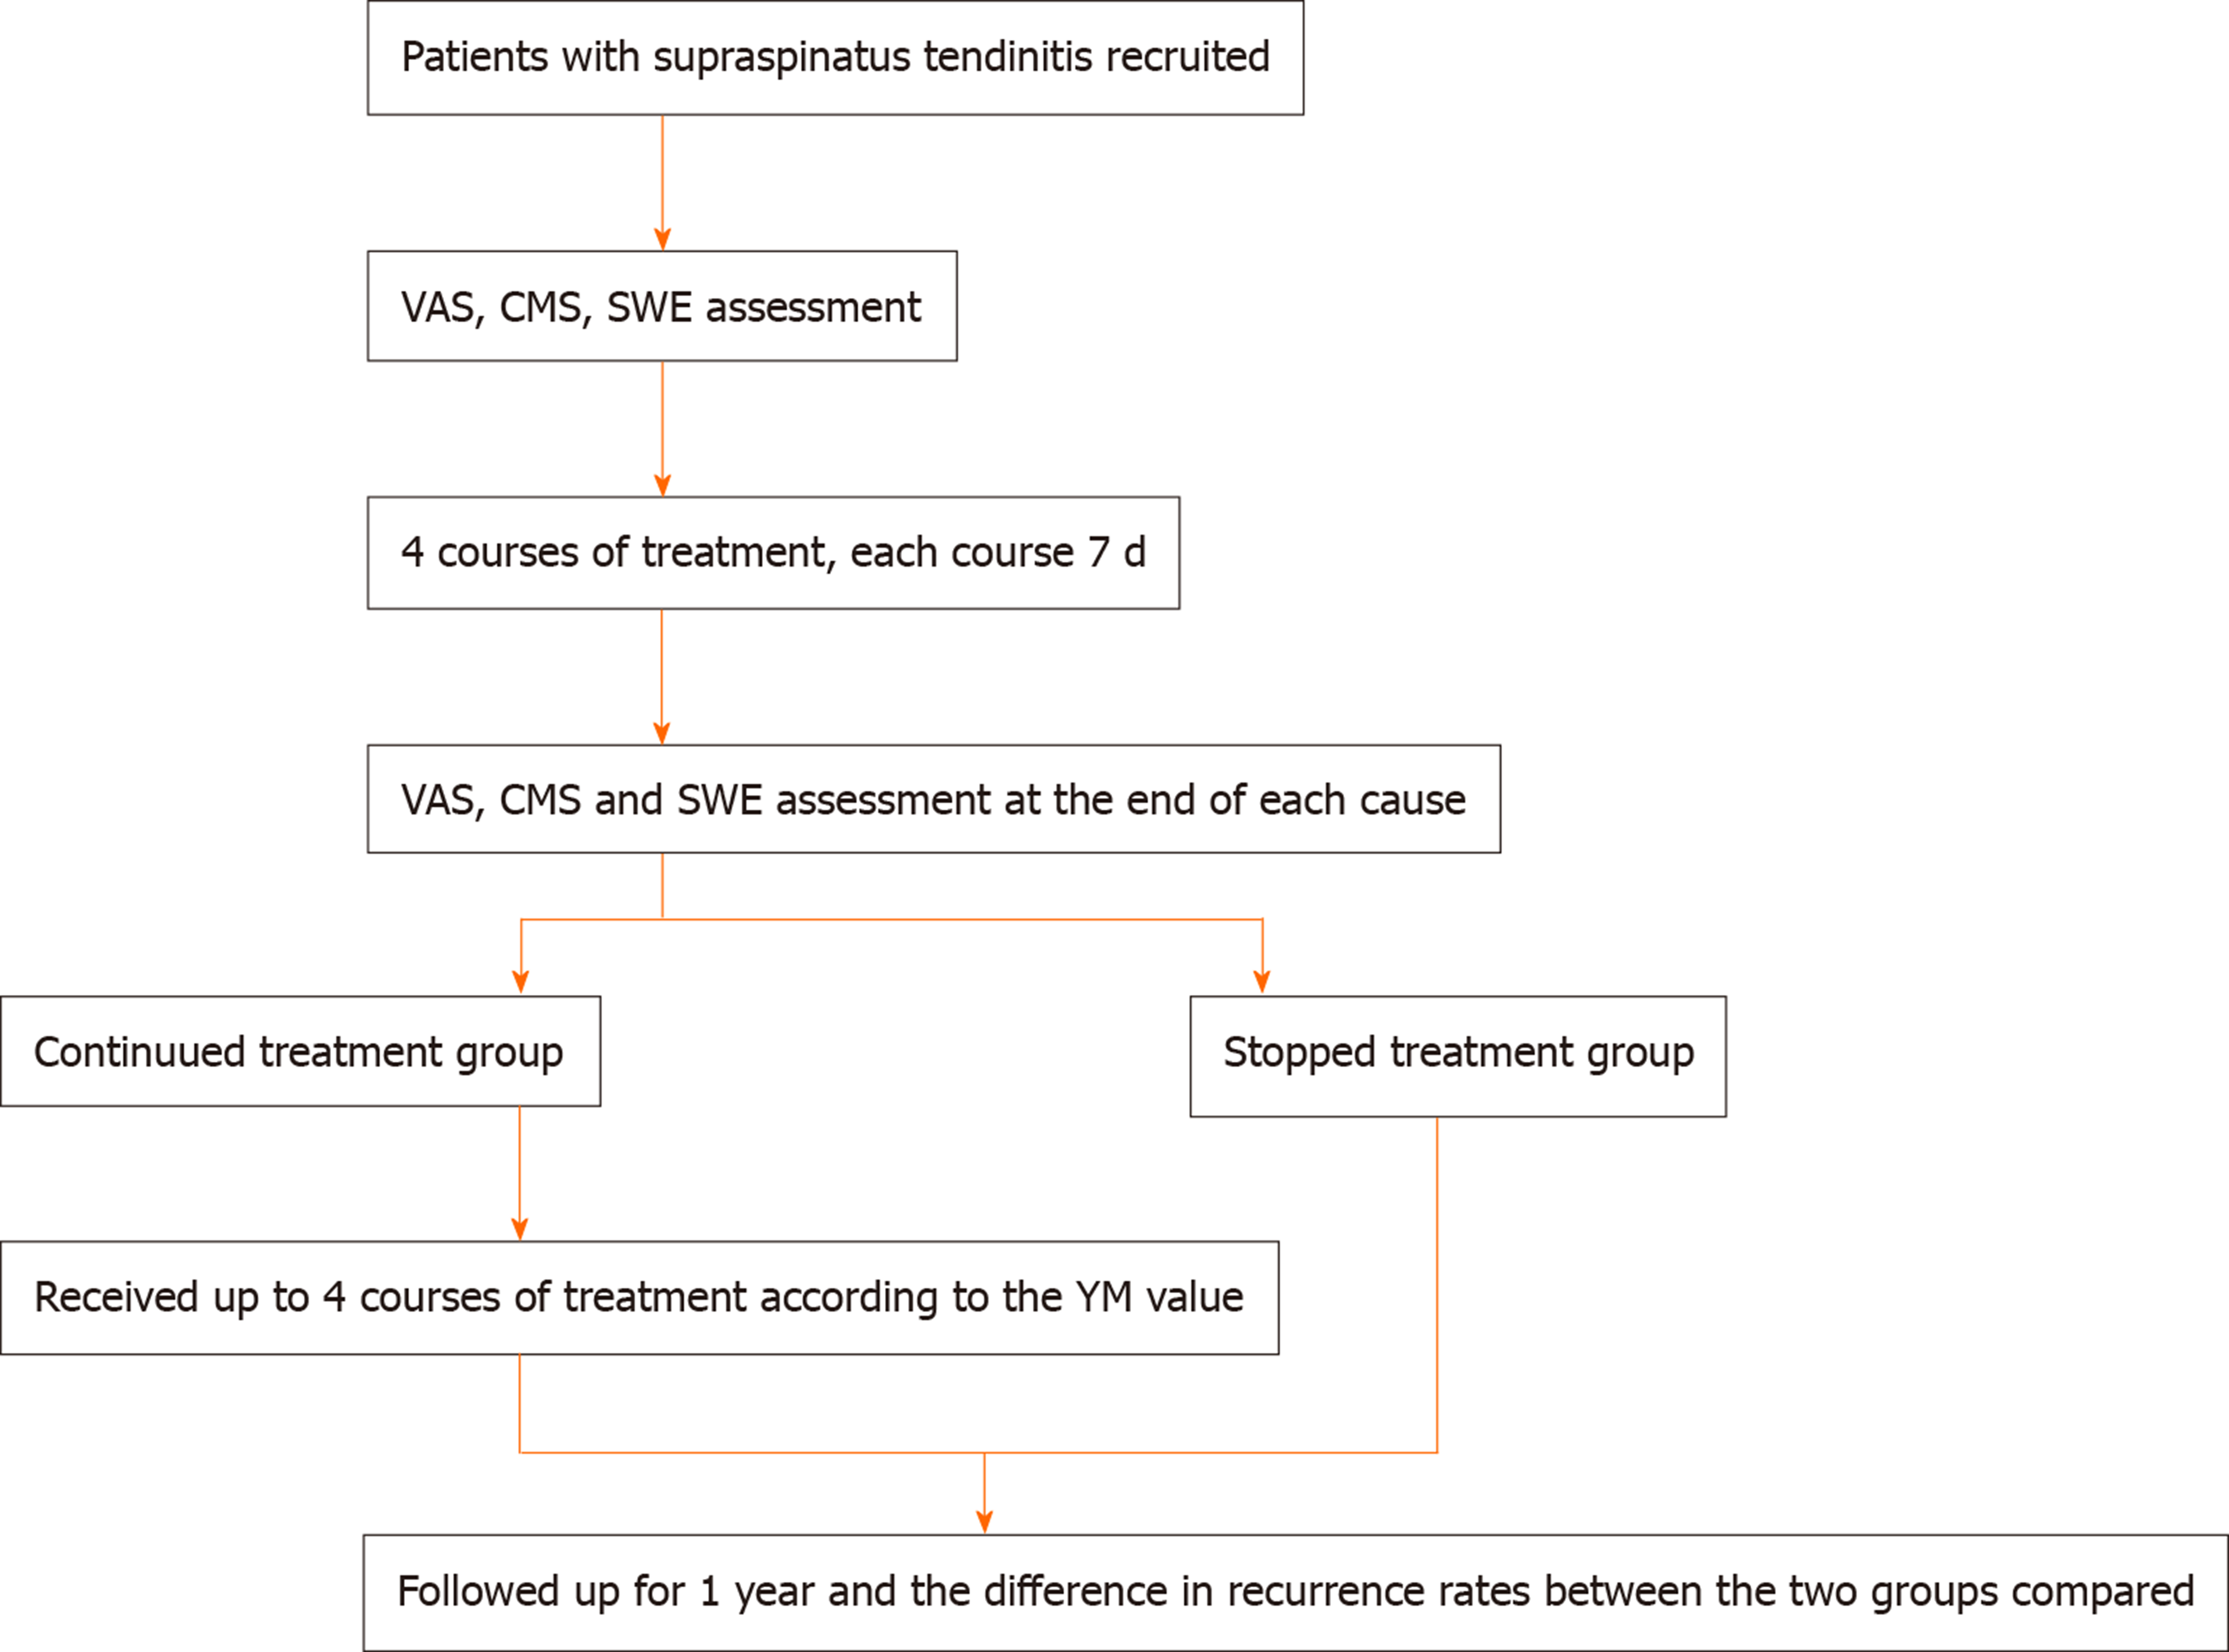
Figure 1 Flow chart of patients with supraspinatus tendinitis about recruitment, assessment, treatment and grouping.
CMS: Constant-Murley score; SWE: Shear wave elastography; VAS: Visual analogue scale.
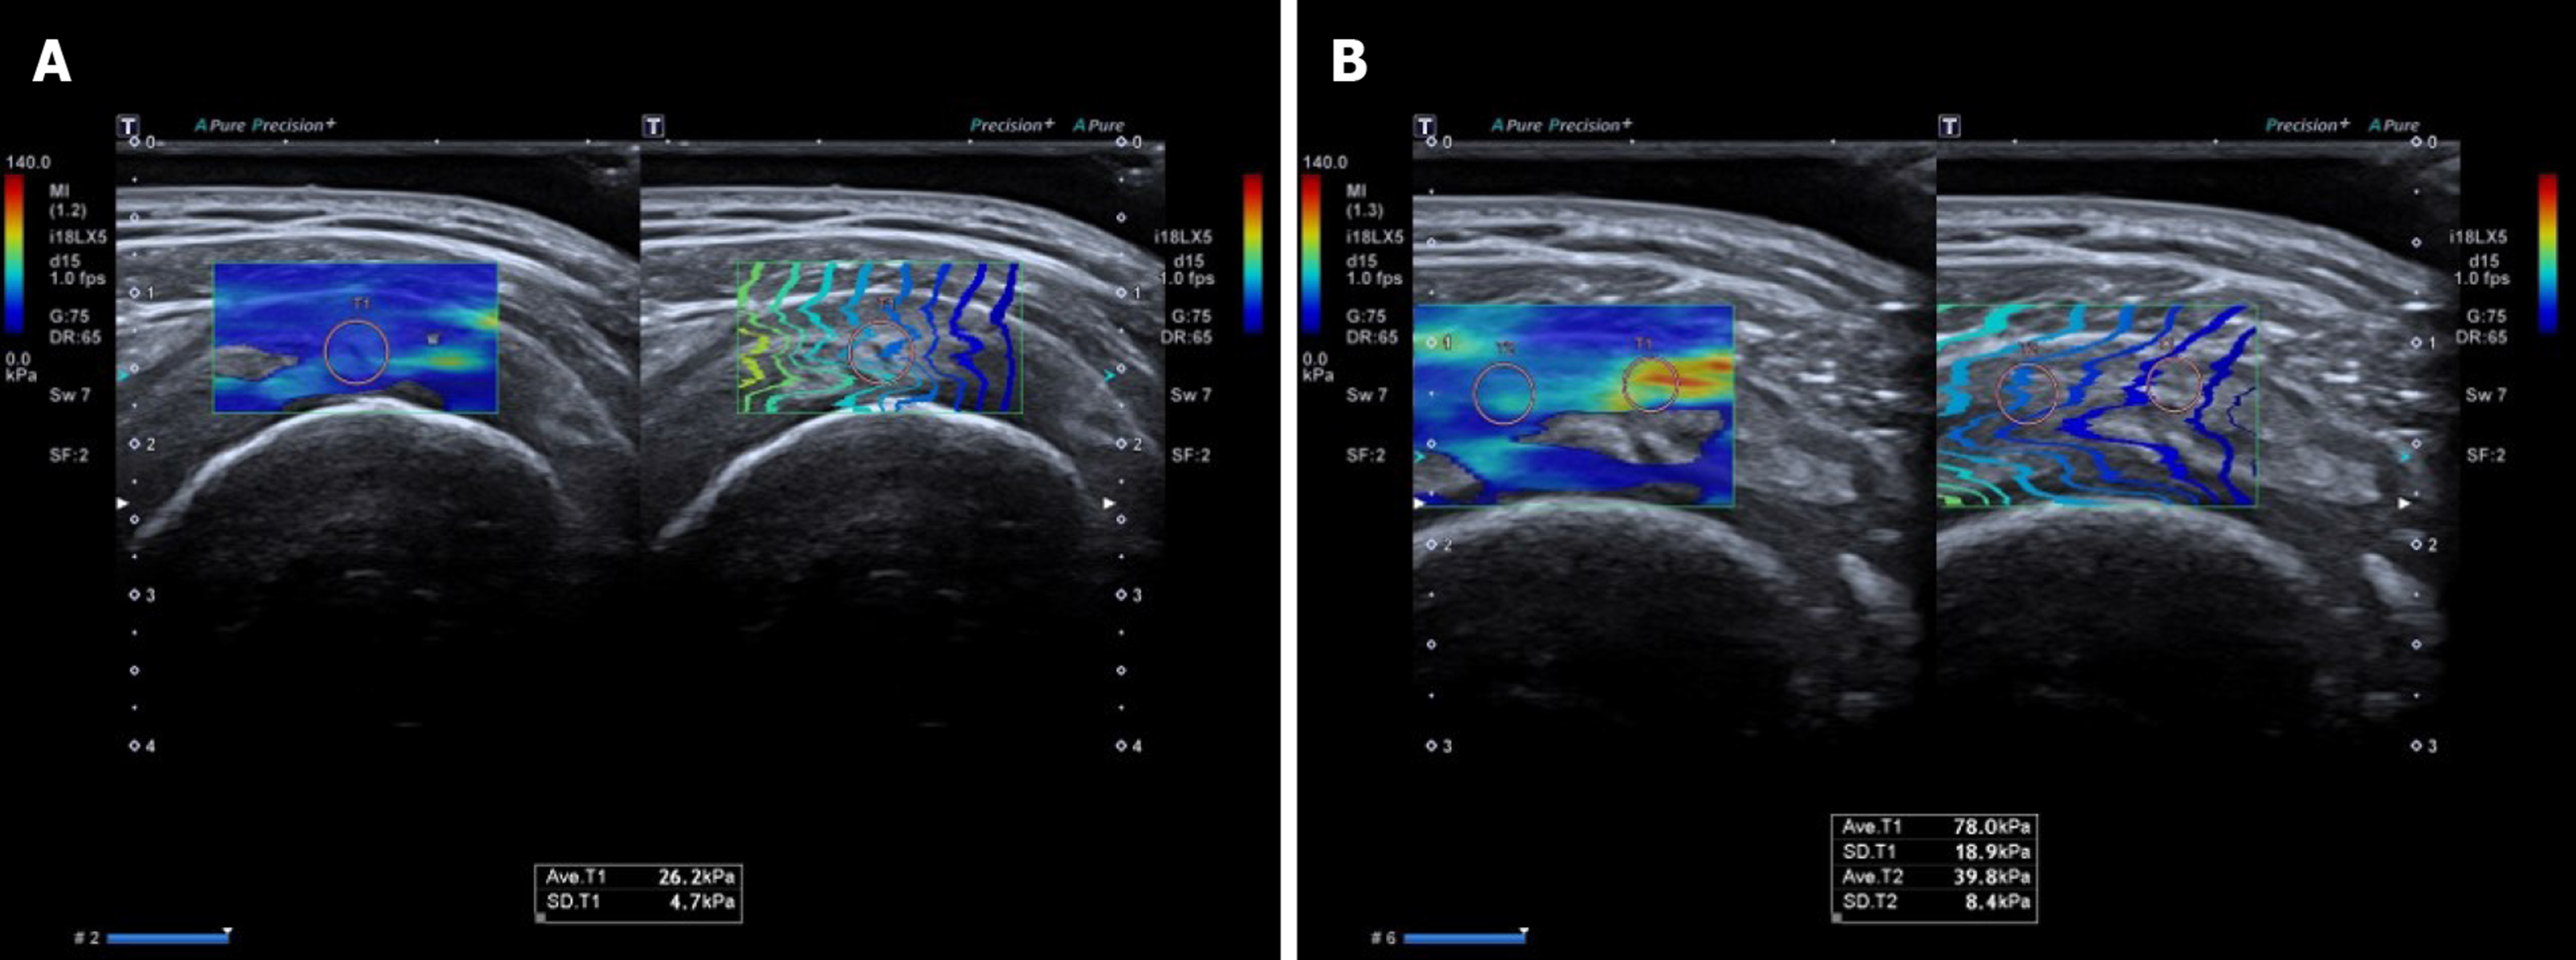
Figure 2 Shear wave elastography images of healthy volunteers and patients with supraspinatus tendinitis.
A: Shear wave elastography image of a healthy volunteer. The average Young’s modulus value was 26.2 ± 4.7 kPa; B: Shear wave elastography image of a patient with supraspinatus tendinitis. The average Young’s modulus value of the lesion area was 78.0 ± 18.9 kPa. The average Young’s modulus value of the surrounding normal muscle was 39.8 ± 8.4 kPa.
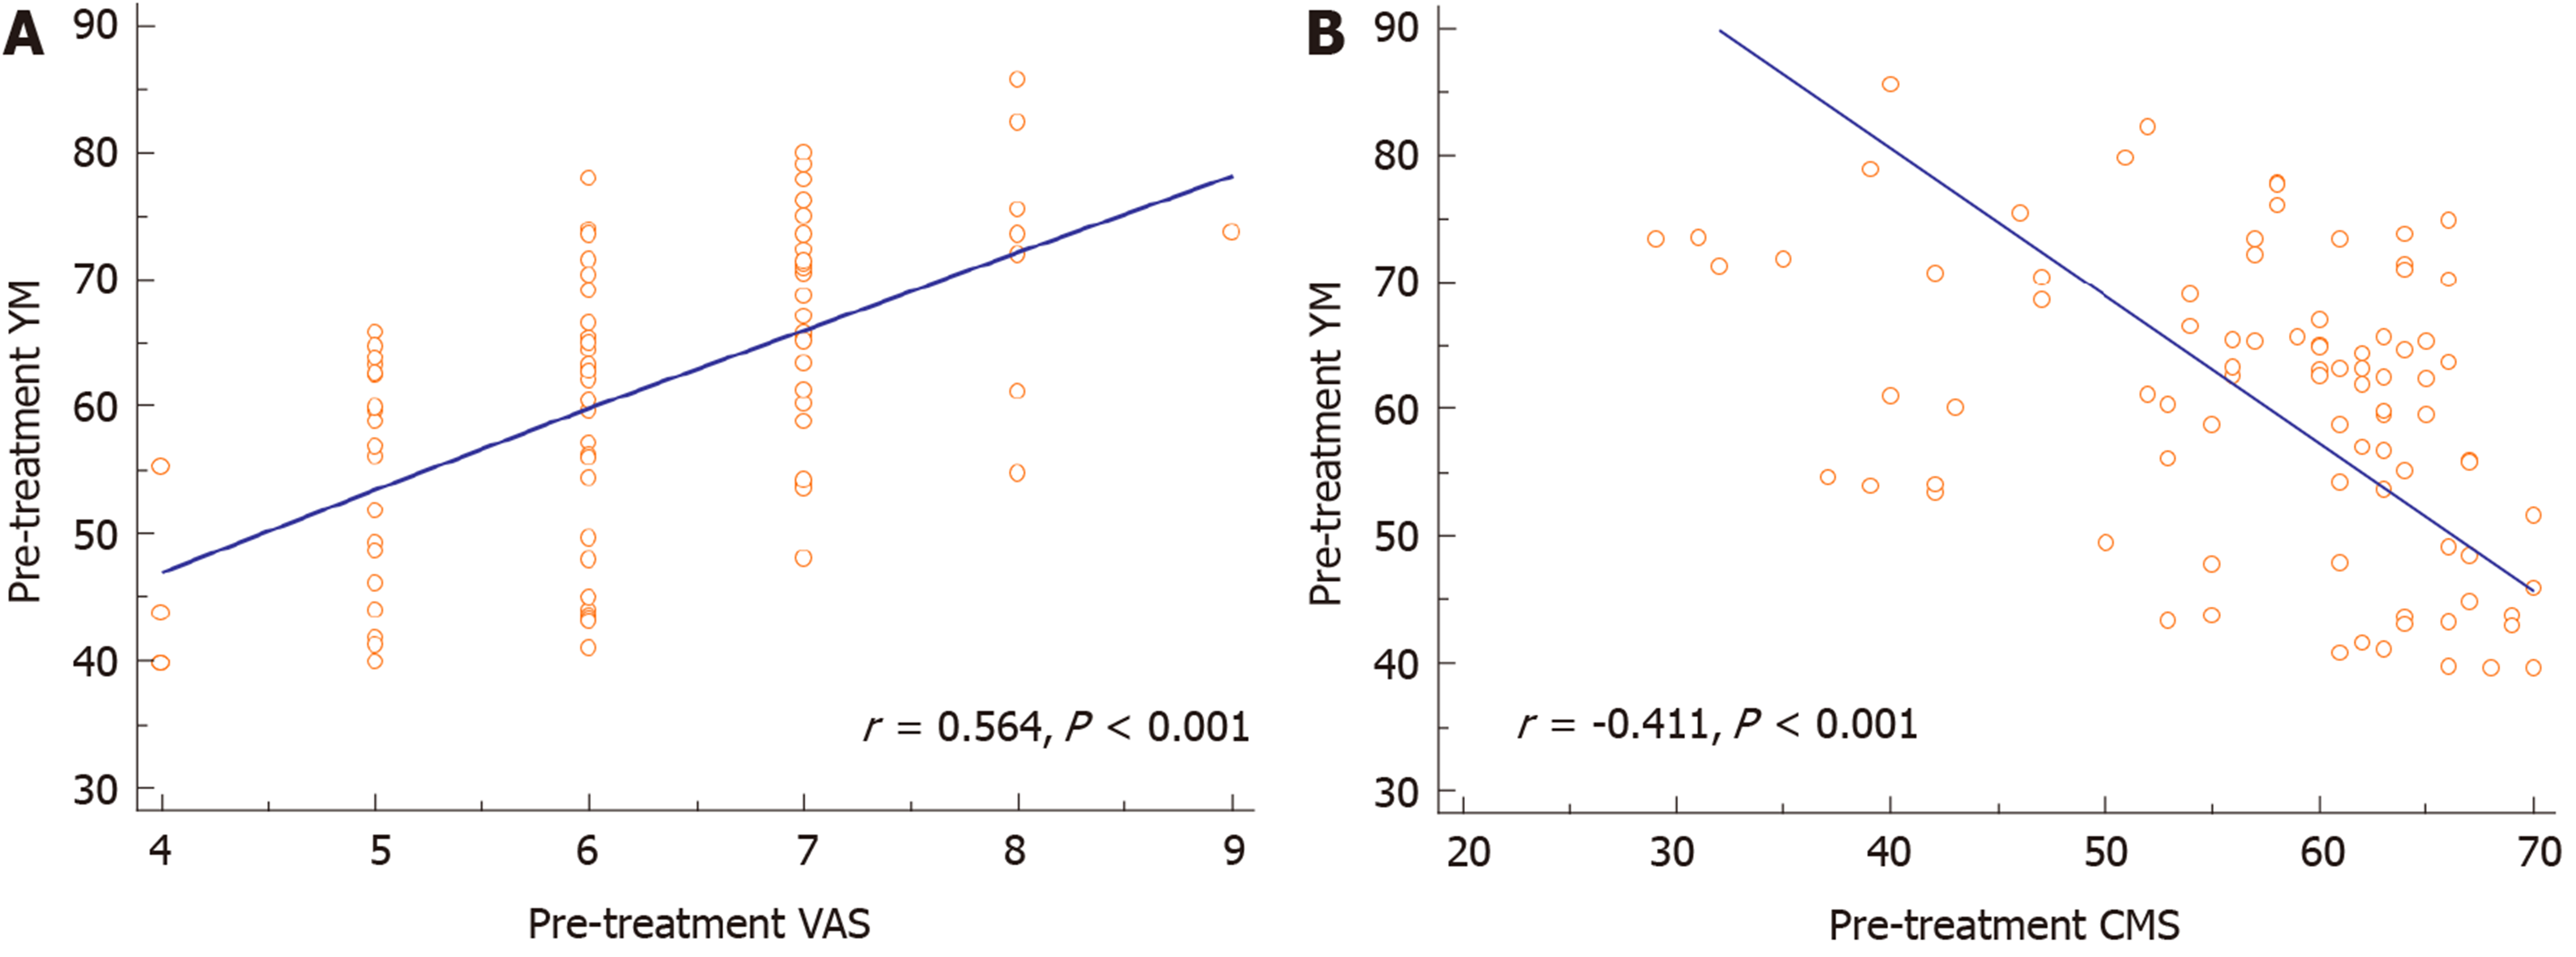
Figure 3 Correlation analysis between the Young’s modulus value and visual analogue scale and Constant-Murley score before treatment.
A: Correlation analysis between the Young’s modulus (YM) value and visual analogue scale (VAS) (r = 0.564, P < 0.001), indicating a positive correlation; B: Correlation analysis between the Young’s modulus value and Constant-Murley score (CMS) (r = -0.411, P < 0.001), indicating a negative correlation.
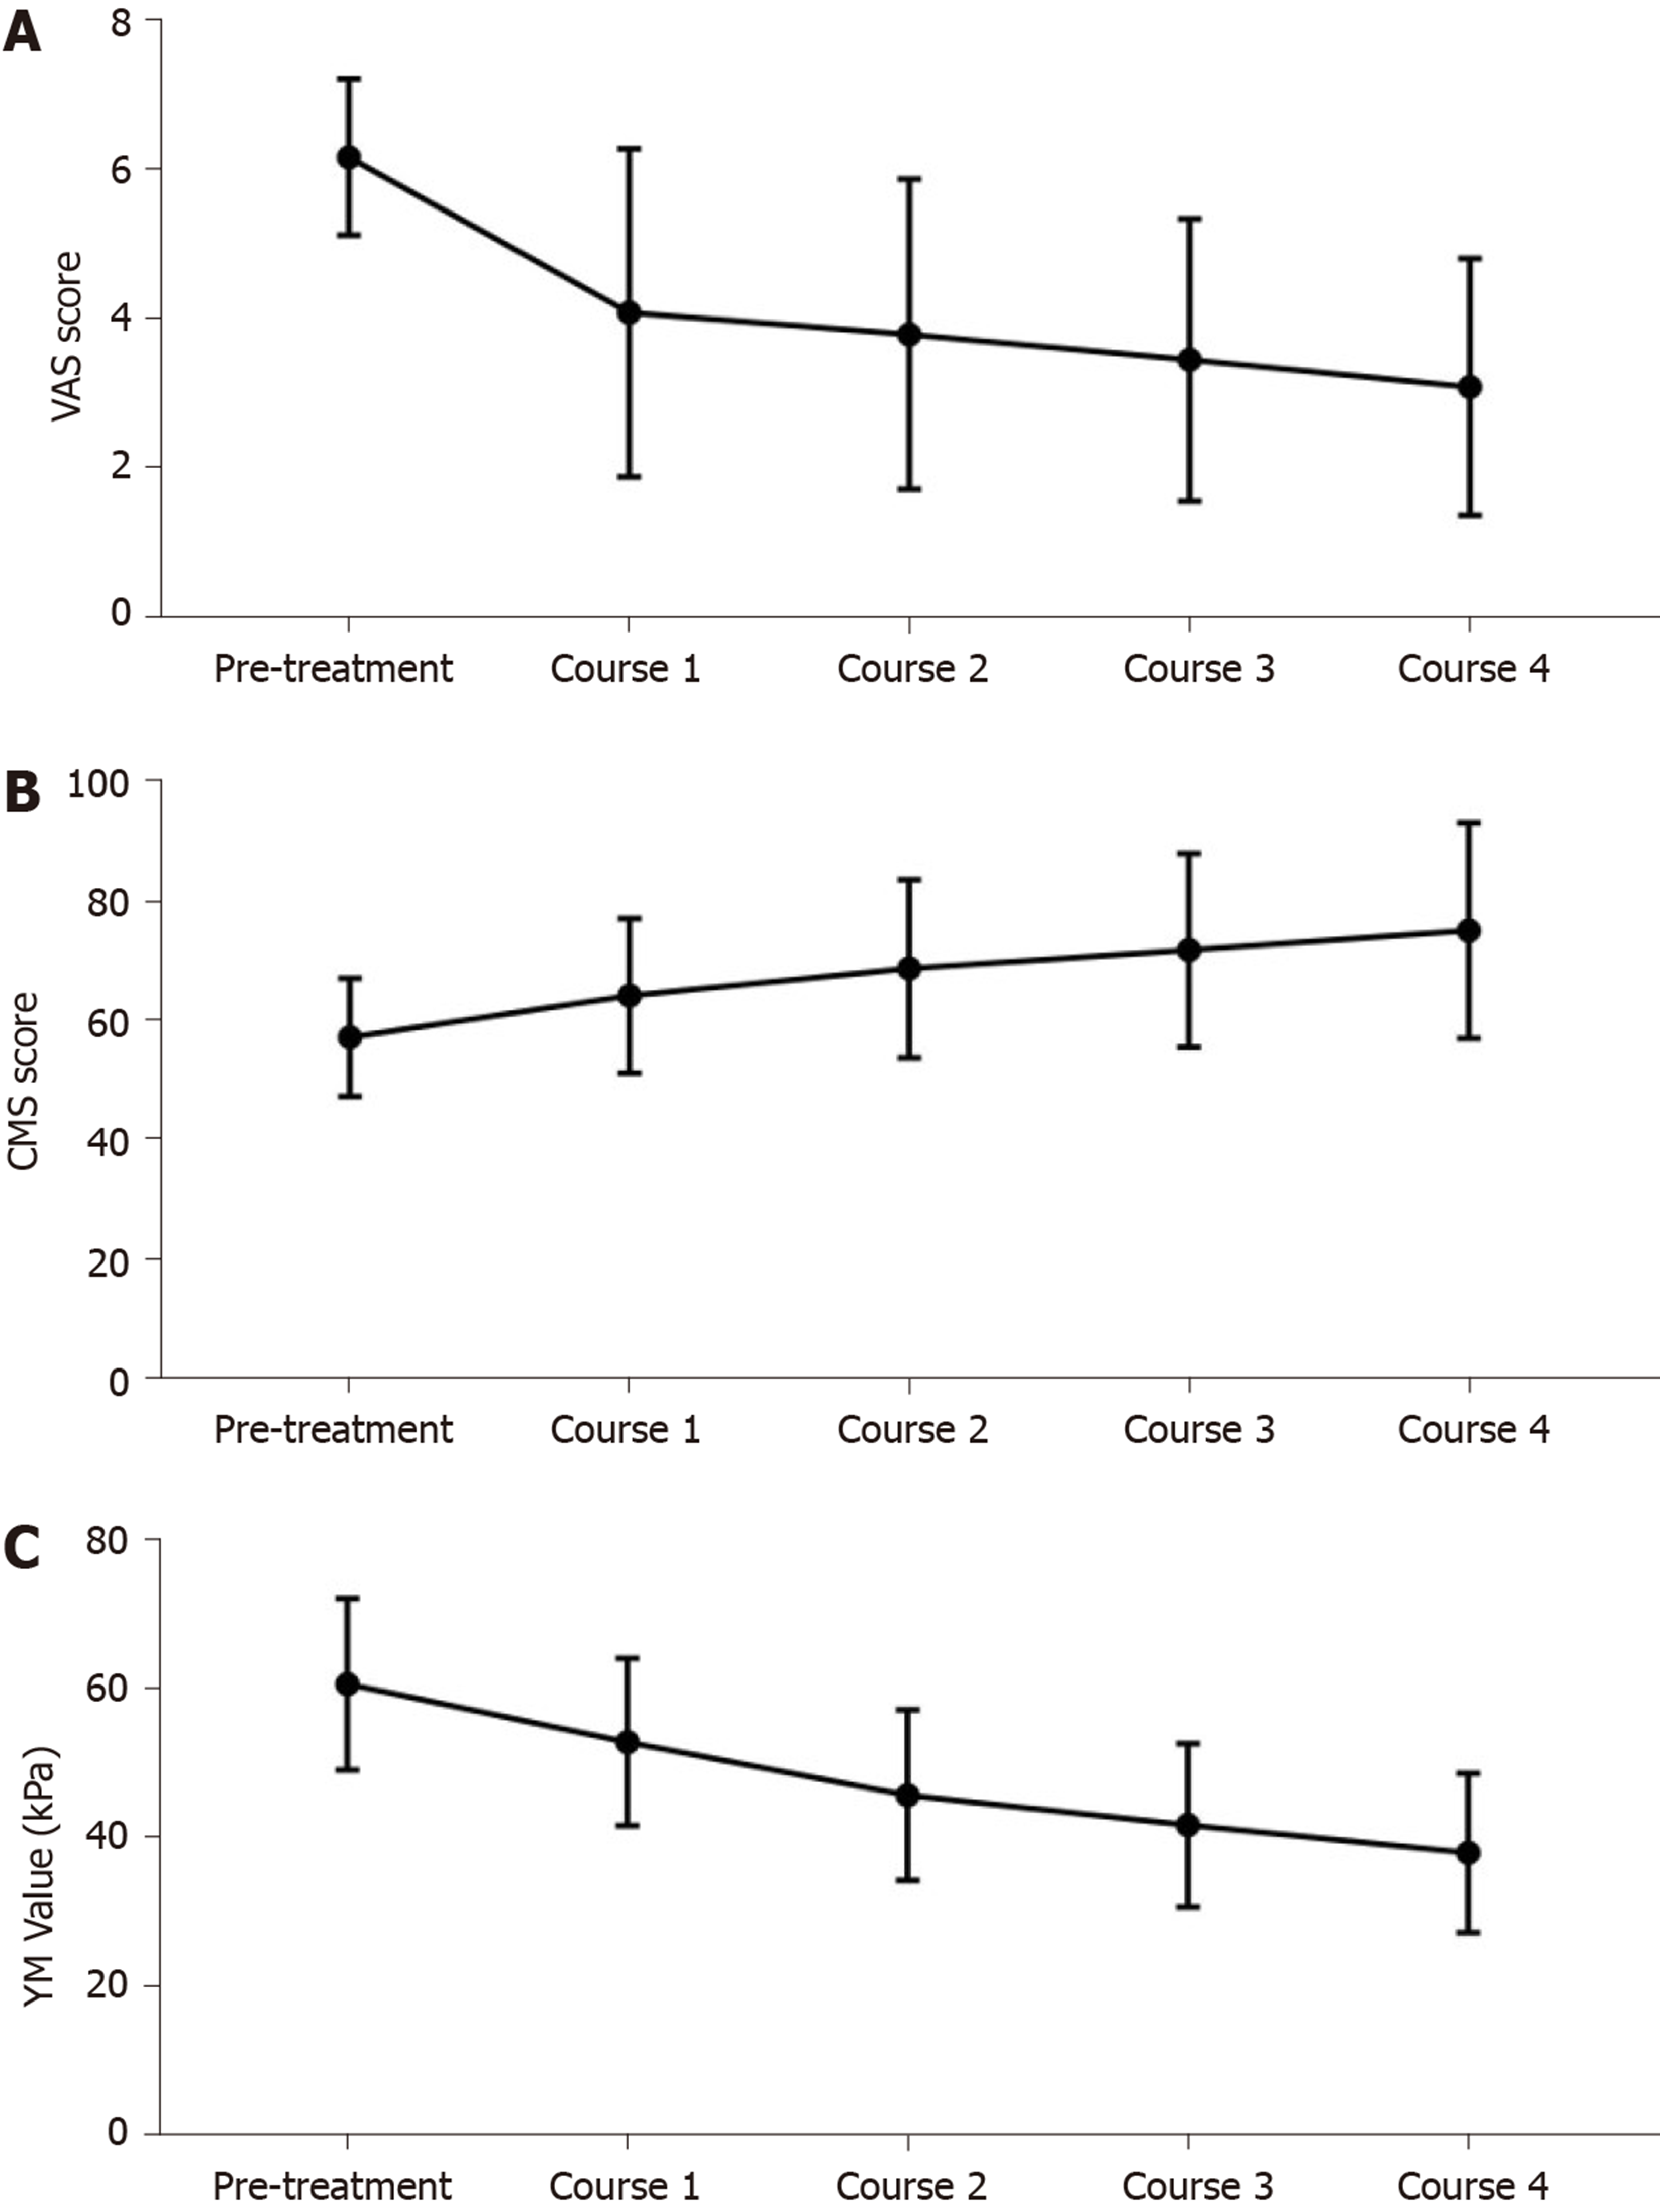
Figure 4 Trends in visual analogue scale, Constant-Murley score and Young’s modulus values of patients with supraspinatus tendinitis under different treatment courses.
A: Visual analogue scale (VAS) trend; B: Constant-Murley score (CMS) trend; C: Young’s modulus (YM) value trend.
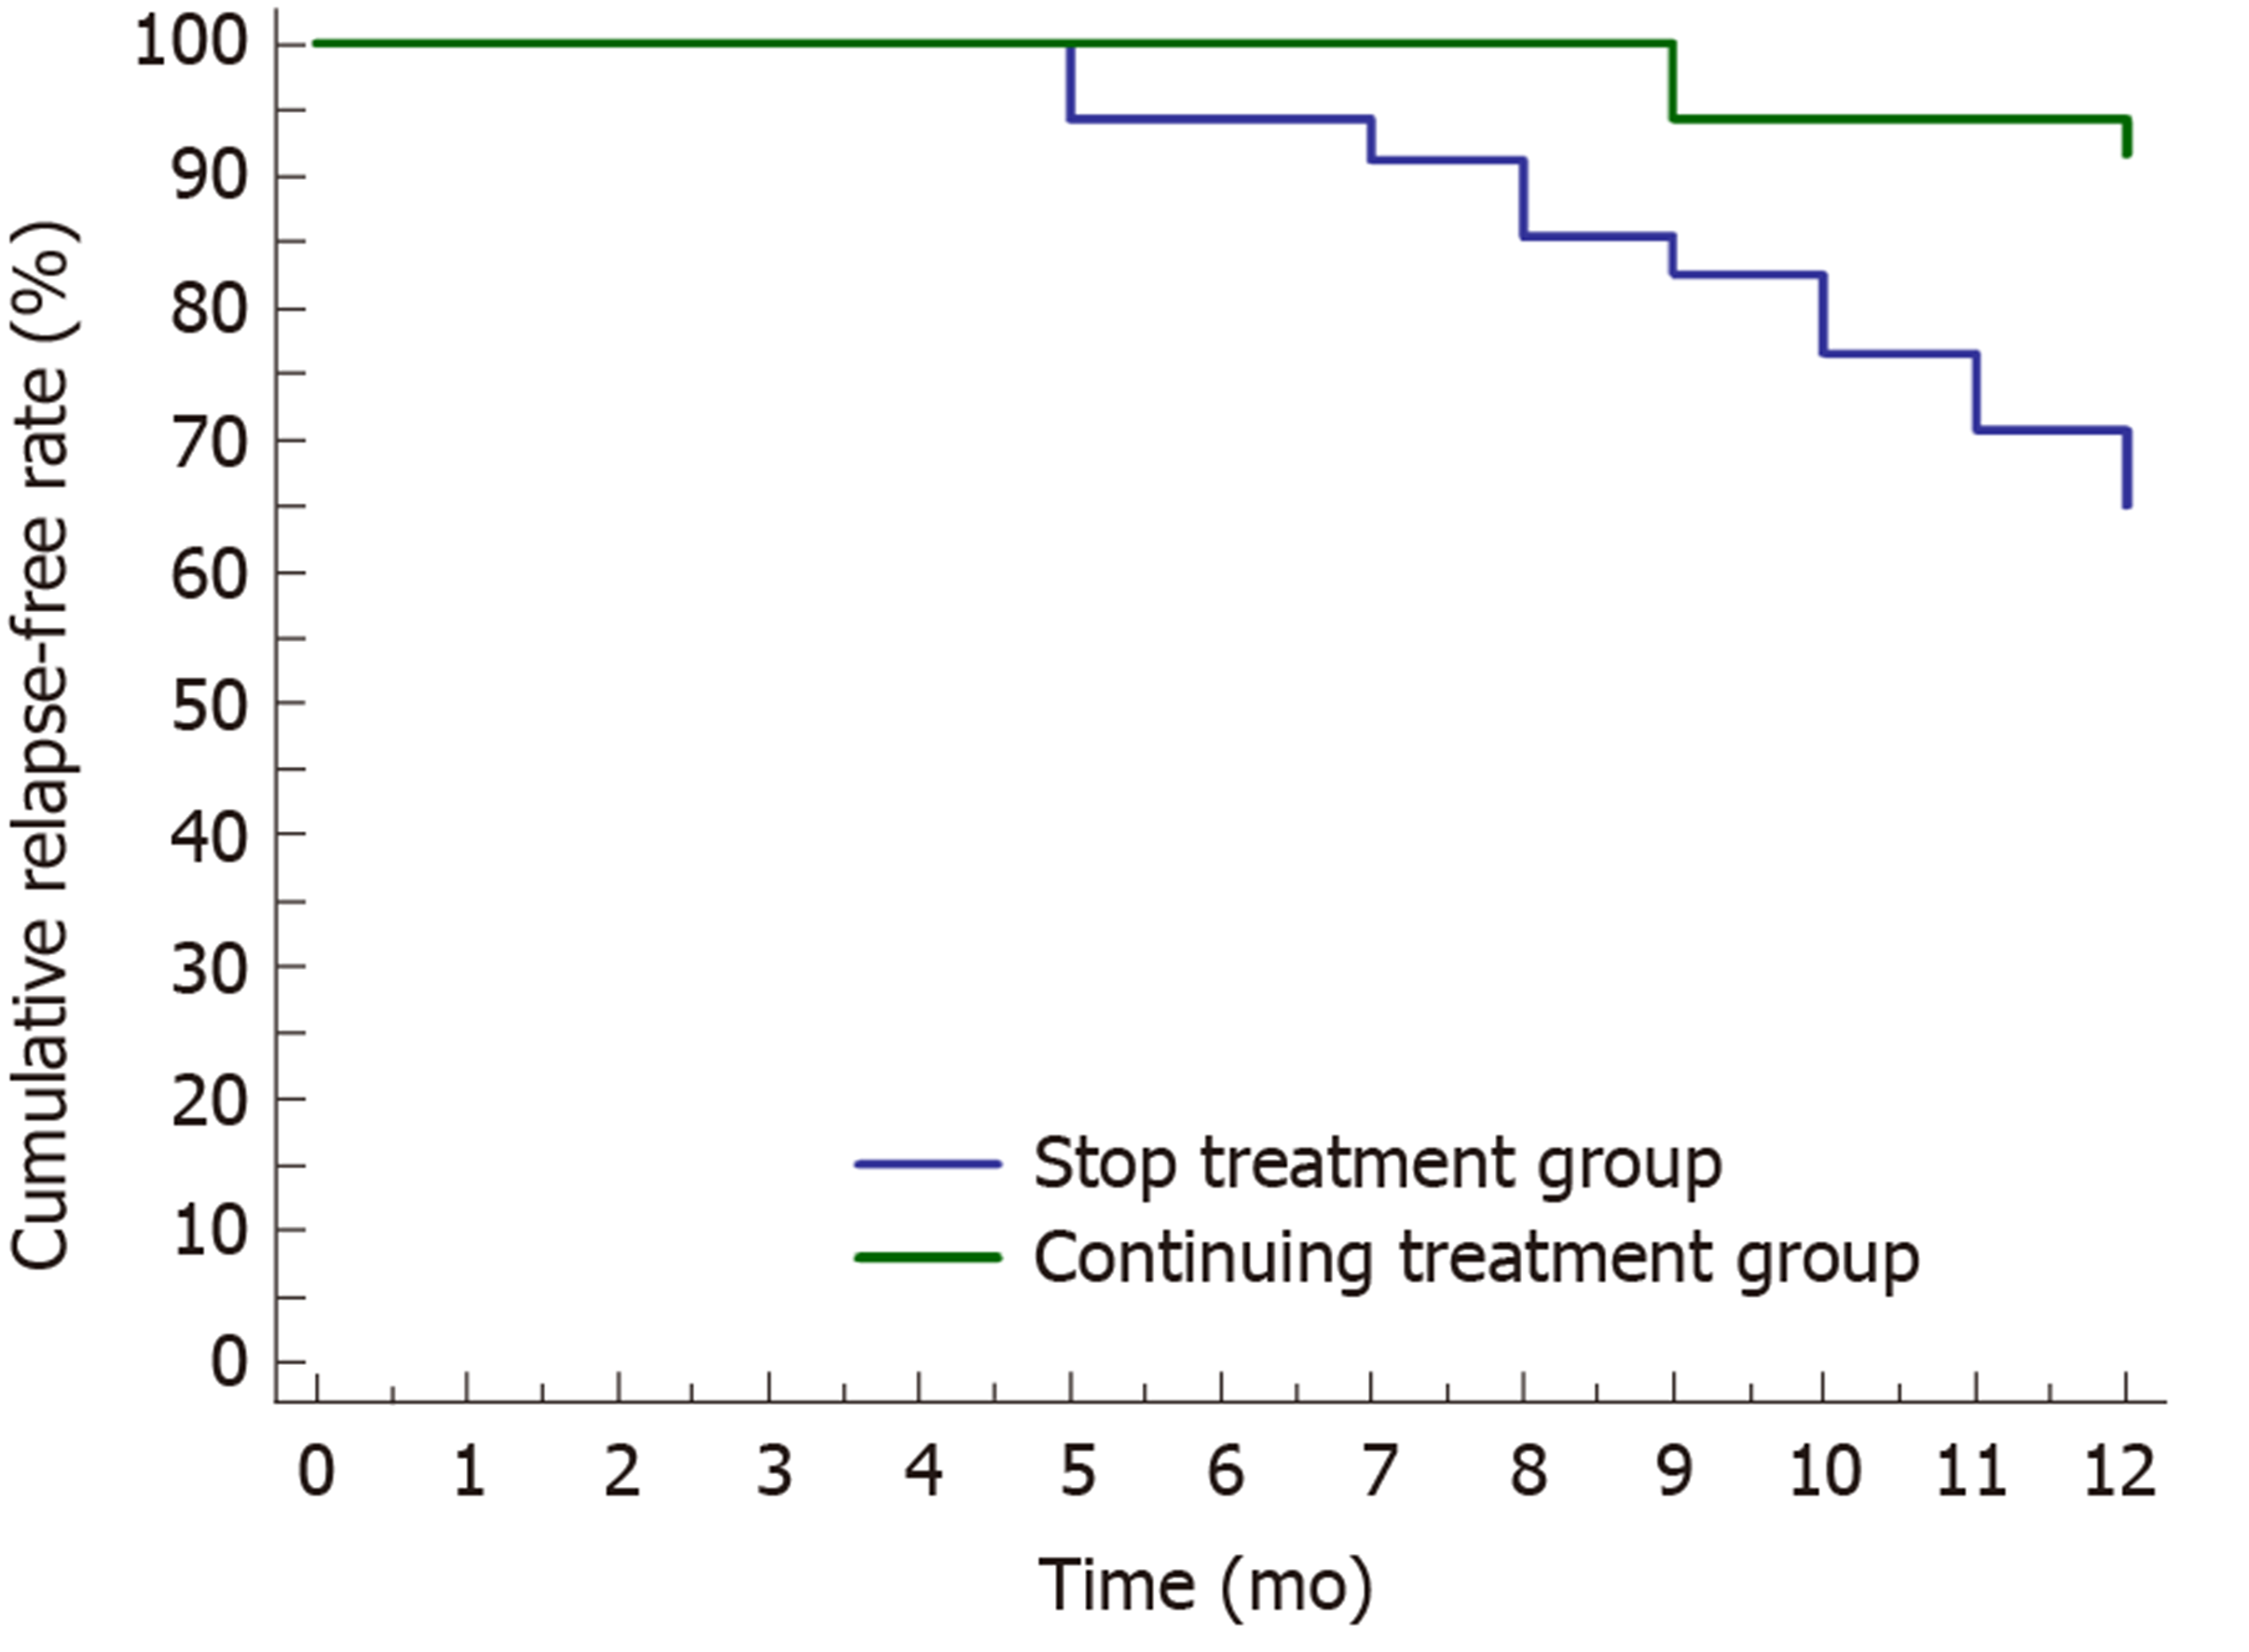
Figure 5 Difference in recurrence rates between the continued treatment group and stopped treatment group during follow-up.
- Citation: Zhou J, Yang DB, Wang J, Li HZ, Wang YC. Role of shear wave elastography in the evaluation of the treatment and prognosis of supraspinatus tendinitis. World J Clin Cases 2020; 8(14): 2977-2987
- URL: https://www.wjgnet.com/2307-8960/full/v8/i14/2977.htm
- DOI: https://dx.doi.org/10.12998/wjcc.v8.i14.2977


